

Measurability of the epidemic reproduction number in data-driven contact networks
- PMID: 30463945
- PMCID: PMC6294899
- DOI: 10.1073/pnas.1811115115
Measurability of the epidemic reproduction number in data-driven contact networks
Abstract
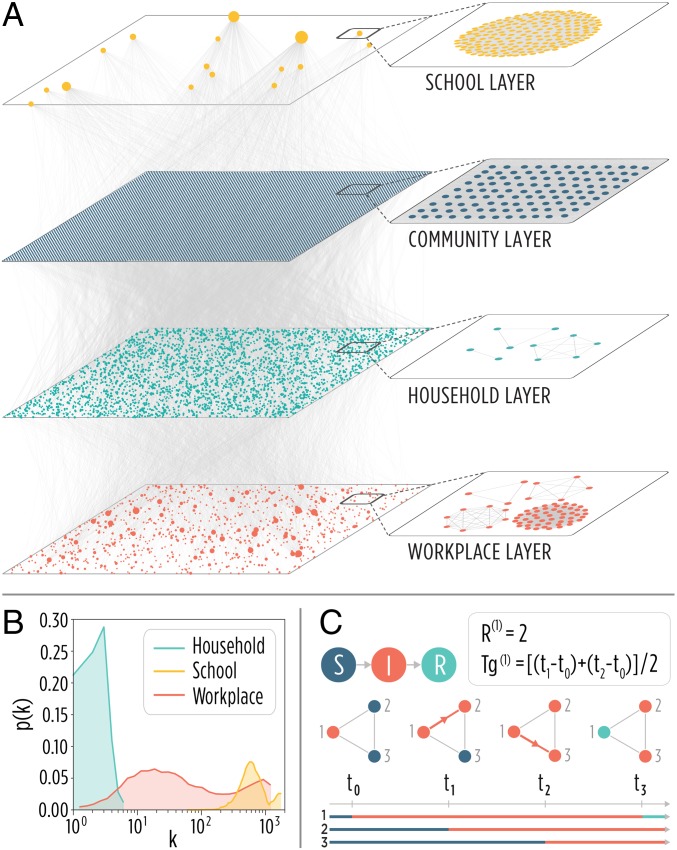
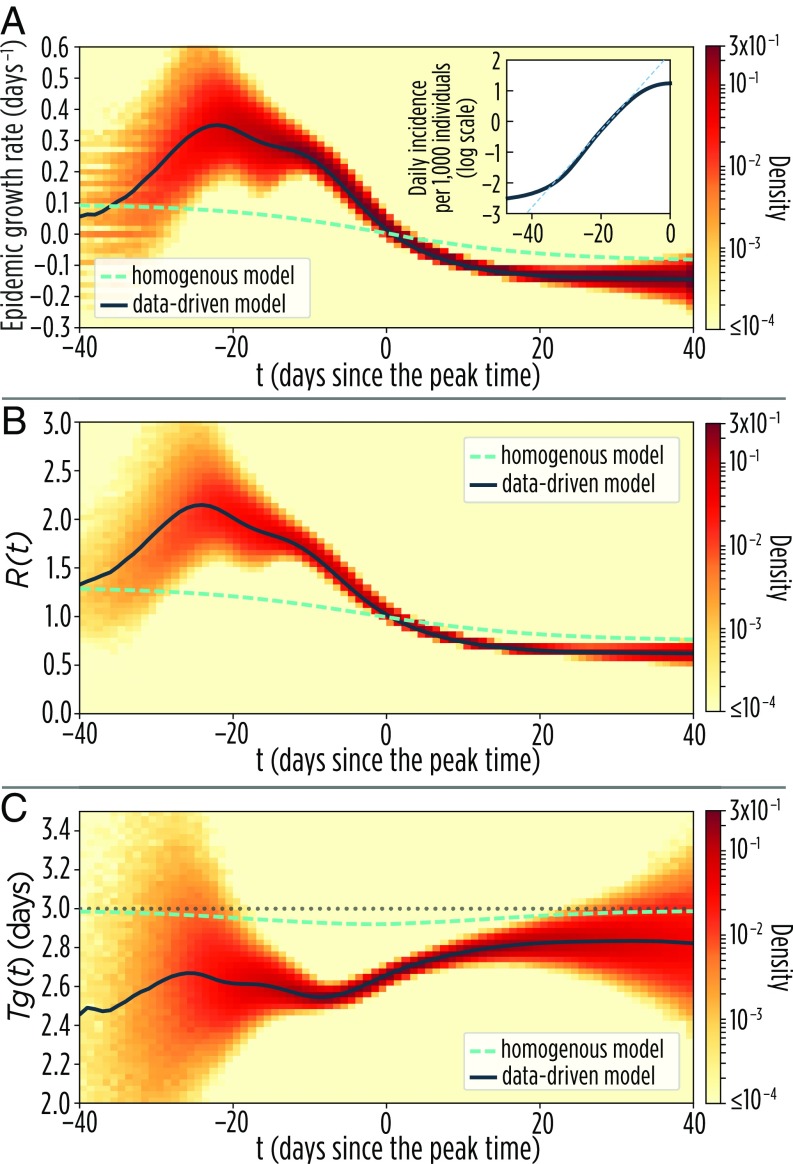
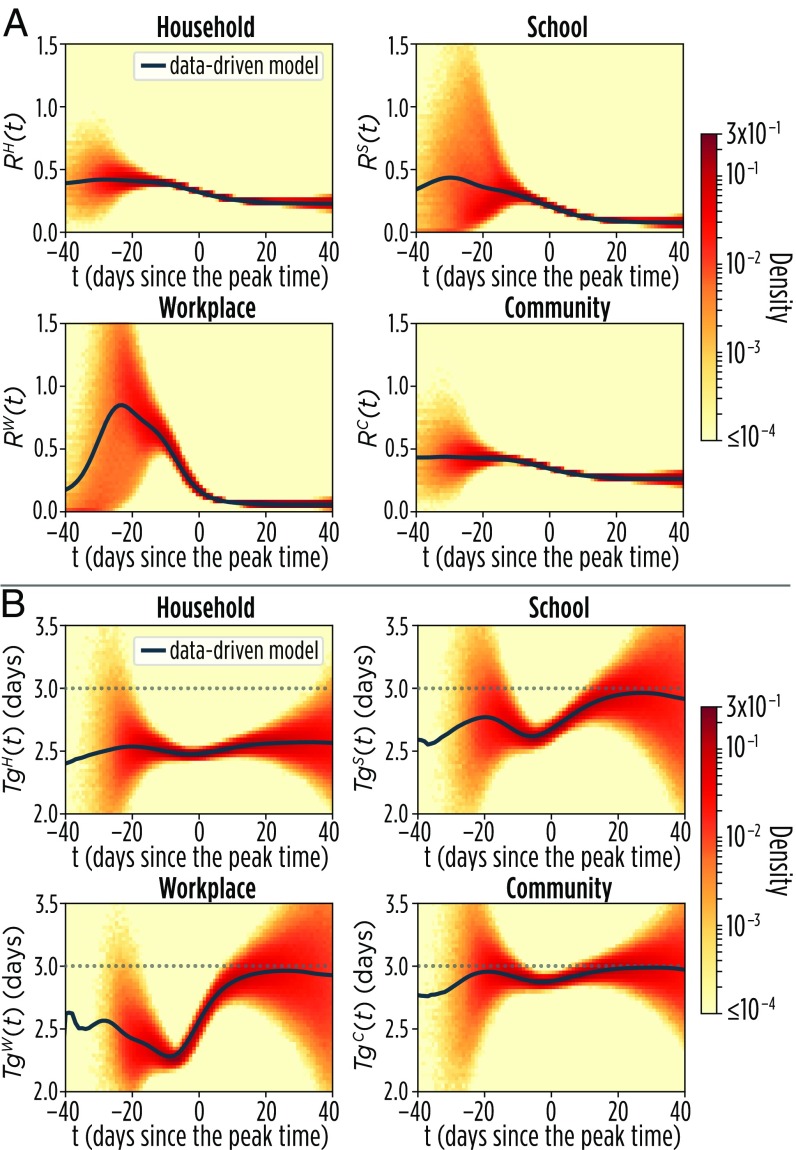
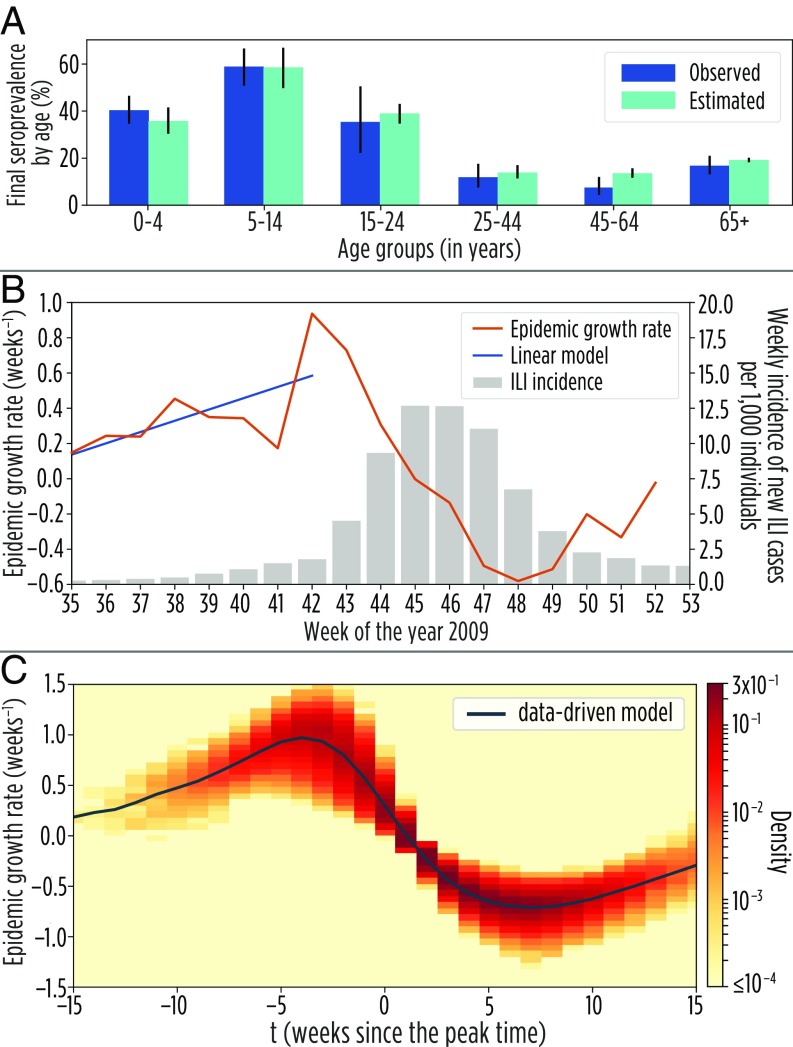
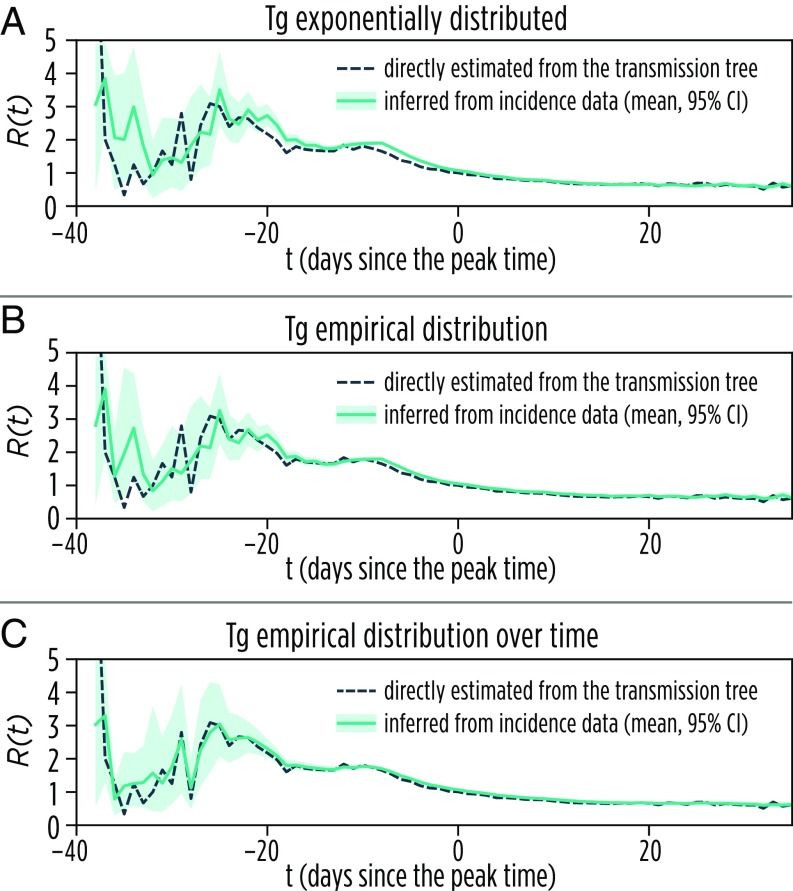
The basic reproduction number is one of the conceptual cornerstones of mathematical epidemiology. Its classical definition as the number of secondary cases generated by a typical infected individual in a fully susceptible population finds a clear analytical expression in homogeneous and stratified mixing models. Along with the generation time (the interval between primary and secondary cases), the reproduction number allows for the characterization of the dynamics of an epidemic. A clear-cut theoretical picture, however, is hardly found in real data. Here, we infer from highly detailed sociodemographic data two multiplex contact networks representative of a subset of the Italian and Dutch populations. We then simulate an infection transmission process on these networks accounting for the natural history of influenza and calibrated on empirical epidemiological data. We explicitly measure the reproduction number and generation time, recording all individual-level transmission events. We find that the classical concept of the basic reproduction number is untenable in realistic populations, and it does not provide any conceptual understanding of the epidemic evolution. This departure from the classical theoretical picture is not due to behavioral changes and other exogenous epidemiological determinants. Rather, it can be simply explained by the (clustered) contact structure of the population. Finally, we provide evidence that methodologies aimed at estimating the instantaneous reproduction number can operationally be used to characterize the correct epidemic dynamics from incidence data.
Keywords: computational modeling; generation time; infectious diseases; multiplex networks; reproduction number.
Copyright © 2018 the Author(s). Published by PNAS.
Conflict of interest statement
The authors declare no conflict of interest.
Figures
Similar articles
-
Stochastic epidemic models featuring contact tracing with delays.Math Biosci. 2015 Aug;266:23-35. doi: 10.1016/j.mbs.2015.05.007. Epub 2015 May 30. Math Biosci. 2015. PMID: 26037511
-
Estimating the basic reproduction number from surveillance data on past epidemics.Math Biosci. 2014 Oct;256:89-101. doi: 10.1016/j.mbs.2014.08.007. Epub 2014 Aug 26. Math Biosci. 2014. PMID: 25168169
-
Effects of contact network structure on epidemic transmission trees: implications for data required to estimate network structure.Stat Med. 2018 Jan 30;37(2):236-248. doi: 10.1002/sim.7259. Epub 2017 Feb 13. Stat Med. 2018. PMID: 28192859 Free PMC article.
-
Mathematical models to characterize early epidemic growth: A review.Phys Life Rev. 2016 Sep;18:66-97. doi: 10.1016/j.plrev.2016.07.005. Epub 2016 Jul 11. Phys Life Rev. 2016. PMID: 27451336 Free PMC article. Review.
-
Mathematical prediction in infection.Medicine (Abingdon). 2009 Oct;37(10):507-509. doi: 10.1016/j.mpmed.2009.07.004. Epub 2009 Sep 19. Medicine (Abingdon). 2009. PMID: 32288567 Free PMC article. Review.
Cited by
-
Susceptibility to Resurgent COVID-19 Outbreaks Following Vaccine Rollouts: A Modeling Study.Viruses. 2022 Oct 12;14(10):2237. doi: 10.3390/v14102237. Viruses. 2022. PMID: 36298791 Free PMC article.
-
Spatial and temporal regularization to estimate COVID-19 reproduction number R(t): Promoting piecewise smoothness via convex optimization.PLoS One. 2020 Aug 20;15(8):e0237901. doi: 10.1371/journal.pone.0237901. eCollection 2020. PLoS One. 2020. PMID: 32817697 Free PMC article.
-
Influenza viruses and coronaviruses: Knowns, unknowns, and common research challenges.PLoS Pathog. 2021 Dec 30;17(12):e1010106. doi: 10.1371/journal.ppat.1010106. eCollection 2021 Dec. PLoS Pathog. 2021. PMID: 34969061 Free PMC article. Review.
-
Assessing the short-run effects of lockdown policies on economic activity, with an application to the Santiago Metropolitan Region, Chile.PLoS One. 2021 Jun 21;16(6):e0252938. doi: 10.1371/journal.pone.0252938. eCollection 2021. PLoS One. 2021. PMID: 34153046 Free PMC article.
-
Assessing the impact of interventions on the major Omicron BA.2 outbreak in spring 2022 in Shanghai.Infect Dis Model. 2024 Feb 28;9(2):519-526. doi: 10.1016/j.idm.2024.02.013. eCollection 2024 Jun. Infect Dis Model. 2024. PMID: 38463154 Free PMC article.
References
-
- Anderson RM, May RM, Anderson B. Infectious Diseases of Humans: Dynamics and Control. Oxford Univ Press; Oxford: 1991.
Publication types
MeSH terms
Grants and funding
LinkOut - more resources
Full Text Sources
Medical
Molecular Biology Databases
