. 2018 Dec 11;115(50):E11837-E11846.
doi: 10.1073/pnas.1809662115. Epub 2018 Nov 21.

TRPV1 pore turret dictates distinct DkTx and capsaicin gating

Affiliations

TRPV1 pore turret dictates distinct DkTx and capsaicin gating

Matan Geron et al. Proc Natl Acad Sci U S A. .

Abstract

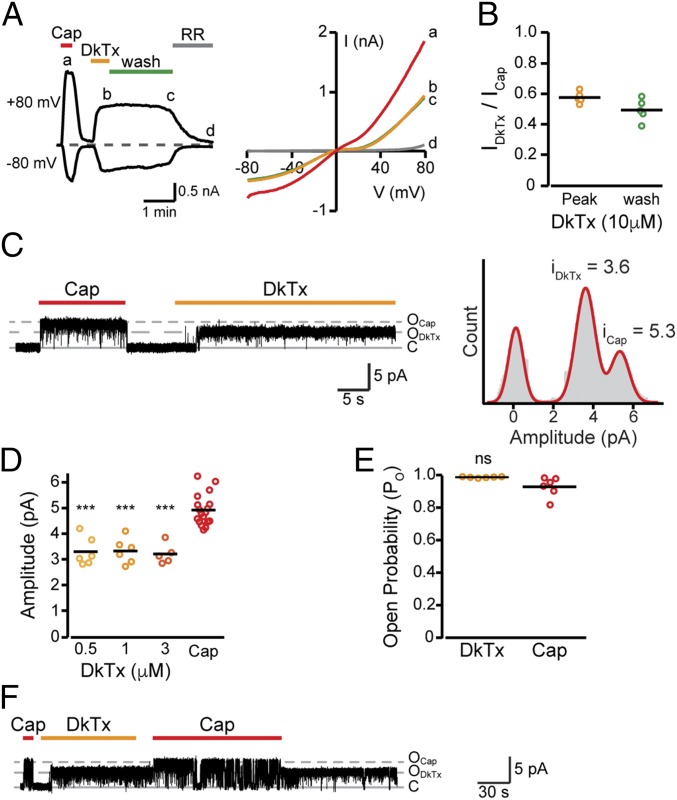
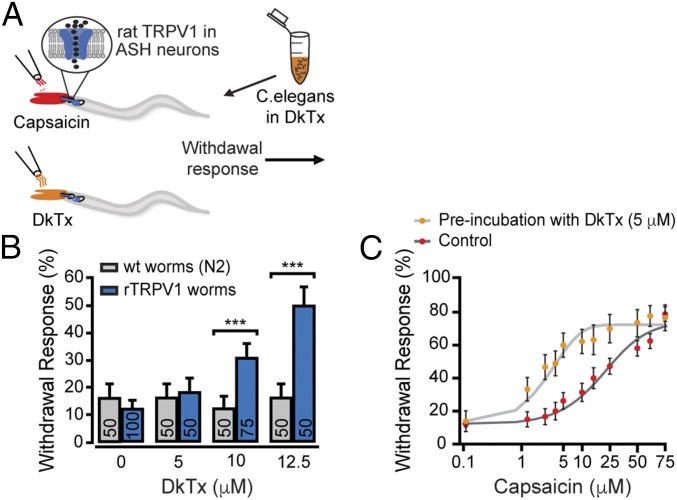
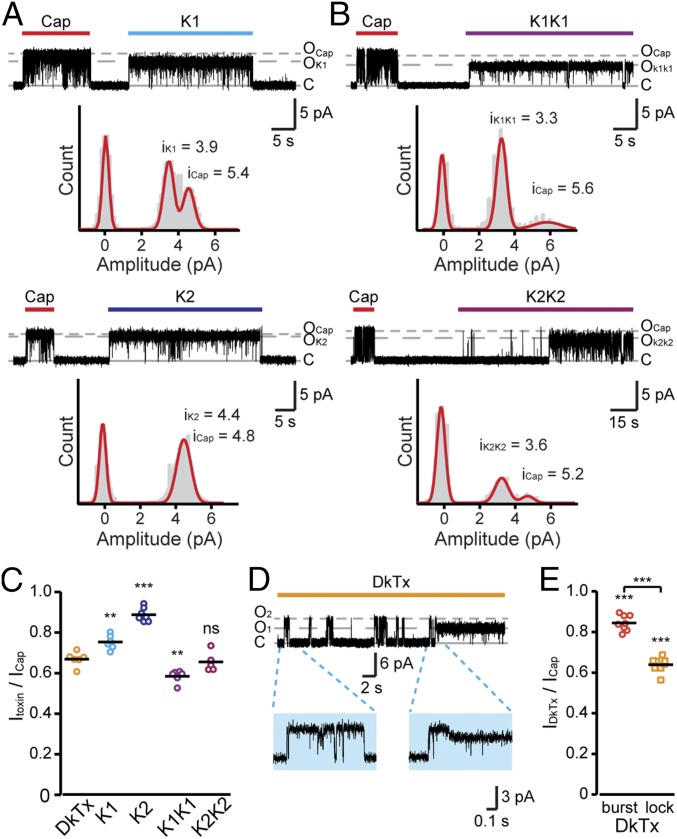
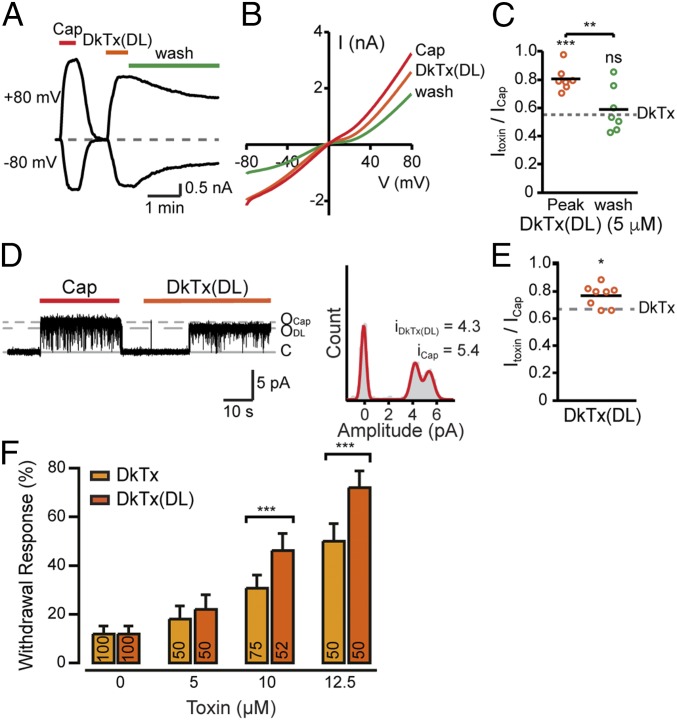
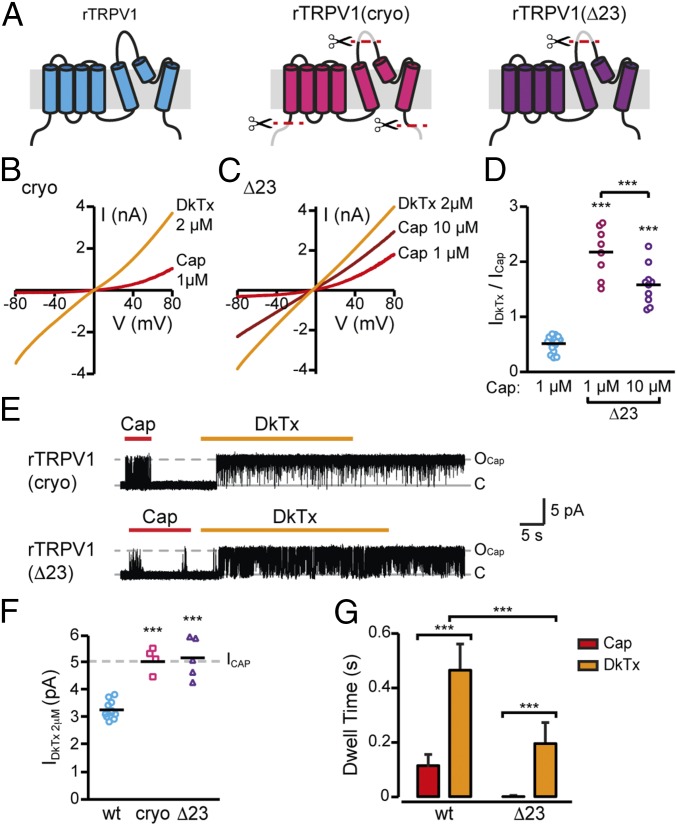
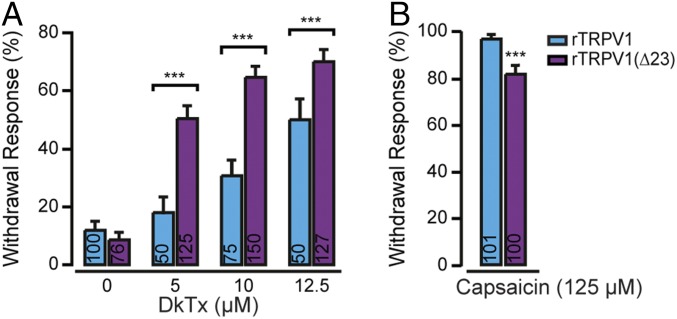
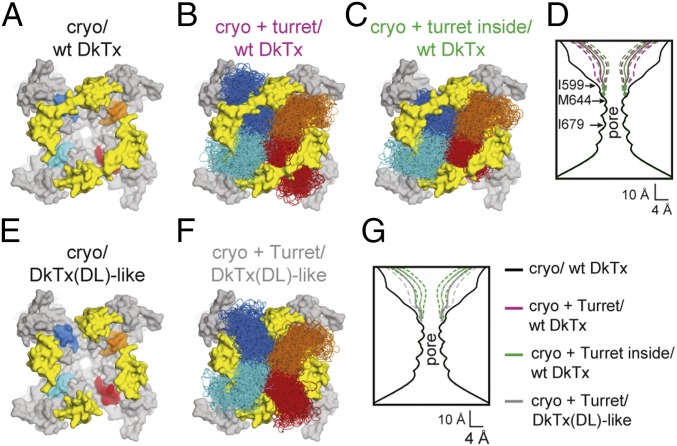
Many neurotoxins inflict pain by targeting receptors expressed on nociceptors, such as the polymodal cationic channel TRPV1. The tarantula double-knot toxin (DkTx) is a peptide with an atypical bivalent structure, providing it with the unique capability to lock TRPV1 in its open state and evoke an irreversible channel activation. Here, we describe a distinct gating mechanism of DkTx-evoked TRPV1 activation. Interestingly, DkTx evokes significantly smaller TRPV1 macroscopic currents than capsaicin, with a significantly lower unitary conductance. Accordingly, while capsaicin evokes aversive behaviors in TRPV1-transgenic Caenorhabditis elegans, DkTx fails to evoke such response at physiological concentrations. To determine the structural feature(s) responsible for this phenomenon, we engineered and evaluated a series of mutated toxins and TRPV1 channels. We found that elongating the DkTx linker, which connects its two knots, increases channel conductance compared with currents elicited by the native toxin. Importantly, deletion of the TRPV1 pore turret, a stretch of amino acids protruding out of the channel's outer pore region, is sufficient to produce both full conductance and aversive behaviors in response to DkTx. Interestingly, this deletion decreases the capsaicin-evoked channel activation. Taken together with structure modeling analysis, our results demonstrate that the TRPV1 pore turret restricts DkTx-mediated pore opening, probably through steric hindrance, limiting the current size and mitigating the evoked downstream physiological response. Overall, our findings reveal that DkTx and capsaicin elicit distinct TRPV1 gating mechanisms and subsequent pain responses. Our results also indicate that the TRPV1 pore turret regulates the mechanisms of channel gating and permeation.

Keywords: DkTx; TRPV1; capsaicin; pore turret; transgenic C. elegans.


Conflict of interest statement

The authors declare no conflict of interest.

Figures

Fig. 1.
Fig. 1.
DkTx evokes a moderate TRPV1 activation. (A, Left) Representative whole-cell current traces from TREx HEK293T cells stably expressing rTRPV1 at −80 mV and +80 mV upon application of capsaicin (1 µM, red bar), DkTx (10 µM, orange bar), and ruthenium red (RR, gray bar) (n = 7). (A, Right) Current–voltage relationship traces (in 1-s−1 voltage-ramps between −80 mV to +80 mV) for the indicated points in A. (B) Mean/scatter-dot plot representing the amplitude of whole-cell currents in TREx HEK293T cells stably expressing rTRPV1 (Vm = +80 mV) at saturating DkTx concentration (10 µM, orange circles) and after subsequent 2 min of wash (green circles), normalized to the current amplitude of the saturating capsaicin response (1 µM) (n = 7); **P ≤ 0.01 (paired Student’s t test). (C, Left) Representative current recording from an excised outside-out membrane patch of TREx HEK293T cells stably expressing rTRPV1 (Vm = +60 mV). Upward (outward) current indicates channel opening in response to capsaicin (1 µM,; red bar) or DkTx (1 µM, orange bar) application (n = 6). (C, Right) All-point amplitude histogram of capsaicin (icap)- and DkTx (iDkTx)-evoked single-channel currents. The histogram was generated from the recording shown at the left. (D) Mean/scatter-dot plot is representing the amplitude of single-channel currents evoked by DkTx, applied at the indicated concentrations and capsaicin (1 µM) (n = 5–16). Statistical significance between the indicated DkTx concentrations and capsaicin are indicated as ***P ≤ 0.001 (ANOVA followed by a multiple comparison test). (E) Mean/scatter-dot plot representing the Po of single-channel currents evoked by DkTx (1 µM, orange circles) and capsaicin (1 µM, red circles) (n = 6). Statistical significance is indicated as ns, not statistically significant (paired Student’s t test). (F) Representative current recording from an excised outside-out membrane patch of TREx HEK293T cells stably expressing rTRPV1 upon application of capsaicin (1 µM, red bars), DkTx (1 µM, orange bar), and subsequent capsaicin application (Vm = +60 mV) (n = 4).
Fig. 2.
Fig. 2.
DkTx sensitizes the aversive behavior evoked by capsaicin in rat TRPV1-transgenic worms. (A) Schematic representation of the withdrawal responses after addition of either capsaicin or DkTx drop in front of freely moving worms. (B) Withdrawal responses of WT (N2) and rTRPV1-expressing worms elicited by DkTx. Bars represent mean ± SEM, ***P < 0.001 (Mann–Whitney U rank tests were used for statistical analysis). (C) Capsaicin dose–response profiles for rTRPV1-expressing worms. Young adult worms were incubated for 15 min in bacteria-containing M13 buffer with or without DkTx (as described in A) prior to capsaicin challenge. Each point represents an average of ≥30 worms ± SEM. Lines are Boltzmann functions fit to the data.
Fig. 3.
Fig. 3.
The single knots constituting DkTx evoke higher unitary conductance currents in comparison with the bivalent toxins. (A, Top) Representative current recordings from an excised outside-out membrane patch of TREx HEK293T cells stably expressing rTRPV1 (treated as described in Fig. 1). Representative recordings are shown after exposing the patch to capsaicin (1 µM, red bar) and K1 (100 µM, cyan bar) (Vm = +60 mV) (n = 6). Trace is accompanied by an all-point amplitude histogram generated from the recording shown above. (A, Bottom) Representative current recordings from an excised outside-out membrane patch of TREx HEK293T cells stably expressing rTRPV1 (treated as described in Fig. 1). Representative recordings are shown after exposing the patch to capsaicin (1 µM; red bar) and K2 (50 µM; dark blue bar) (Vm = +60 mV) (n = 7). Trace is accompanied by an all-point amplitude histogram generated from the recording shown above. (B, Top) Representative current recordings from an excised outside-out membrane patch of TREx HEK293T cells stably expressing rTRPV1 (treated as described in Fig. 1). Representative recordings are shown after exposing the patch to capsaicin (1 µM, red bar) and K1K1 (15 µM, purple bar) (Vm = +60 mV) (n = 6). Trace is accompanied by an all-point amplitude histogram generated from the recording shown above. (B, Bottom) Representative current recordings from an excised outside-out membrane patch of TREx HEK293T cells stably expressing rTRPV1 (treated as described in Fig. 1). Representative recordings are shown after exposing the patch to capsaicin (1 µM, red bar) and K2K2 (15 µM, magenta bar) (Vm = +60 mV) (n = 5). Trace is accompanied by an all-point amplitude histogram generated from the recording shown above. (C) Mean/scatter-dot plot representing the ratio between amplitudes of the single-channel current evoked by the indicated toxin and capsaicin at +60 mV (n = 5–8). Mutated toxins were compared with DkTx as well as with each other for statistical analysis. ns, not statistically significant; **P ≤ 0.01; ***P ≤ 0.001 (ANOVA followed by multiple comparison test). (D) Representative current recordings from an excised outside-out membrane patch of cells expressing rTRPV1. Upward (outward) current indicates channel opening (gray dashed lines) in response to DkTx (1 µM, orange bar) application. Holding potential was at +60 mV. Blue background insets show higher magnification of indicated 1 s of DkTx-evoked response. (E) Mean/scatter-dot plot representing the ratio between the single-channel current amplitude of DkTx-induced initial bursts (“burst”, red circles) or continuous (“lock”, orange squares) activations and capsaicin (n = 9). Statistical significance between normalized DkTx-evoked responses and capsaicin are indicated as ***P ≤ 0.001 (ANOVA followed by multiple comparison test).
Fig. 4.
Fig. 4.
Elongating the toxin’s linker increases the evoked current amplitude. (A) Representative whole-cell current trace from TREx HEK293T cells stably expressing rTRPV1 at −80 mV and +80 mV upon application of capsaicin (1 µM, red bar) and DkTx(DL) (5 µM, orange bar) (n = 7). (B) Current–voltage relationship traces in TREx HEK293T cells stably expressing rTRPV1 in response to capsaicin (Cap, 1 µM, red line), DkTx(DL) (5 µM, dark orange line), and DkTx(DL) washout (Wash, 2 min) (n = 7). (C) Mean/scatter-dot plot representing the amplitude of whole-cell currents in TREx HEK293T cells stably expressing rTRPV1 (Vm = +80 mV) at a saturating DkTx(DL) concentration (5 µM, peak, orange circles) and after subsequent 2 min of wash (wash, green circles), normalized to the current amplitude of the saturating capsaicin response (1 µM) (n = 7). The dashed line indicates the average ratio of DkTx- and capsaicin-evoked peak amplitudes at +80 mV. Statistical significance between normalized responses of DkTx(DL) at peak and wash and DkTx are indicated as ns, not statistically significant, **P ≤ 0.01 and ***P ≤ 0.001 (ANOVA followed by a multiple comparison test). (D, Left) Representative current recordings from an excised outside-out membrane patch of TREx HEK293T cells stably expressing rTRPV1 (treated as described in Fig. 1). Representative recordings are shown after exposing the patches to capsaicin (1 µM, red bar) and DkTx(DL) (5 µM, dark orange bar) (Vm = +60 mV) (n = 8). (D, Right) All-point amplitude histogram generated from the recording shown on the left. (E) Mean/scatter-dot plot representing the ratio between amplitudes of the single-channel current activated by DkTx(DL) and capsaicin at +60 mV (n = 8). The dashed line indicates the average ratio of DkTx- and capsaicin-evoked current amplitudes at +60 mV. Statistical significance between normalized responses of DkTx(DL) and DkTx are indicated as *P ≤ 0.05 (unpaired Student’s t test). (F) Withdrawal responses of rTRPV1-expressing worms elicited by DkTx and DkTx(DL). Bars represent mean ± SEM, ***P ≤ 0.001 (Mann–Whitney U rank tests were used for statistical analysis).
Fig. 5.
Fig. 5.
DkTx evokes full conductance in TRPV1 channels lacking the pore turret. (A) Schematic illustrations depicting the location of deleted regions in the different TRPV1 constructs. (B) Current–voltage relationship traces in TREx HEK293T cells expressing cryo rTRPV1 in response to 1 µM capsaicin (Cap 1 µM, red line) and DkTx (2 µM, orange line) (n = 5). (C) Current–voltage relationship traces in TREx HEK293T cells expressing rTRPV1Δ23 in response to 1 µM capsaicin (Cap 1 µM, red line), 10 µM capsaicin (Cap 10 µM, dark red line), and DkTx (2 µM, orange line) (n = 8). (D) Mean/scatter-dot plot representing the ratio between amplitudes of the whole-cell current activated by DkTx (2 µM) and the indicated capsaicin concentration at +80 mV (n = 8–16). Capsaicin responses in TRPV1Δ23 were compared with the capsaicin response in WT TRPV1 as well as with each other for statistical analysis. ***P ≤ 0.001 (ANOVA followed by multiple comparison test). (E, Top) Representative current recordings from an excised outside-out membrane patch of TREx HEK293T cells expressing cryo rTRPV1 (treated as described in Fig. 1). Representative recordings are shown after exposing the patches to capsaicin (1 µM, red bar) and DkTx (2 µM, orange bar) (Vm = +60 mV) (n = 4). (E, Bottom) Representative current recordings from an excised outside-out membrane patch of TREx HEK293T cells expressing TRPV1Δ23 (treated as described in Fig. 1). Representative recordings are shown after exposing the patches to capsaicin (1 µM, red bar) and DkTx (2 µM, orange bar) (Vm = +60 mV) (n = 5). (F) Mean/scatter-dot plot representing the amplitude of single-channel currents evoked by 2 µM DkTx in TRPV1 (cyan circles), cryo TRPV1 (pink squares), and TRPV1Δ23 (purple triangles) at +60 mV (n = 4–11). Statistical significance between the indicated mutant TRPV1 channels and WT TRPV1 is indicated as ***P ≤ 0.001 (ANOVA followed by a multiple comparison test). (G) Dwell time of TRPV1 single-channel current elicited by capsaicin (1 µM, red bars) and DkTx (2 µM, orange bars) (n = 6–8). Bars represent mean ± SEM, ***P ≤ 0.001 (ANOVA followed by multiple comparison test).
Fig. 6.
Fig. 6.
DkTx produces a robust activation of TRPV1 lacking the pore turret. (A) DkTx-induced withdrawal responses of worms expressing rTRPV1 or TRPV1Δ23. Bars represent mean ± SEM, ***P ≤ 0.001 (Mann–Whitney U rank tests were used for statistical analysis). (B) Capsaicin-induced withdrawal response of worms expressing rTRPV1 or TRPV1Δ23. Bars represent mean ± SEM, ***P ≤ 0.001 (Mann–Whitney U rank tests were used for statistical analysis).
Fig. 7.
Fig. 7.
Molecular modeling suggests TRPV1 pore turret hinders ion conduction. (A) Cryo-EM structure of cryo rTRPV1 (gray surface) with DkTx bound (yellow surface), viewed along the pore from the extracellular side (24). The locations of the pore-turret truncation are indicated in colors (blue, cyan, red, and orange). (B) Models of rTRPV1 including the pore turret, produced with ROSETTA. Shown are 200 pore-turret conformations for each channel subunit, colored as in A. (C) Same as in A, using an alternative scoring protocol that favors models whereby the pore turrets added to the two-channel subunits underneath DkTx (blue and red) are enclosed by the toxin linkers, on account of the likely fact that DkTx docks onto TRPV1 laterally, from the membrane. (D) Calculated pore-diameter profile for the cryo-EM structure of rTRPV1 cryo/wt DkTx (black), compared with averages calculated for the ensemble of models shown in B and C (magenta and green, respectively). Solid lines represent the average profiles; dashed lines indicate the dispersion (SD) of each sample. (E) Same as A, after deletion of the toxin linkers [DkTx(DL)-like]. (F) Same as B, based on the assumed structure of the complex shown in E. (G) Same as D, now comparing rTRPV1 models (with the pore turrets) in complex with WT DkTx (green) or with DkTx lacking the linker (gray), and the cryo-EM structure of rTRPV1 cryo/wt DkTx (black).

Similar articles

Cited by

References

    1. Bohlen CJ, Julius D. Receptor-targeting mechanisms of pain-causing toxins: How ow? Toxicon. 2012;60:254–264. - PMC - PubMed
    1. Kalia J, et al. From foe to friend: Using animal toxins to investigate ion channel function. J Mol Biol. 2015;427:158–175. - PMC - PubMed
    1. Trim SA, Trim CM. Venom: The sharp end of pain therapeutics. Br J Pain. 2013;7:179–188. - PMC - PubMed
    1. Chacur M, et al. Snake venom components enhance pain upon subcutaneous injection: An initial examination of spinal cord mediators. Pain. 2004;111:65–76. - PubMed
    1. Harris JB, Scott-Davey T. Secreted phospholipases A2 of snake venoms: Effects on the peripheral neuromuscular system with comments on the role of phospholipases A2 in disorders of the CNS and their uses in industry. Toxins (Basel) 2013;5:2533–2571. - PMC - PubMed

Publication types

MeSH terms

LinkOut - more resources