. 2018 Dec 18;115(51):E12091-E12100.
doi: 10.1073/pnas.1814132115. Epub 2018 Nov 21.

Tissue-specific contributions of Tmem79 to atopic dermatitis and mast cell-mediated histaminergic itch

Affiliations

Tissue-specific contributions of Tmem79 to atopic dermatitis and mast cell-mediated histaminergic itch

Joshua J Emrick et al. Proc Natl Acad Sci U S A. .

Abstract

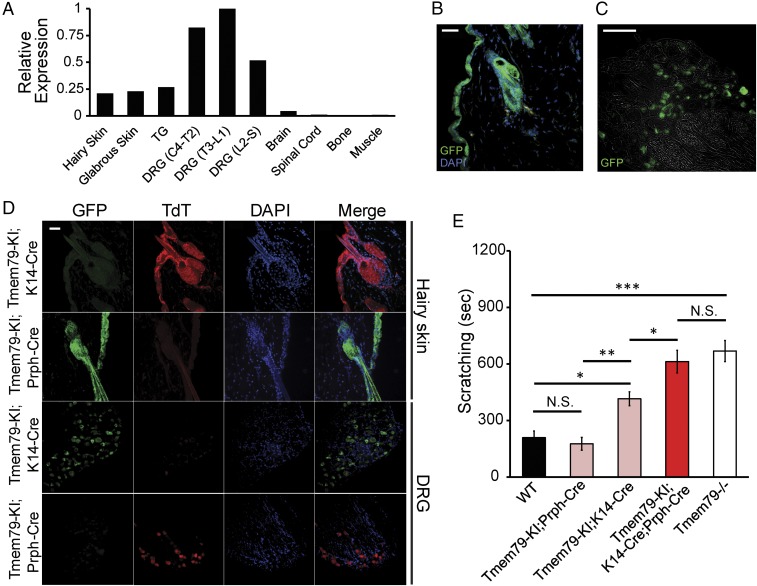
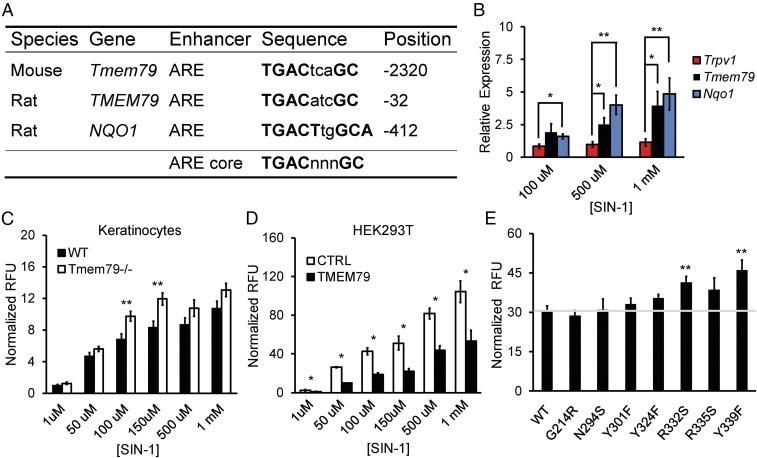
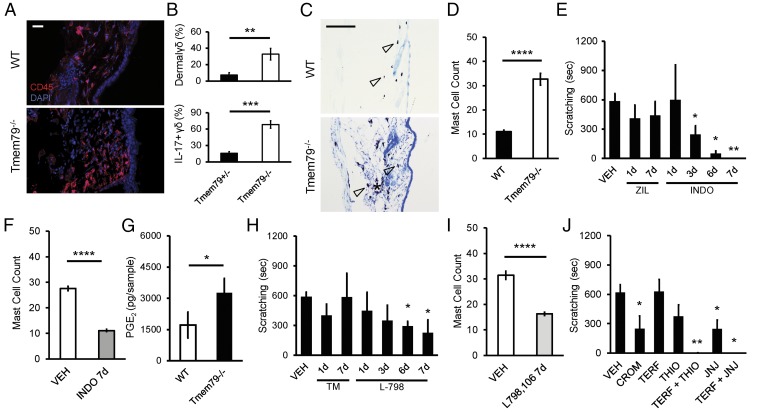
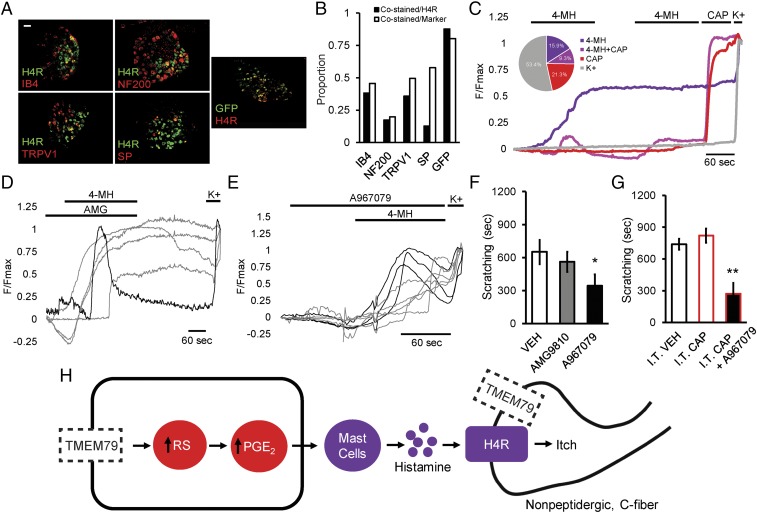
Atopic dermatitis (AD) is the most common skin disease in children. It is characterized by relapsing inflammation, skin-barrier defects, and intractable itch. However, the pathophysiology of itch in AD remains enigmatic. Here, we examine the contribution of Tmem79, an orphan transmembrane protein linked to AD in both mice and humans. We show that Tmem79 is expressed by both keratinocytes and sensory neurons, but that loss of keratinocytic Tmem79 is sufficient to elicit robust scratching. Tmem79-/- mice demonstrate an accumulation of dermal mast cells, which are diminished following chronic treatment with cyclooxygenase inhibitors and an EP3 receptor antagonist. In Tmem79-/- mice, mast cell degranulation produces histaminergic itch in a histamine receptor 1/histamine receptor 4 (H4R/H1R)-dependent manner that may involve activation of TRPV1- afferents. TMEM79 has limited sequence homology to a family of microsomal glutathione transferases and confers protection from cellular accumulation of damaging reactive species, and may thus play a role in regulating oxidative stress. In any case, mechanistic insights from this model suggest that therapeutics targeting PGE2 and/or H1R/H4R histaminergic signaling pathways may represent useful avenues to treat Tmem79-associated AD itch. Our findings suggest that individuals with mutations in Tmem79 develop AD due to the loss of protection from oxidative stress.

Keywords: Tmem79; atopic dermatitis; itch; oxidative stress; prostaglandin E2.


Conflict of interest statement

The authors declare no conflict of interest.

Figures

Fig. 1.
Fig. 1.
Loss of Tmem79 in sensory neurons and keratinocytes produces itch. (A) Real-time qPCR analysis of Tmem79 expression relative to Rpl19 in tissues dissected from wild-type mice. The graph presents ΔΔCt values normalized to the tissue with greatest relative expression of Tmem79. ΔΔCt values were calculated from real-time PCR reactions run in triplicate from combined tissues from three wild-type mice. Tissues examined were hairy skin, glabrous (hairless) skin, TGs, DRG fourth cervical to second thoracic (DRG C4–T2), DRG third thoracic to first lumbar (DRG T3–L1), DRG second lumbar to sacral (DRG L2–S), brain, spinal cord, bone, and muscle. (B and C) Representative micrographs of tissue sections from Tmem79-KI reporter mice stained for immunoreactivity to GFP (green). (B) Hairy skin section (20 µm) with the superficial epidermis oriented to the left. Nuclei were counterstained using DAPI (blue). (Scale bar: 15 µm.) (C) DRG section (12 µm). The image is superimposed with brightfield micrograph. (Scale bar: 100 µm.) (D) Representative micrographs of hairy skin or DRG sections from Tmem79-KI;K14-Cre or Tmem79-KI;Prph-Cre mice stained for immunoreactivity to GFP (green) or TdT (red). Superficial epidermis is oriented to the left (1st Row, Tmem79-KI;K14-Cre) or the right (2nd Row, Tmem79-KI;Prph-Cre). Nuclei were counterstained with DAPI (blue). Merged images are shown in the far right column. (Scale bar: 15 µm.) (E) Quantified scratching behavior of adult wild-type, Tmem79-KI;Prph-Cre, Tmem79-KI;K14-Cre, Tmem79-KI;K14-Cre;Prph-Cre, and Tmem79−/− mice. Data shown are the mean number of seconds of scratching in multiple mice of each genotype ± SEM. n = 6 wild-type mice, 9 Tmem79-KI;Prph-Cre mice, 11 Tmem79-KI;K14-Cre mice, 5 Tmem79-KI;K14-Cre;Prph-Cre mice, and 12 Tmem79−/− mice; *P < 0.05, **P < 0.01, ***P < 0.001, one-way ANOVA with Holm–Sidak’s multiple comparisons correction; N.S., not significant.
Fig. 2.
Fig. 2.
TMEM79 diminishes oxidative stress. (A) Table of antioxidant response elements (AREs) in rodent genes (Tmem79, TMEM79, and NQO1). Sequence identity and the position relative to the start codon for each gene are provided. The ARE core is shown for reference. (B) Real-time qPCR data for gene expression relative to Rpl19 in cultured P0 rat sensory neurons following 16-h incubation with concentrations of SIN-1. Data are shown as the mean relative expression ± SEM; n = 3 independent experiments with samples run in triplicate. **P < 0.01, *P < 0.05, two-tailed Holm t test. (C) Quantification of DCF fluorescence in acute cultures of keratinocytes from age-matched wild-type or Tmem79−/− mice following 30-min incubation with SIN-1 concentrations as noted. Data represent mean relative fluorescent units (RFU) normalized to baseline ± SEM; n = 7 mice with samples run in triplicate. **P < 0.01, two-tailed Student’s t test. (D) Quantification of DCF fluorescence in cultures of HEK293T cells expressing either control (CTRL) or mouse Tmem79 (TMEM79) vector following 30-min incubation with various SIN-1 concentrations. Data represent mean RFU normalized to baseline ± SEM; n = 3 or 4 experiments with samples run in triplicate. *P < 0.05, one-tailed Student’s t test. (E) Quantification of DCF fluorescence in cultures of HEK293T cells expressing vectors containing mouse Tmem79 (WT) or amino acid substitution mutants (G214R, N294S, Y301F, Y324F, R332S, R335S, and Y339F) following 30-min incubation in 150 µm of SIN-1. Data represent mean RFU normalized to baseline ± SEM. The horizontal gray line represents normalized RFU from mouse Tmem79 (WT) for reference. n = 5 experiments with samples run in triplicate. **P < 0.01, two-tailed Holm t test.
Fig. 3.
Fig. 3.
PGE2–EP3 interaction recruits dermal mast cells that drive histaminergic itch via H4R in Tmem79−/− mice. (A) Representative micrographs of stained hairy skin sections (20 µm) from age-matched wild-type (Upper) or Tmem79−/− (Lower) mice. Superficial epidermis is oriented to the right. Staining for immunoreactivity to CD45 (red) with nuclei counterstained using DAPI (blue). (Scale bar: 10 µm.) (B) Flow cytometry quantification of immune cells and cytokine expression in the hairy skin of littermate Tmem79+/− and Tmem79−/− mice. Data shown are the percentage of dermal immune cells that are γδ+ (Upper) and the percentage of dermal γδ+ cells that are also IL-17+ (Lower). Data shown are the mean percentages ± SEM from four Tmem79+/− and four Tmem79−/− mice. **P < 0.01, ***P < 0.001, one-tailed Student’s t test. (C) Representative micrographs of Toluidine blue O-stained hairy skin sections (20 µm) from age-matched wild-type (Upper) or Tmem79−/− (Lower) mice. Superficial epidermis is oriented to the right. Hollow arrowheads indicate examples of stained mast cells. (Scale bar: 100 µm.) (D) Quantification of mast cells from micrographs represented in C. Data shown are the mean mast cell count ± SEM from fields captured from wild-type or Tmem79−/− mice; n = 40 micrographs in wild-type mice and 47 micrographs in Tmem79−/− mice. ****P < 0.0001, two-tailed Student’s t test. (E) Quantified scratching behavior of adult Tmem79−/− mice following i.p. administration of vehicle (VEH), 20 mg/kg zileuton (ZIL), or 10 mg/kg indomethacin (INDO) for 1, 3, 6, or 7 consecutive days. Data shown are the mean number of seconds of scratching ± SEM from multiple mice (n = 4) in each treatment group. *P < 0.05, **P < 0.01, one-tailed Holm t test. (F) Quantification of mast cells from micrographs of stained hairy skin sections from mice receiving vehicle (VEH) or 10 mg/kg indomethacin (INDO) for seven consecutive days. Data shown are the mean mast cell count ± SEM; n = 43 micrographs from vehicle-treated mice and 85 micrographs from indomethacin-treated mice. ****P < 0.0001, two-tailed Student’s t test. (G) LC/MS/MS-based lipidomics was used to identify and quantify prostanoids, PGE2, and PGE2 metabolite content from lysed acutely dissociated keratinocytes from age-matched wild-type and Tmem79−/− mice. Deuterated internal standards were used to correct for extraction and processing recoveries. An AB Sciex QTRAP 4500 mass spectrometer was used for analyses; prostanoids were identified and quantitated using scheduled MRM with four to six specific transition ions for each analyte. Data represent the average ± SEM PGE2 content (quantified in picograms) from keratinocytes from weight-matched skin dissected from separate animals; n = 4 animals per group. *P < 0.05, two-tailed Student’s t test. (H) Quantified scratching behavior of adult Tmem79−/− mice following i.p. administration of vehicle (VEH), 5 mg/kg TM30089 (TM), or 100 mg/kg L-798,106 (L-798) for seven consecutive days. Data shown are the mean number of seconds of scratching ± SEM by multiple mice (n = 4) in each treatment group. *P < 0.05, one-tailed Holm t test. (I) Quantification of mast cells from micrographs of stained hairy skin sections from mice treated with vehicle (VEH) or 100 mg/kg L-796,106 (L-798) for seven consecutive days. Data shown are the mean mast cell count ± SEM. n = 54 micrographs from vehicle-treated mice and 62 micrographs from L-796,106–treated mice. ****P < 0.0001, two-tailed Student’s t test. (J) Quantified scratching behavior of adult Tmem79−/− mice following i.p. administration of vehicle (VEH), 20 mg/kg cromolyn sulfate (CROM), 20 mg/kg terfenidine (TERF), 20 mg/kg thioperamide (THIO), 20 mg/kg terfenidine + 20 mg/kg thioperamide (TERF + THIO), 20 mg/kg JNJ-7777120 (JNJ), or 20 mg/kg terfenidine + 20 mg/kg JNJ-7777120 (TERF + JNJ). Data shown are the mean number of seconds of scratching ± SEM from multiple mice (n = 4) in each treatment group. *P < 0.05, **P < 0.01, one-tailed Holm t test.
Fig. 4.
Fig. 4.
H4R receptor-mediated calcium influx in DRG sensory neurons and Tmem79−/− histaminergic itch is TRPV1 independent. (A) Representative micrographs of fluorescent colabeling of 12-µm DRG sections from adult wild-type (Left and Middle) or Tmem79-KI (Right) mice. Sections were stained for immunoreactivity to H4R or GFP (green) and binding to IB4 or for immunoreactivity to NF200, TRPV1, SP, or H4R as indicated (red). (Scale bar: 50 µm.) (B) Quantification of colabeling from micrographs depicted in A. Colabeling is shown as a proportion of total H4R+ and marker+ neurons. Proportions were calculated from counts taken from at least eight micrographs. (CE) Normalized F340/F380 calcium imaging traces from adult DRG neurons. (C) Averaged responses to the application of 500 µm 4-MH or 1 µm capsaicin (CAP). Neurons were identified at the conclusion of each experiment by a positive response to elevated extracellular potassium (150 mM KCl, K+). Each trace represents a distinct subpopulation of responders: 4-MH (purple), 4-MH + CAP (magenta), CAP (red), or K+ only (gray). (Inset) The pie chart shows the percentage of each subpopulation from seven independent experiments (4-MH, 77/483, 15.9%; 4-MH+CAP, 45/483, 9.3%; CAP, 103/483, 21.3%; K+, 258/483, 53.4%). (Scale bar: 60 s.) (D and E) Responses to the application of 500 µm 4-MH and 10 µm AMG (D) or 1 mM A967079 (E). Neurons were identified at the conclusion of each experiment by a positive response to elevated extracellular potassium (150 mM KCl, K+). Each trace represents a distinct responder from a single experiment. (Scale bar: 60 s.) (F) Quantified scratching behavior of adult Tmem79−/− mice following i.p. administration of vehicle (VEH), 30 mg/kg AMG9810, or 50 mg/kg A967079. Data shown are the mean number of seconds ± SEM of scratching from multiple mice in each treatment group (n = 9 vehicle-treated mice, 4 AMG9810-treated mice, 21 A967079-treated mice). *P < 0.05, one-tailed Holm t test. (G) Quantified scratching behavior of adult Tmem79−/− mice 1–14 d after intrathecal administration of vehicle (I.T. VEH) or 10 µg capsaicin (I.T. CAP) and i.p. administration of 50 mg/kg A967079 (I.T. CAP + A967079). Data shown are the mean seconds of scratching ± SEM from multiple mice in each treatment group (n = 7 intrathecal vehicle-treated mice, 7 intrathecal capsaicin-treated mice, 4 intrathecal capsaicin + A967079-treated mice). **P < 0.01, one-tailed Holm t test. (H) Proposed model: Loss of keratinocytic Tmem79 results in the accumulation of reactive species (RS) stimulating the production of PGE2. PGE2 from keratinocytes serves to attract mast cells to the dermis of Tmem79−/− mice through activation of EP3. Mast cells in the dermis degranulate, releasing histamine and activating H4R on nonpeptidergic C-fibers that are TRPV1 and presumably have lost Tmem79.

Comment in

  • Molecular link between itch and atopic dermatitis.
    Voisin T, Chiu IM. Voisin T, et al. Proc Natl Acad Sci U S A. 2018 Dec 18;115(51):12851-12853. doi: 10.1073/pnas.1818879115. Epub 2018 Dec 11. Proc Natl Acad Sci U S A. 2018. PMID: 30538205 Free PMC article. No abstract available.

Similar articles

Cited by

References

    1. Sidbury R, et al. American Academy of Dermatology Guidelines of care for the management of atopic dermatitis: Section 3. Management and treatment with phototherapy and systemic agents. J Am Acad Dermatol. 2014;71:327–349. - PMC - PubMed
    1. Weidinger S, Novak N. Atopic dermatitis. Lancet. 2016;387:1109–1122. - PubMed
    1. Ji H, Li XK. Oxidative stress in atopic dermatitis. Oxid Med Cell Longev. 2016;2016:2721469. - PMC - PubMed
    1. Jin H, He R, Oyoshi M, Geha RS. Animal models of atopic dermatitis. J Invest Dermatol. 2009;129:31–40. - PMC - PubMed
    1. Sasaki T, et al. A homozygous nonsense mutation in the gene for Tmem79, a component for the lamellar granule secretory system, produces spontaneous eczema in an experimental model of atopic dermatitis. J Allergy Clin Immuno. 2013;132:1111–1120.e4. - PubMed

Publication types