. 2018 Dec 11;115(50):E11701-E11710.
doi: 10.1073/pnas.1804506115. Epub 2018 Nov 21.

Germline genetic polymorphisms influence tumor gene expression and immune cell infiltration

Affiliations

Germline genetic polymorphisms influence tumor gene expression and immune cell infiltration

Yoong Wearn Lim et al. Proc Natl Acad Sci U S A. .

Abstract

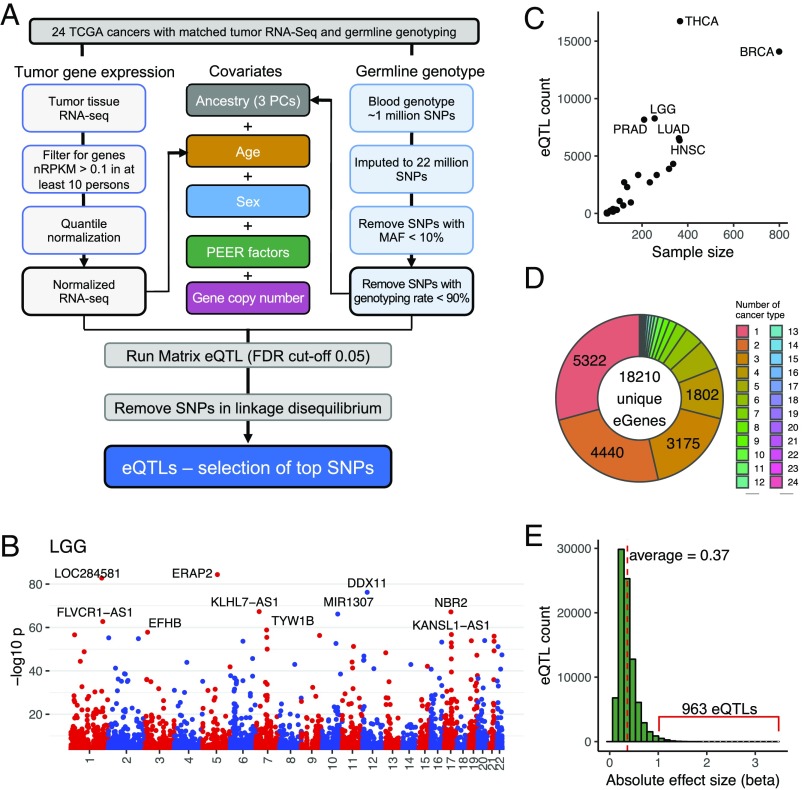
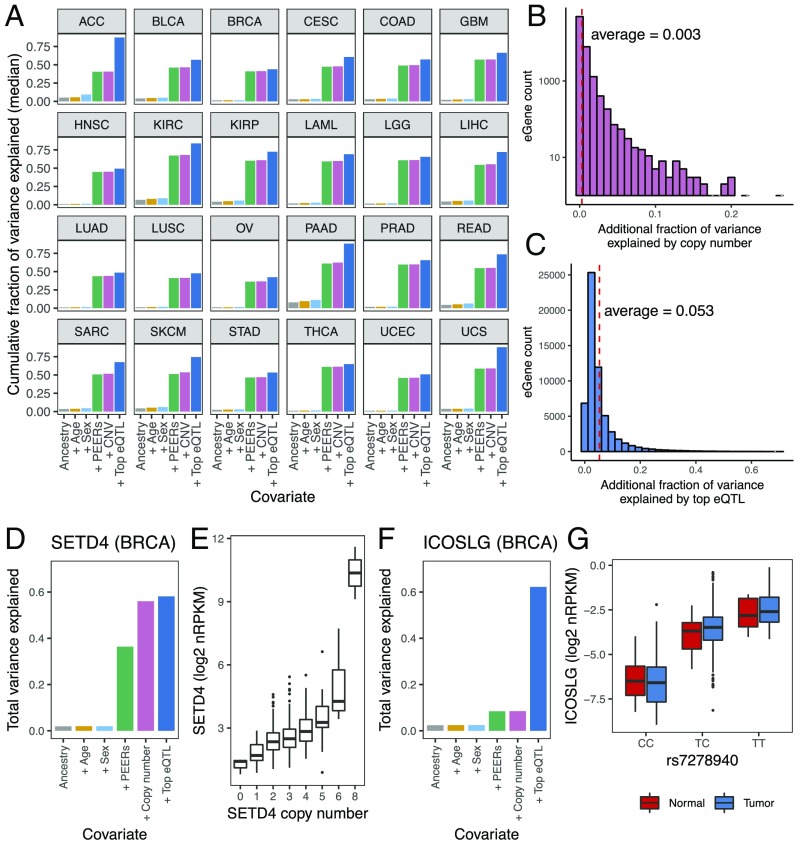
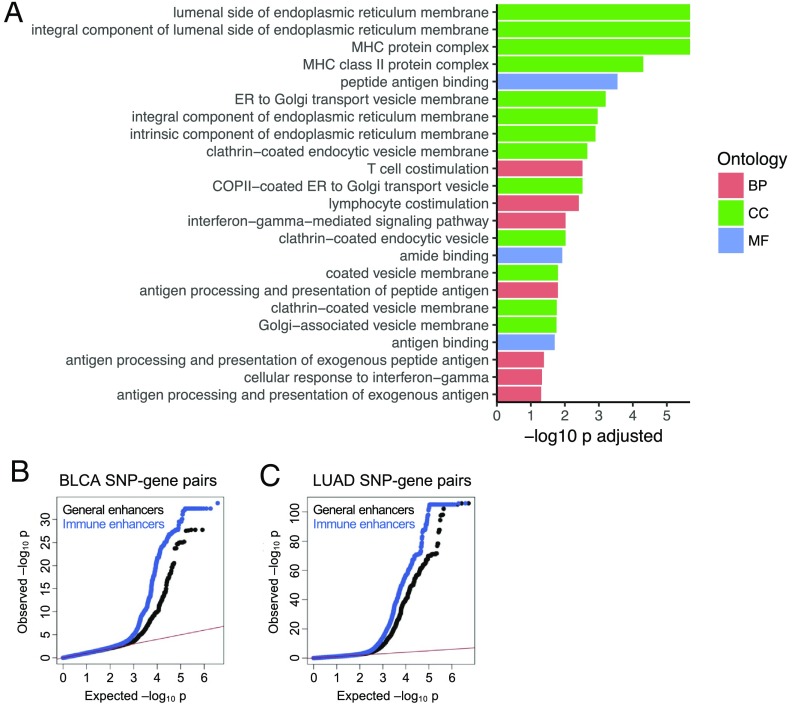
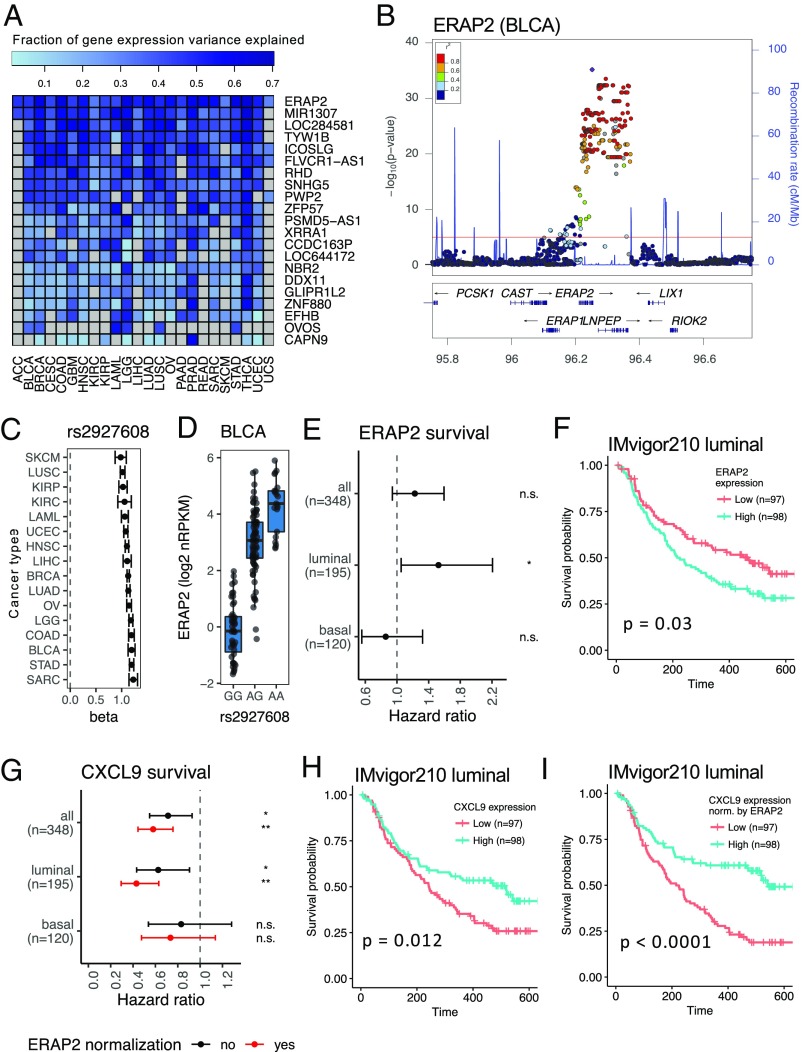
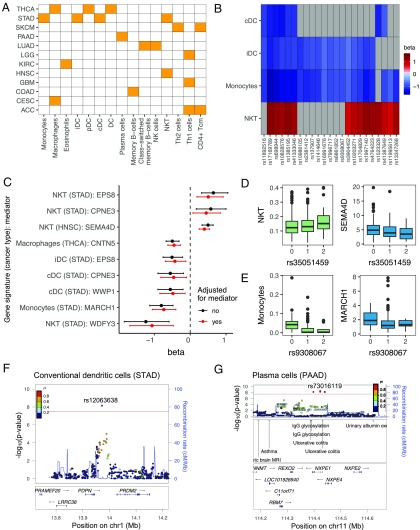
Cancer immunotherapy has emerged as an effective therapy in a variety of cancers. However, a key challenge in the field is that only a subset of patients who receive immunotherapy exhibit durable response. It has been hypothesized that host genetics influences the inherent immune profiles of patients and may underlie their differential response to immunotherapy. Herein, we systematically determined the association of common germline genetic variants with gene expression and immune cell infiltration of the tumor. We identified 64,094 expression quantitative trait loci (eQTLs) that associated with 18,210 genes (eGenes) across 24 human cancers. Overall, eGenes were enriched for their being involved in immune processes, suggesting that expression of immune genes can be shaped by hereditary genetic variants. We identified the endoplasmic reticulum aminopeptidase 2 (ERAP2) gene as a pan-cancer type eGene whose expression levels stratified overall survival in a subset of patients with bladder cancer receiving anti-PD-L1 (atezolizumab) therapy. Finally, we identified 103 gene signature QTLs (gsQTLs) that were associated with predicted immune cell abundance within the tumor microenvironment. Our findings highlight the impact of germline SNPs on cancer-immune phenotypes and response to therapy; and these analyses provide a resource for integration of germline genetics as a component of personalized cancer immunotherapy.

Keywords: TCGA; cancer immunology; eGenes; eQTL.


Conflict of interest statement

Conflict of interest statement: All authors are employees of Genentech, Inc.

Figures

Fig. 1.
Fig. 1.
Expression of QTLs in tumor tissues. (A) eQTL discovery workflow to identify the association between germline genotype and tumor gene expression in 24 TCGA cancer types. Covariates studied are color-coded. nRPKM, normalized read per kilobase of transcript per million mapped reads. (B) Representative Manhattan plot showing eQTLs in brain lower grade glioma (LGG) along the 22 human chromosomes. Each dot represents a significant eQTL, and the y axis represents −log10 P value. The top 10 most significant eGenes are labeled. Plots for each cancer type can be found in SI Appendix, Fig. S1A. (C) Number of eQTLs in each cancer type correlates with sample size. Definitions of cancer types are provided in Table 1. (D) Donut plot showing the sharing of eGenes across tissues. For example, 5,322 eGenes were discovered in only one cancer type and 4,440 eGenes were discovered in two cancer types. (E) Histogram showing the distribution of the absolute effect size (β) of eQTLs of all cancer types.
Fig. 2.
Fig. 2.
eQTLs explain 5.3% of total tumor gene expression variance. (A) Cumulative fraction of variance in eGene expression was calculated using sequential addition of the following covariates: three ancestry principal components, age, sex, 15 PEER factors, copy number, and the top associated eQTLs. The bars represent the median value for all eGenes across 24 TCGA cancer types. Definitions of cancer types are provided in Table 1. (B) Histogram showing the distribution of additional fraction of variance in gene expression that is explained by copy number, after accounting for ancestry, age, sex and PEER factors, for eGenes aggregated across all cancer types. (C) Histogram showing the distribution of the fraction of variance in gene expression explained by the top associated eQTLs, for eGenes aggregated across all cancer types. (D) Total fraction of variance in SETD4 expression explained by sequential addition of different covariates, in BRCA. (E) Boxplot showing the expression of SETD4 in BRCA, as stratified by SETD4 copy number. (F) Total fraction of variance in ICOSLG expression explained by sequential addition of different covariates, in the BRCA cancer type. (G) Boxplot showing the expression levels of ICOSLG stratified by the genotype of its top associated eQTL, rs7278940, in BRCA. Both normal and tumor samples are shown. nRPKM, normalized read per kilobase of transcript per million mapped reads.
Fig. 3.
Fig. 3.
Immunity-related genes and enhancers are enriched for eQTLs. (A) GO enrichment using eGenes for the sarcoma cancer type. BP, biological process; CC, cellular component; MF, molecular function. (B and C) Quantile-quantile plots showing the deviation of SNP-gene pair association P values from the distribution expected under the null hypothesis (red line). (B) BLCA SNP-gene pair P values for SNPs located within either general (i.e., bladder tissue) (black) or immune (i.e., T cell) enhancer regions (blue). Relative to SNPs located within general enhancers, SNPs located within immune enhancers have more significant gene-SNP pair P values. (C) LUAD SNP-gene pair P values for SNPs located within either general (i.e., lung tissue) (black) or immune (i.e., T cell) enhancer regions (blue).
Fig. 4.
Fig. 4.
ERAP2 expression stratifies overall survival in patients with bladder cancer. (A) Heat map showing the fraction of variance in gene expression explained by eQTLs for 21 genes associated with high-impact variants (accounting for >50% of variance in gene expression in at least one cancer type). (B) LocusZoom plot displaying a 1-Mb region around the ERAP2 gene. The dots represent SNPs; the height of the dots represents the −log10 P value of the association between the SNPs and ERAP2 expression in BLCA. rs2927608 is the most significantly associated SNP with ERAP2 expression. The color of the dots represents LD (r2) of a particular SNP with rs2927608. cMMb, centimorgan per megabase. (C) Effect size (β) of ERAP2 eQTL rs2927608 across TCGA cancer types. The error bars represent SEs. Definitions of cancer types are provided in Table 1. (D) Boxplot showing BLCA ERAP2 expression in log2 normalized read per kilobase of transcript per million mapped reads (nRPKM) for the three genotype groups of the eQTL rs2927608. Each dot represents ERAP2 expression in a patient tumor sample. (E) Hazard ratio of overall survival, as stratified by median ERAP2 expression level, of patients with bladder cancer in the IMvigor210 phase 2 PD-L1 trial, for all molecular subtypes or only the luminal or basal subtype. The error bars represent the 95% confidence intervals (*P < 0.05). n.s., not significant. (F) Overall survival of patients with bladder cancer with tumors of the luminal subtype in the IMvigor210 trial, stratified by median ERAP2 expression level. (G) Hazard ratio of overall survival, as stratified by median CXCL9 expression level, of patients with bladder cancer in the IMvigor210 trial, for all molecular subtypes or only the luminal or basal subtype. Black bars represent the hazard ratio calculated using CXCL9 expression alone; red bars represent the hazard ratio calculated using ERAP2 normalized CXCL9 expression level. The error bars represent the 95% confidence intervals (*P < 0.05; **P < 0.005). Overall survival of patients with the luminal subtype as stratified by median CXCL9 level, without (H) or with (I) ERAP2 normalization, is shown.
Fig. 5.
Fig. 5.
TCGA tumor immune cellularity gsQTLs. (A) Heat map showing gene signatures (x axis) with one or more significant gsQTLs and the cancer type(s) (y axis) in which they were shown to be statistically significant (P < 2.1 × 10⁻⁸). Definitions of cancer types are provided in Table 1. Cancer types without any significant gsQTLs were not shown. (B) Heat map showing gsQTLs associated with two or more of the following gene signatures: cDCs, iDCs, monocytes, and NKT cells (in STAD). The color represents the effect size (β) of the association. Gray boxes are nonsignificant associations. (C) Forest plot showing significant mediator genes for the gsQTL-gene signature associations. The dots represent the effect sizes (β) of the gsQTL-gene signature associations before (black) and after (red) adjusting for the expression of the mediator genes. The error bars represent confidence intervals. (D, Left) Boxplot showing NKT cell gene signature scores stratified by genotypes of its associated gsQTL, rs35051459. (D, Right) Boxplot showing the expression of the mediator gene SEMA4D [log2 normalized read per kilobase of transcript per million mapped reads (nRPKM)] stratified by genotypes of the same gsQTL. (E, Left) Boxplot showing the monocyte gene signature scores stratified by genotypes of its associated gsQTL, rs9308067. (E, Right) Boxplot showing the expression of the mediator gene MARCH1 (log2 nRPKM) stratified by genotypes of the same gsQTL. (F) LocusZoom plot for the cDC gene signature in STAD. The gsQTL rs12063638 is located downstream of the PDPN gene. cMMb, centimorgan per megabase; chr, chromosome. (G) LocusZoom plot for the plasma cell gene signature in PAAD. The gsQTL rs73016119 is located in the same LD block as GWAS risk loci for ulcerative colitis.

Comment in

  • Your genomic inheritance matters.
    Baratta MG. Baratta MG. Nat Rev Cancer. 2019 Feb;19(2):63. doi: 10.1038/s41568-018-0099-z. Nat Rev Cancer. 2019. PMID: 30578413 No abstract available.

Similar articles

Cited by

References

    1. Hanahan D, Weinberg RA. Hallmarks of cancer: The next generation. Cell. 2011;144:646–674. - PubMed
    1. Vesely MD, Schreiber RD. Cancer immunoediting: Antigens, mechanisms, and implications to cancer immunotherapy. Ann N Y Acad Sci. 2013;1284:1–5. - PMC - PubMed
    1. Chen DS, Mellman I. Elements of cancer immunity and the cancer-immune set point. Nature. 2017;541:321–330. - PubMed
    1. Orrù V, et al. Genetic variants regulating immune cell levels in health and disease. Cell. 2013;155:242–256. - PMC - PubMed
    1. Roederer M, et al. The genetic architecture of the human immune system: A bioresource for autoimmunity and disease pathogenesis. Cell. 2015;161:387–403. - PMC - PubMed

MeSH terms