. 2018 Dec 11;115(50):E11623-E11632.
doi: 10.1073/pnas.1807954115. Epub 2018 Nov 21.

Structural snapshots of OxyR reveal the peroxidatic mechanism of H2O2 sensing

Affiliations

Structural snapshots of OxyR reveal the peroxidatic mechanism of H2O2 sensing

Brandán Pedre et al. Proc Natl Acad Sci U S A. .

Abstract

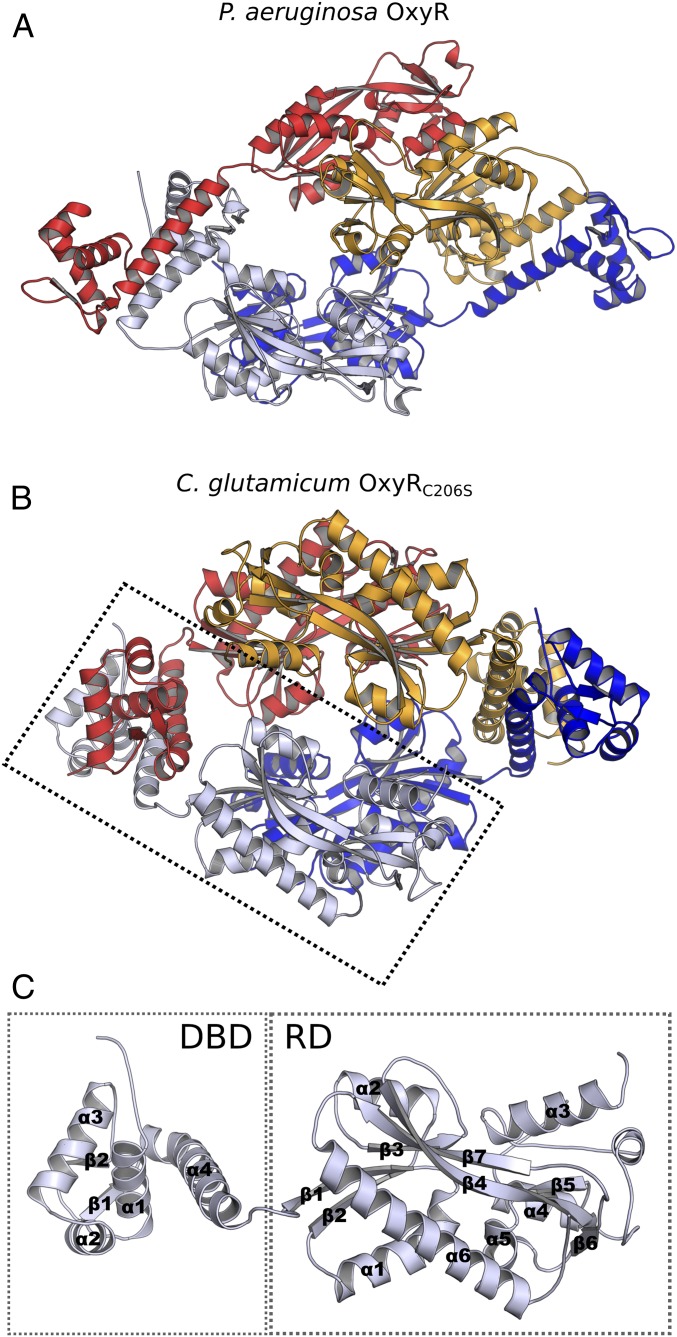
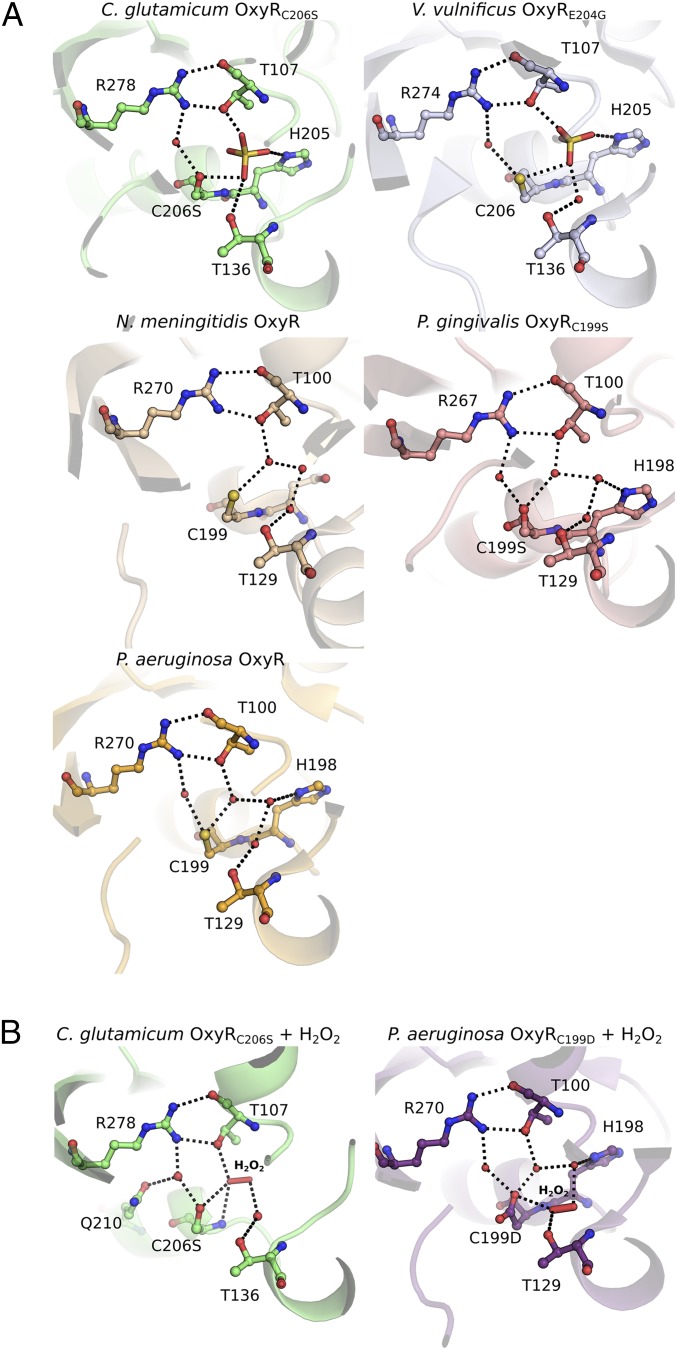
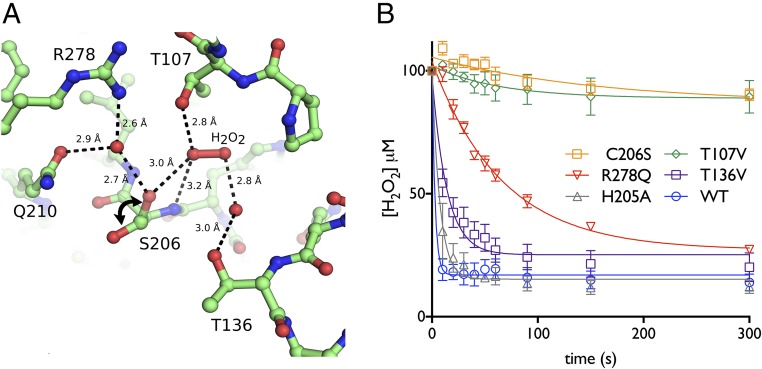
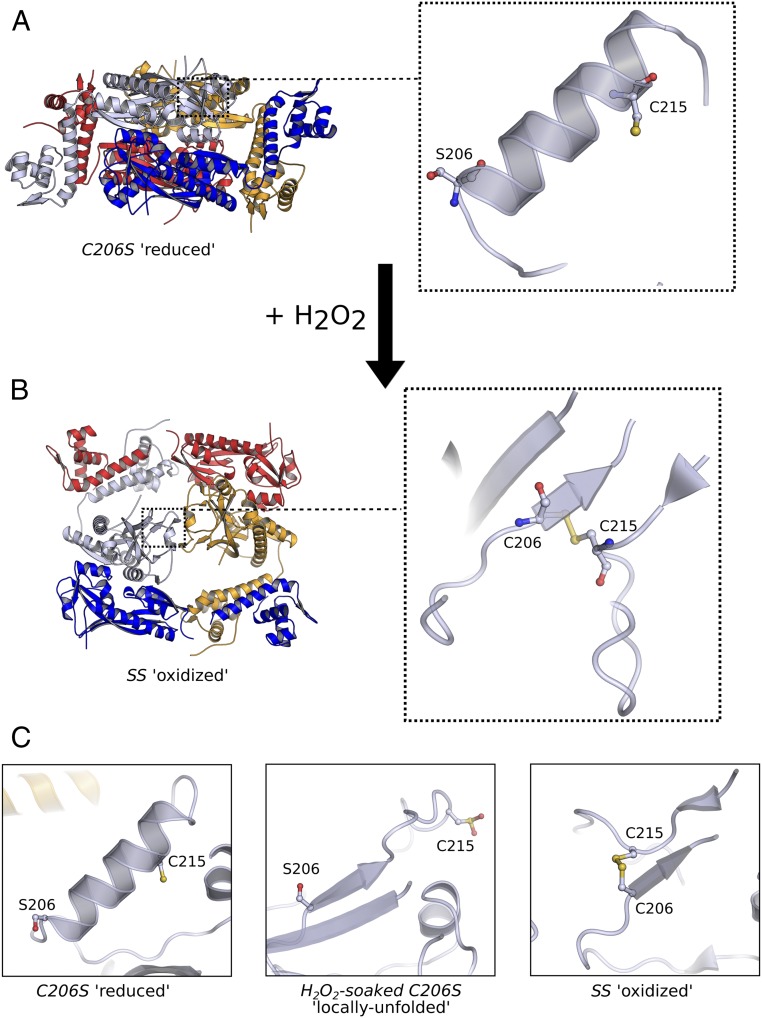
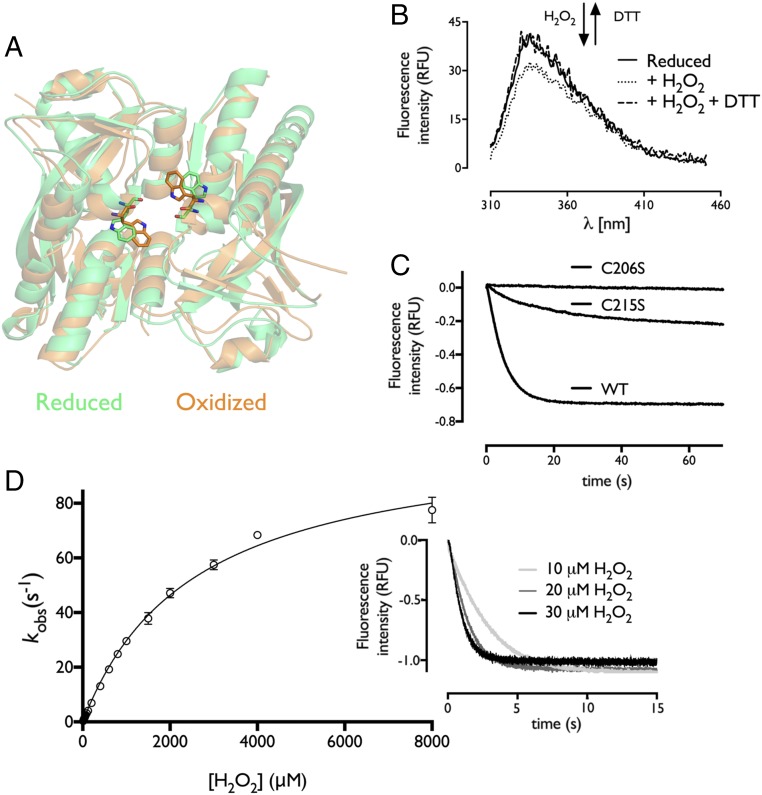
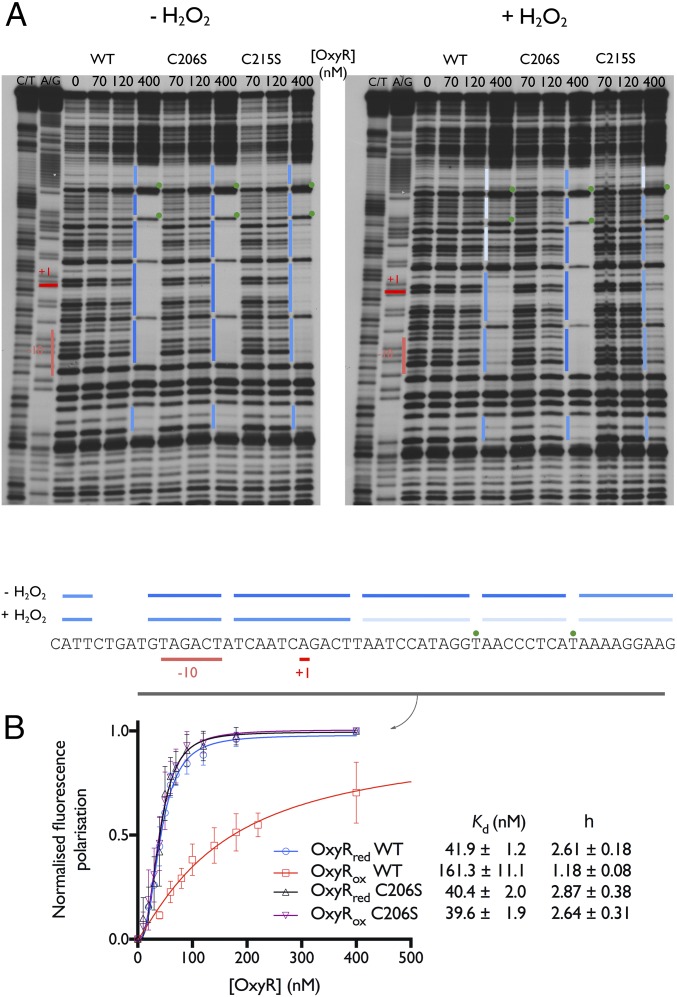
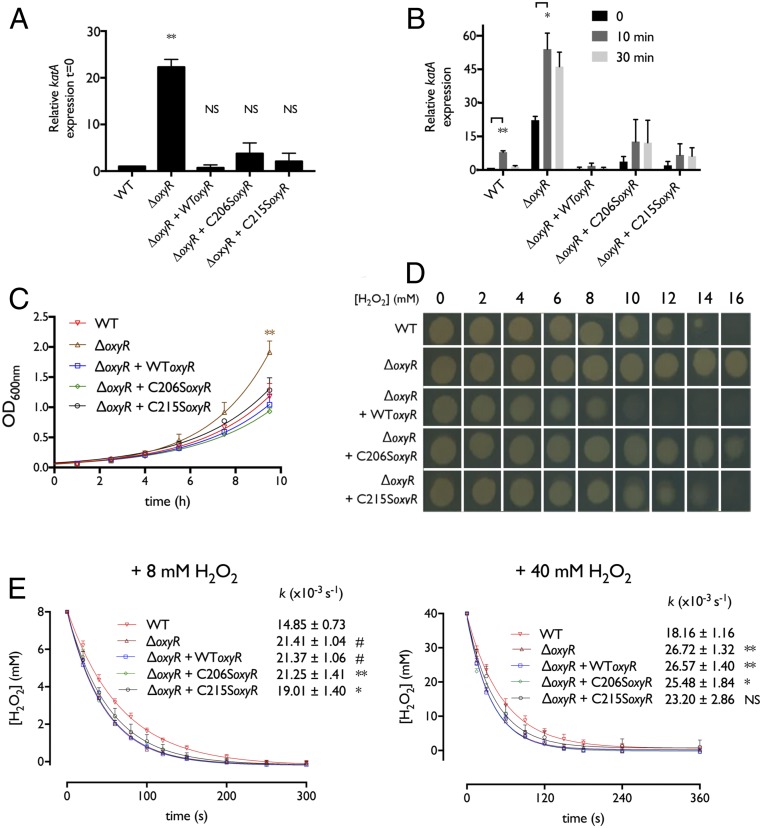
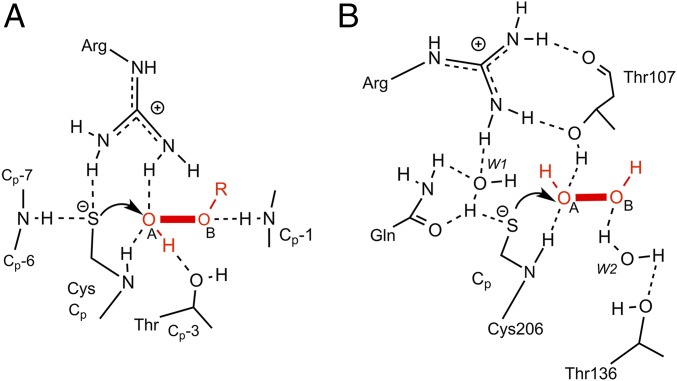
Hydrogen peroxide (H2O2) is a strong oxidant capable of oxidizing cysteinyl thiolates, yet only a few cysteine-containing proteins have exceptional reactivity toward H2O2 One such example is the prokaryotic transcription factor OxyR, which controls the antioxidant response in bacteria, and which specifically and rapidly reduces H2O2 In this study, we present crystallographic evidence for the H2O2-sensing mechanism and H2O2-dependent structural transition of Corynebacterium glutamicum OxyR by capturing the reduced and H2O2-bound structures of a serine mutant of the peroxidatic cysteine, and the full-length crystal structure of disulfide-bonded oxidized OxyR. In the H2O2-bound structure, we pinpoint the key residues for the peroxidatic reduction of H2O2, and relate this to mutational assays showing that the conserved active-site residues T107 and R278 are critical for effective H2O2 reduction. Furthermore, we propose an allosteric mode of structural change, whereby a localized conformational change arising from H2O2-induced intramolecular disulfide formation drives a structural shift at the dimerization interface of OxyR, leading to overall changes in quaternary structure and an altered DNA-binding topology and affinity at the catalase promoter region. This study provides molecular insights into the overall OxyR transcription mechanism regulated by H2O2.

Keywords: X-ray structure; hydrogen peroxide sensor; redox regulation; transcription factor.


Conflict of interest statement

The authors declare no conflict of interest.

Figures

Fig. 1.
Fig. 1.
Cg-OxyR crystal structure shows a more symmetric subunit arrangement compared with the asymmetric relation between the RD and DBD homodimers of Pa-OxyR. (A) Crystal structure of tetrameric Pa-OxyR C199D [PDB ID code 4X6G (23)]. (B) Crystal structure of tetrameric Cg-OxyRC206S. (C) Overview of the Cg-OxyRC206S monomeric subunit, with the DBD and the RD highlighted.
Fig. 2.
Fig. 2.
Comparison of Cg-OxyR active-site pocket with previously published structures. (A) OxyR structures show conservation of the active-site region. The active-site architecture from the OxyR crystal structures of C. glutamicum C206S (present study), V. vulnificus E204G OxyR2 [PDB ID code 5B7D (25)], N. meningitidis [PDB ID code 3JV9 (24)]*, P. gingivalis C199S [PDB ID code 3T22 (26)], and P. aeruginosa [PDB ID code 4Y0M (23)] are shown. (B) Comparison of the different H2O2 binding modes of the H2O2-soaked crystal structures of C. glutamicum OxyRC206S (present study) and P. aeruginosa C199D [PDB ID code 4X6G (23)]. Polar interactions between the residue side-chains and ligands (SO42−, H2O2) or water molecules (red spheres) are presented as dashed black lines. *The crystal structure of N. meningitidis OxyR contains two protein chains; in the active-site pocket of the alternate protein chain (not shown), the conserved water molecule which hydrogen bonds R270 is present but the conserved water molecule hydrogen bonding T129 is absent.
Fig. 3.
Fig. 3.
C206, T107, and R278 are the crucial residues for H2O2 catalysis. (A) In the crystal structure of Cg-OxyRH2O2, an H2O2 molecule occupies the active-site pocket in two of the four chains present in the asymmetric unit. Displayed is one of the two the H2O2 binding environments, termed pocket A (see Crystallographic and Kinetic Evidence for H2O2 Binding and Reduction). Here, the side-chain of S206 is directed away from the active site, whereas in pocket B, the side-chain of S206 is directed into the active site. Both conformations are displayed here, with a double-headed arrow indicating the rotameric change. The hydrogen-bonding network between H2O2, two conserved water molecules, and residues of the active site is expressed in terms of interatomic distances. (B) Mutation of the active-site residues impairs H2O2 reduction and supports the crystallographic data. WT Cg-OxyR and mutant variants (C206S, T107V, T136V, H205A, R278Q) were mixed with an equimolar amount of H2O2, and the H2O2 concentration was monitored in function of time with the FOX assay reagent. The lines correspond to single exponential fittings of the H2O2 consumption (n = 3). The error bars correspond to SD.
Fig. 4.
Fig. 4.
Cg-OxyR disulfide formation reorganizes its tetrameric conformation. (A) Crystal structure of reduced tetrameric Cg-OxyRC206S and a close-up view of the S206 and C215 of a single protomer (Right). (B) Crystal structure of the disulfide tetrameric Cg-OxyRSS, generated by crystallographic symmetry, with a close-up of the disulfide-bonded C206-C215 of a single protomer (Right). For both structures, each protomer is colored separately, and the RD homodimer formed by the blue and light-blue protomers were aligned before figure preparation, thereby providing a common orientation for structural comparison. (C) Each panel is a focused view of the relative positions of S206/C206 and C215 of the three crystal structures reported in this study. A structural alignment of all three structures was performed to provide a common orientation. The Left panel depicts the S206 and C215 of Cg-OxyRC206S, and is equivalent to the fully folded state of Cg-OxyRH2O2. The Center panel shows the locally unfolded state of Cg-OxyRH2O2, and the Right panel shows the C206-C215 disulfide of Cg-OxyRSS.
Fig. 5.
Fig. 5.
Cg-OxyR shows rapid conformational changes upon oxidation. (A) Structural view of the tryptophan location and its side-chain flip upon oxidation. (B) The side-chain flip leads to a decrease in intrinsic fluorescence. Fluorescence spectroscopy of Cg-OxyR upon oxidation by H2O2 and rereduction by DTT. (C) Cg-OxyR requires both cysteines for the full conformational change. One micromolar WT and C206S/C215S variants were mixed with 5 μM H2O2, and fluorescence decrease was monitored over time in a stopped-flow mixing device. (D) The conformational change rate increases with H2O2 concentration in a hyperbolic manner. Increasing concentrations of H2O2 were added to Cg-OxyR. The progress curves were fitted to single exponential equation, and the observed rate constants plotted against the H2O2 concentration (n = 3). Inset shows the progress curves of Cg-OxyR fluorescence changes upon addition of 10, 20, or 30 μM H2O2.
Fig. 6.
Fig. 6.
Cg-OxyR oxidation decreases binding affinity and extension to the catalase promoter region. (A) DNase I footprint of the C. glutamicum catalase promoter/operator region in presence of WT or C206S/C215S CgOxyR, and under reducing (Left) or oxidizing (Right) conditions. A C/T and A/G sequencing ladder and a no Cg-OxyR control were added in each condition. Binding regions are highlighted in blue, with the binding affinity being proportional to the color intensity. The nucleotides that are hypersensitive to DNase I treatment in presence of OxyR are marked by a green dot. The transcription start point (+1) is highlighted in red, and the −10 region is highlighted in salmon. A summary of the binding experiments is shown below. (B) Fluorescence polarization experiments using a 6-FAM–labeled oligonucleotide containing the catalase binding region (highlighted in gray in A). The labeled oligonucleotide was mixed with increasing concentrations of WT/C206S Cg-OxyR, under reducing or oxidizing conditions, until reaching binding saturation (n = 3).
Fig. 7.
Fig. 7.
Cg-OxyR controls catalase transcription, recovery from lag phase, survival to H2O2 stress, and H2O2 scavenging rate. (A) katA mRNA levels under normal conditions in the different C. glutamicumstrains (n = 3). (B) katA mRNA levels in the different C. glutamicum strains after 10 or 30 min upon a 10 mM H2O2 challenge (n = 3). (C) Growth curves for the different C. glutamicum strains (n = 3). (D) In vivo resistance to H2O2. The different Cg-OxyR strains were spotted on agar plates containing increasing concentrations of H2O2, and growth was evaluated. (E) H2O2 consumption rates. An 8-mM (Left) or 40-mM (Right) H2O2 bolus was added to growing cultures of the Cg-OxyR strains, and the H2O2 concentration decrease was monitored in function of time using the FOX reagent (n = 3). Samples were statistically compared with Student’s t test when indicated (NS, not significant; *P < 0.1; **P < 0.05; ***P < 0.01; #P < 0.005).
Fig. 8.
Fig. 8.
Comparison of H2O2 reduction mechanism by OxyR and Prdx. Schematic drawing of the Prdx peroxide-bound active site (A) [reprinted from ref. . Copyright (2010), with permission from Elsevier] in comparison with the OxyR active site (B). The key hydrogen bonds (dashed lines) that allow for H2O2 reduction are highlighted.

Similar articles

Cited by

References

    1. Imlay JA. The molecular mechanisms and physiological consequences of oxidative stress: Lessons from a model bacterium. Nat Rev Microbiol. 2013;11:443–454. - PMC - PubMed
    1. Sies H. Hydrogen peroxide as a central redox signaling molecule in physiological oxidative stress: Oxidative eustress. Redox Biol. 2017;11:613–619. - PMC - PubMed
    1. Seaver LC, Imlay JA. Hydrogen peroxide fluxes and compartmentalization inside growing Escherichia coli. J Bacteriol. 2001;183:7182–7189. - PMC - PubMed
    1. Winterbourn CC. The biological chemistry of hydrogen peroxide. Methods Enzymol. 2013;528:3–25. - PubMed
    1. Hall A, Parsonage D, Poole LB, Karplus PA. Structural evidence that peroxiredoxin catalytic power is based on transition-state stabilization. J Mol Biol. 2010;402:194–209. - PMC - PubMed

Publication types

MeSH terms

LinkOut - more resources