. 2019 Feb 5;93(4):e01622-18.
doi: 10.1128/JVI.01622-18. Print 2019 Feb 15.

Epidemiological Evidence for Lineage-Specific Differences in the Risk of Inapparent Chikungunya Virus Infection

Affiliations

Epidemiological Evidence for Lineage-Specific Differences in the Risk of Inapparent Chikungunya Virus Infection

Fausto Bustos Carrillo et al. J Virol. .

Abstract

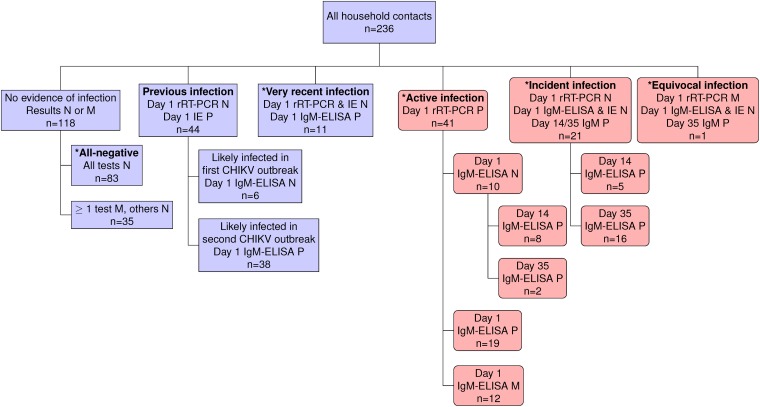
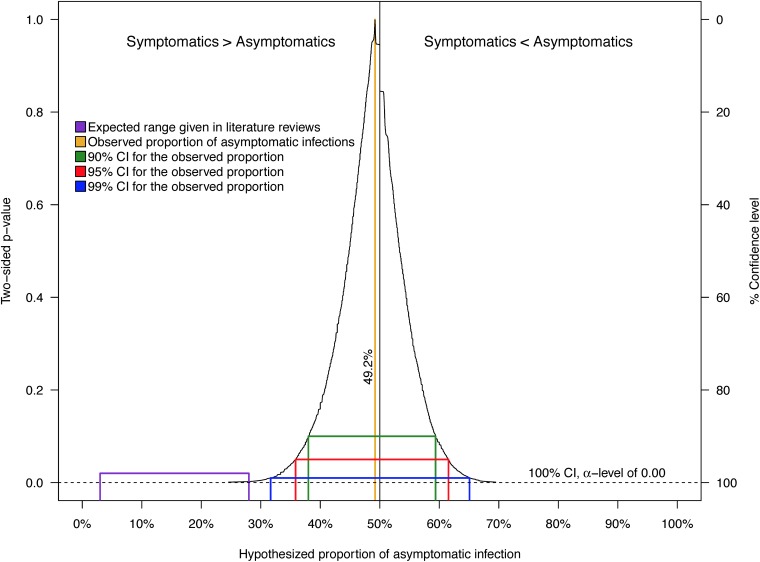
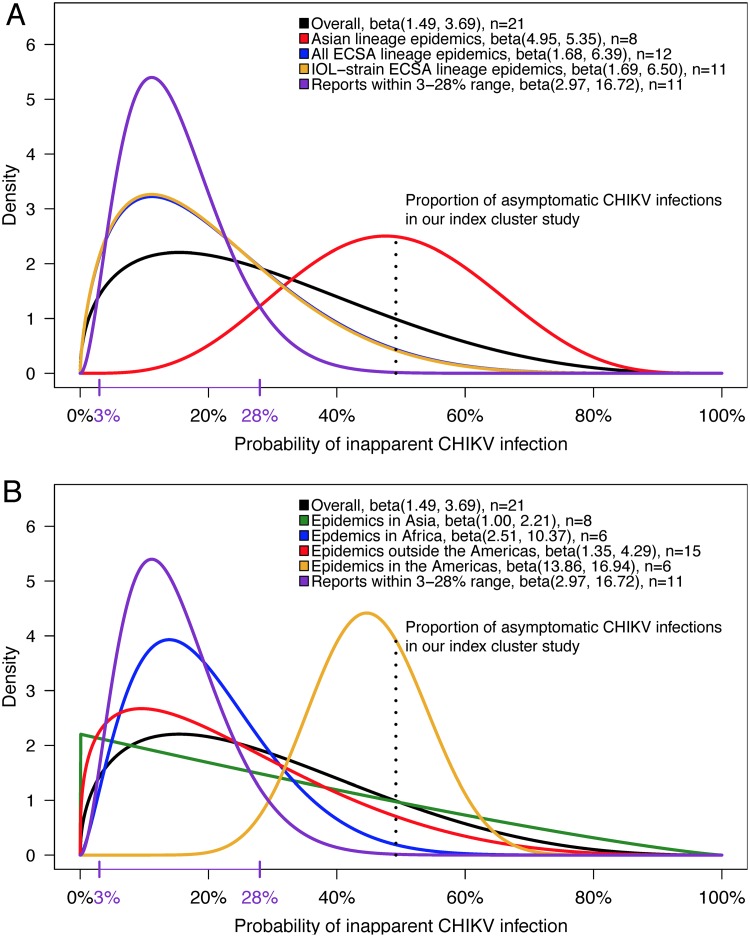
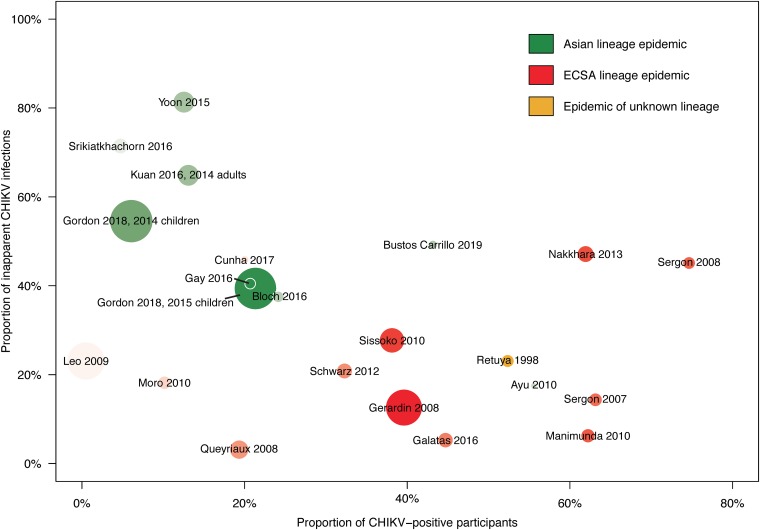
In late 2013, chikungunya virus (CHIKV) was introduced into the Americas, leading to widespread epidemics. A large epidemic caused by the Asian chikungunya virus (CHIKV) lineage occurred in Managua, Nicaragua, in 2015. Literature reviews commonly state that the proportion of inapparent CHIKV infections ranges from 3 to 28%. This study estimates the ratio of symptomatic to asymptomatic CHIKV infections and identifies risk factors of infection. In October to November 2015, 60 symptomatic CHIKV-infected children were enrolled as index cases and prospectively monitored, alongside 236 household contacts, in an index cluster study. Samples were collected upon enrollment and on day 14 or 35 and tested by real-time reverse transcription-PCR (rRT-PCR), IgM capture enzyme-linked immunosorbent assays (IgM-ELISAs), and inhibition ELISAs to detect pre- and postenrollment CHIKV infections. Of 236 household contacts, 55 (23%) had experienced previous or very recent infections, 41 (17%) had active infections at enrollment, and 21 (9%) experienced incident infections. Vehicle ownership (multivariable-adjusted risk ratio [aRR], 1.58) increased the risk of CHIKV infection, whereas ≥4 municipal trash collections/week (aRR, 0.38) and having externally piped water (aRR, 0.52) protected against CHIKV infection. Among 63 active and incident infections, 31 (49% [95% confidence interval {CI}, 36%, 62%]) were asymptomatic, yielding a ratio of symptomatic to asymptomatic infections of 1:0.97 (95% CI, 1:0.56, 1:1.60). Although our estimate is outside the 3% to 28% range reported previously, Bayesian and simulation analyses, informed by a systematic literature search, suggested that the proportion of inapparent CHIKV infections is lineage dependent and that more inapparent infections are associated with the Asian lineage than the East/Central/South African (ECSA) lineage. Overall, these data substantially improve knowledge regarding chikungunya epidemics.IMPORTANCE Chikungunya virus (CHIKV) is an understudied threat to human health. During the 2015 chikungunya epidemic in Managua, Nicaragua, we estimated the ratio of symptomatic to asymptomatic CHIKV infections, which is important for understanding transmission dynamics and the public health impact of CHIKV. This index cluster study identified and monitored persons at risk of infection, enabling capture of asymptomatic infections. We estimated that 31 (49%) of 63 at-risk participants had asymptomatic CHIKV infections, which is significantly outside the 3% to 28% range reported in literature reviews. However, recent seroprevalence studies, including two large pediatric cohort studies in the same setting, had also found percentages of inapparent infections outside the 3% to 28% range. Bayesian and simulation analyses, informed by a systematic literature search, revealed that the percentage of inapparent infections in epidemic settings varies by CHIKV phylogenetic lineage. Our study quantifies and provides the first epidemiological evidence that chikungunya epidemic characteristics are strongly influenced by CHIKV lineage.

Keywords: Bayesian analysis; S:A ratio; chikungunya virus; epidemics; index cluster study; lineage.


Figures

FIG 1
FIG 1
Geographic distribution in District II of Managua, Nicaragua, of laboratory-confirmed CHIKV infections per household in the study. The blocks corresponding to each neighborhood within the study site are colored and labeled. The study health center is indicated by a red cross. Participating homes that did not experience an infection among at-risk individuals are shown in blue, and homes with infections among at-risk individuals are shown in pink. The box label by each home with an infection indicates, in descending order, the house number (e.g., #7); the proportion of recent, active, and incident infections out of the total number of contacts (e.g., 2/8); and the number of previous infections in that household (e.g., 0). The households’ longitude and latitude values have been jittered to protect participants’ confidentiality.
FIG 2
FIG 2
Classification scheme based on CHIKV infection status of the 236 household contacts. Shown is a classification scheme of the household contacts with mutually exclusive categories. Day 1 refers to the baseline. The designation of particular categories was based only on the listed molecular or serological tests. For example, the classification of active infections was based solely on a positive rRT-PCR result on day 1, irrespective of day 1, 14, or 35 ELISA results. Based on viremia dynamics, individuals with very recent infections were likely infected within a week of the baseline visit. Those with equivocal infections met the definition of either an active or incident infection but were missing the day 1 rRT-PCR sample. Contacts in pink boxes (n = 63), unlike those in purple boxes (n = 173), were used to calculate the S:A ratio because their viremic period (and, hence, symptomatic period) overlapped the study period. Contact categories marked by an asterisk (n = 157) were at risk of a CHIKV infection after or slightly before study initiation. P, positive; N, negative; M, missing.
FIG 3
FIG 3
Sign and symptom cooccurrence dendrogram for the 32 symptomatic infections. The hierarchical clustering dendrogram conveys how signs and symptoms cooccurred simultaneously in the 32 individuals with symptomatic active and incident infections. Particular signs and symptoms that appear closer together on the dendrogram are more likely to be either jointly present or jointly absent in symptomatic individuals than signs and symptoms that are further apart on the dendrogram. Use of the modern Ward agglomerative method identified three clusters: (i) joint pain, muscle pain, fever, and headache (in red); (ii) rash (in blue); and (iii) all other signs and symptoms (in green). The occurrence frequency for each individual sign and symptom is additionally listed on the right.
FIG 4
FIG 4
Age trend analysis of CHIKV infections and symptomatic CHIKV infections. Generalized additive model (GAM) curves illustrate the marginal trend between age and the probability of infection (A) and age and the probability of a symptomatic outcome, given infection (B). The first curve was fit among the 157 household contacts who were at risk of CHIKV infection after or slightly before study initiation. The second curve was fit among the 63 individuals with active and incident CHIKV infections. Confidence intervals (CI) account for the clustered data structure, having been nonparametrically bootstrapped at the household level 10,000 times.
FIG 5
FIG 5
Confidence interval function for the proportion of infections based on the 63 household contacts with active and incident CHIKV infections. Shown is a simultaneous depiction of 1,000 bias-corrected and accelerated (BCa) confidence intervals (CIs) as well as every two-sided P value associated with null values for hypothetical proportions of infection, given the data, across the full range of α values. For the CI function, values closer to the point estimate of 49.2% are more compatible with the data than those further away. The purple line represents the range for the proportion of inapparent CHIKV infections (3 to 28%) commonly reported in literature reviews.
FIG 6
FIG 6
Comparison of prior distributions for the probability of inapparent CHIKV infection. Prior distributions, estimated from the literature, from epidemics caused by different lineages (A) and in different geographical settings (B) are shown. A prior distribution for epidemics caused by the non-IOL-strain ECSA lineage, with respect to the proportion of inapparent infections, could not be estimated from the single non-IOL-strain ECSA lineage study that met our inclusion and exclusion criteria. As a result, the prior estimated for IOL strain ECSA lineage outbreaks (A, in yellow) very closely mirrors the prior estimated for all ECSA lineage outbreaks (in blue) faintly visible below it. n, number of distinct populations contributing to the estimation of the prior distribution’s hyperparameters.
FIG 7
FIG 7
Risk of CHIKV infection and inapparent clinical presentation in the literature. Scatterplot elements correspond to data in Table 4 (10, 14, 20–27, 30, 31, 85–92). The radius of each study’s data point is scaled to the sample size, and the circle is shaded to the size of the CHIKV-infected population (adapted from reference with permission). Data from the present study are included for visual comparison with previously published studies.
FIG 8
FIG 8
Flow diagram of the systematic literature search.

Similar articles

Cited by

References

    1. Centers for Disease Control and Prevention. 2015. Chikungunya virus: clinical evaluation and disease. Centers for Disease Control and Prevention, Atlanta, GA.
    1. Nkoghe D, Kassa RF, Caron M, Grard G, Mombo I, Bikie B, Paupy C, Becquart P, Bisvigou U, Leroy EM. 2012. Clinical forms of Chikungunya in Gabon, 2010. PLoS Negl Trop Dis 6:e1517. doi:10.1371/journal.pntd.0001517. - DOI - PMC - PubMed
    1. Teo T-H, Her Z, Tan JJL, Lum F-M, Lee WWL, Chan Y-H, Ong R-Y, Kam Y-W, Leparc-Goffart I, Gallian P, Rénia L, de Lamballerie X, Ng LFP. 2015. Caribbean and La Réunion chikungunya virus isolates differ in their capacity to induce proinflammatory Th1 and NK cell responses and acute joint pathology. J Virol 89:7955–7969. doi:10.1128/JVI.00909-15. - DOI - PMC - PubMed
    1. Gardner J, Anraku I, Le TT, Larcher T, Major L, Roques P, Schroder WA, Higgs S, Suhrbier A. 2010. Chikungunya virus arthritis in adult wild-type mice. J Virol 84:8021–8032. doi:10.1128/JVI.02603-09. - DOI - PMC - PubMed
    1. Langsjoen RM, Haller SL, Roy CJ, Vinet-Oliphant H, Bergren NA, Erasmus JH, Livengood JA, Powell TD, Weaver SC, Rossi SL. 2018. Chikungunya virus strains show lineage-specific variations in virulence and cross-protective ability in murine and nonhuman primate models. mBio 9:e02449-17. doi:10.1128/mBio.02449-17. - DOI - PMC - PubMed

Publication types