. 2019 Feb 5;93(4):e01985-18.
doi: 10.1128/JVI.01985-18. Print 2019 Feb 15.

The Dengue Virus Nonstructural Protein 1 (NS1) Is Secreted from Mosquito Cells in Association with the Intracellular Cholesterol Transporter Chaperone Caveolin Complex

Affiliations

The Dengue Virus Nonstructural Protein 1 (NS1) Is Secreted from Mosquito Cells in Association with the Intracellular Cholesterol Transporter Chaperone Caveolin Complex

Romel Rosales Ramirez et al. J Virol. .

Abstract

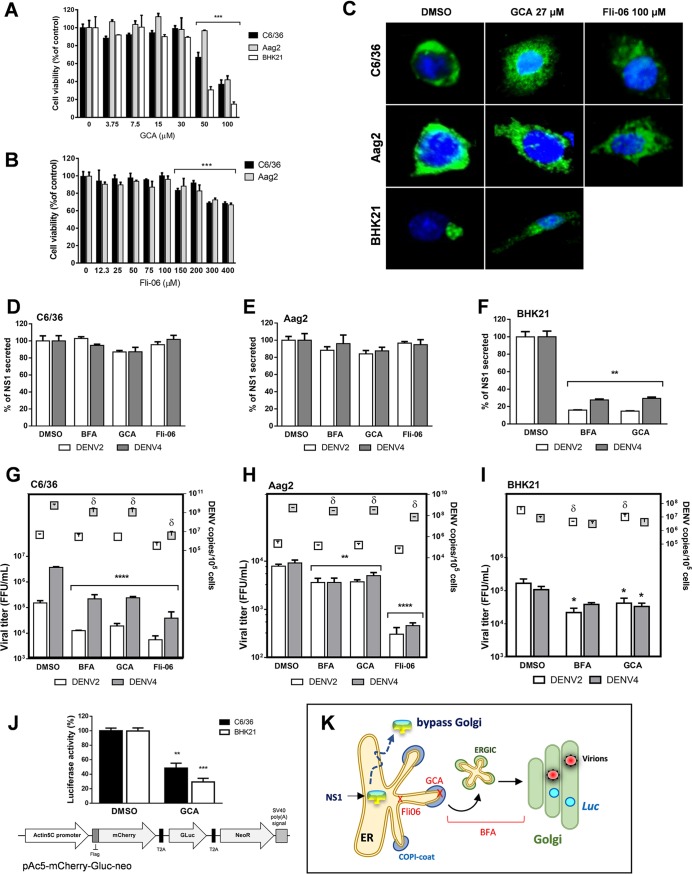
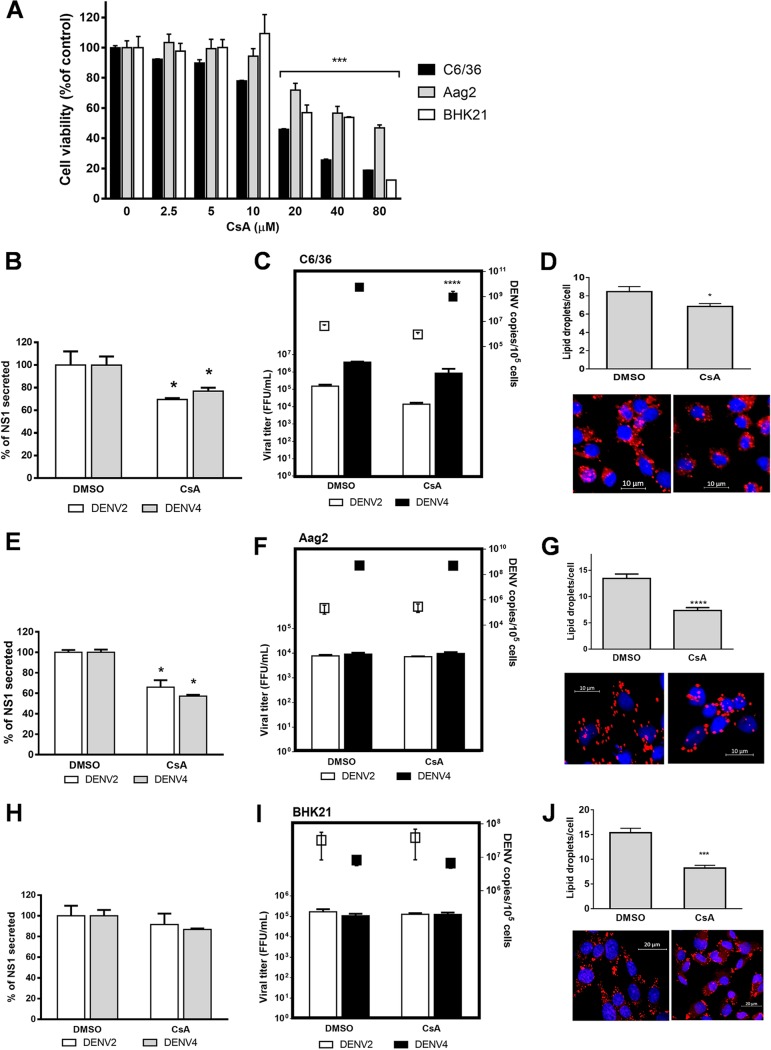
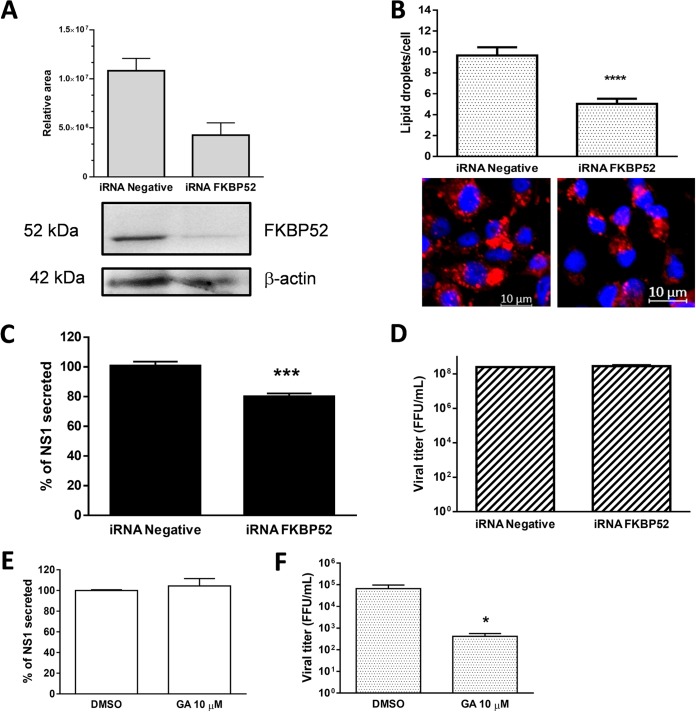
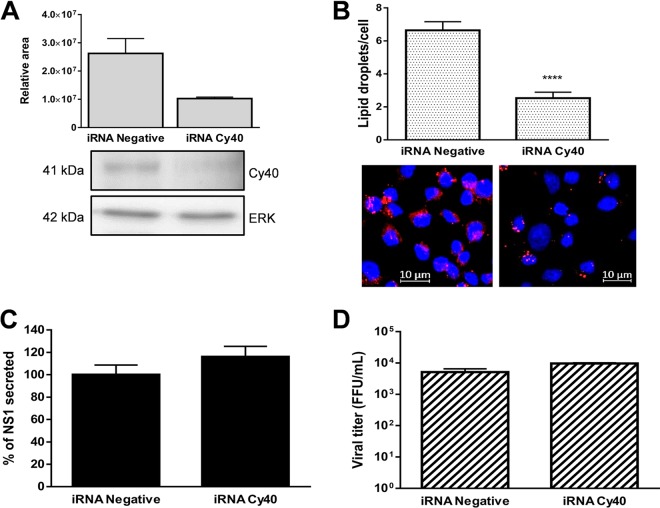
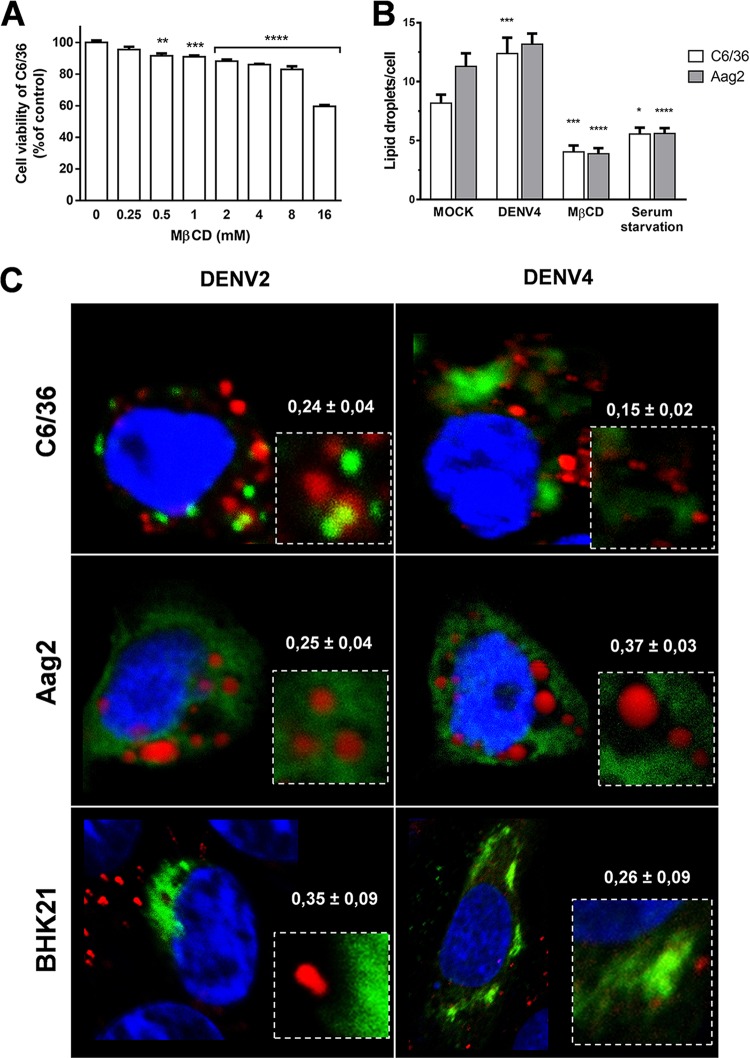
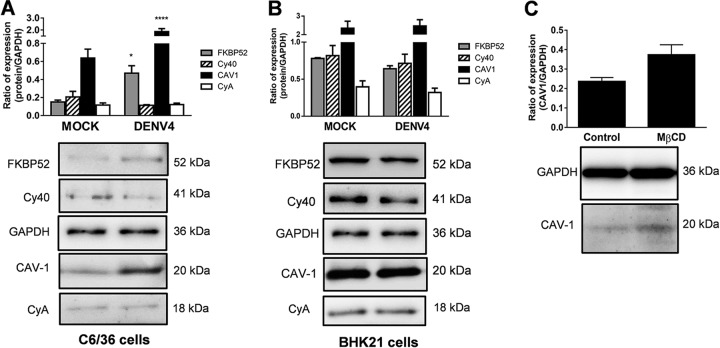
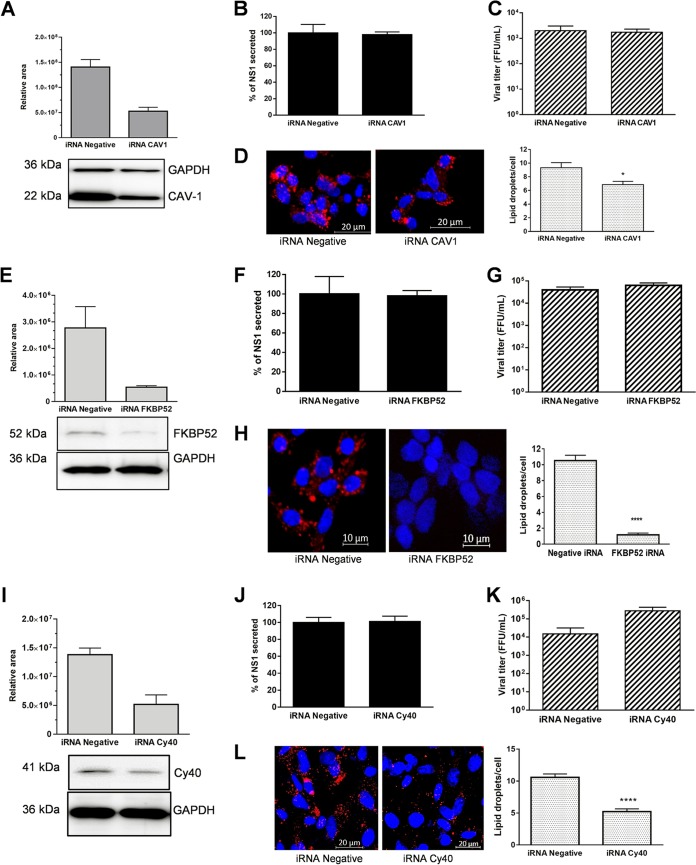
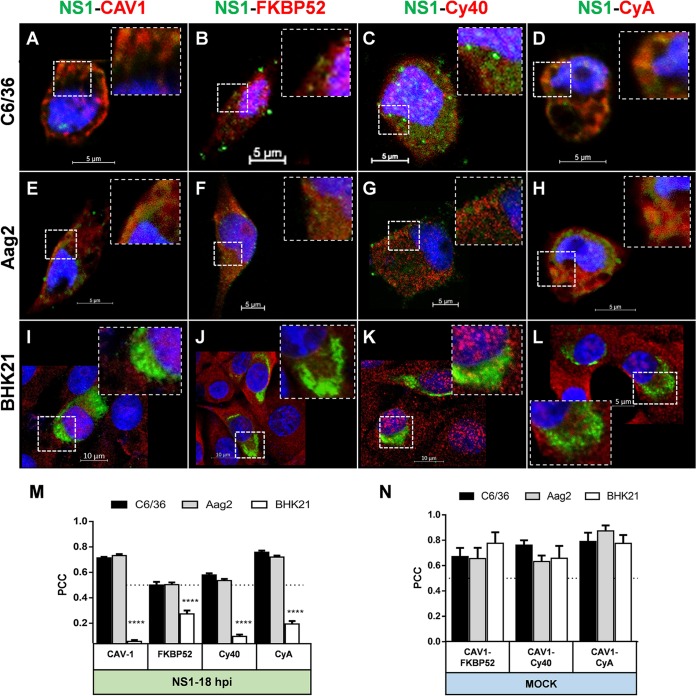
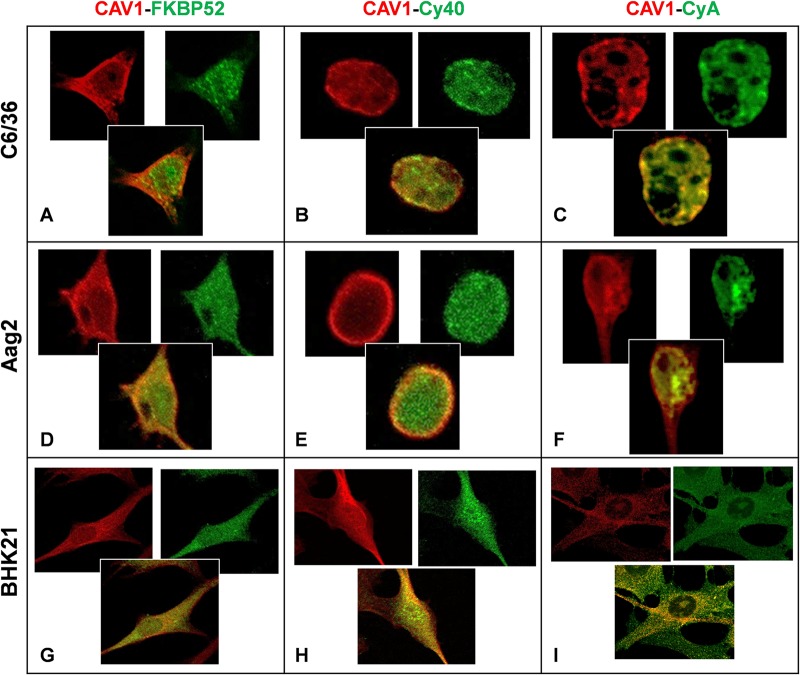
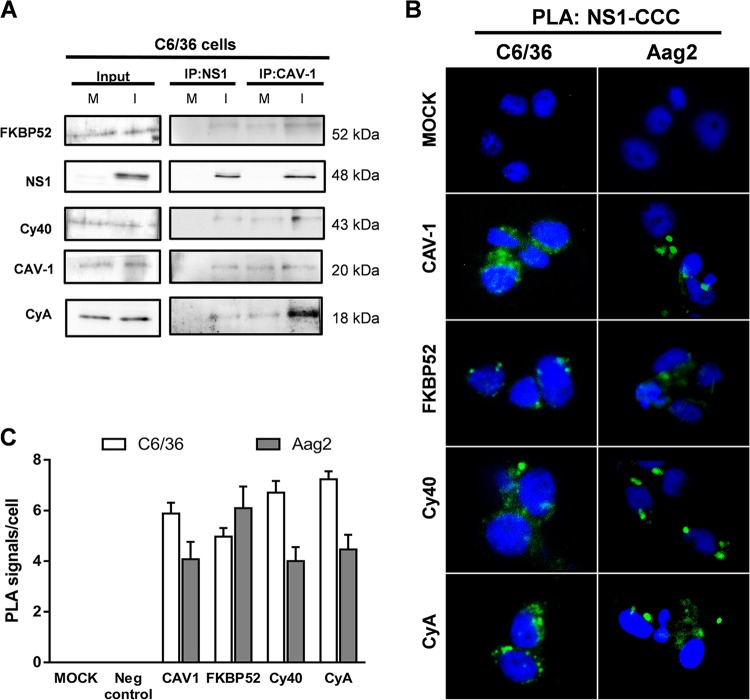
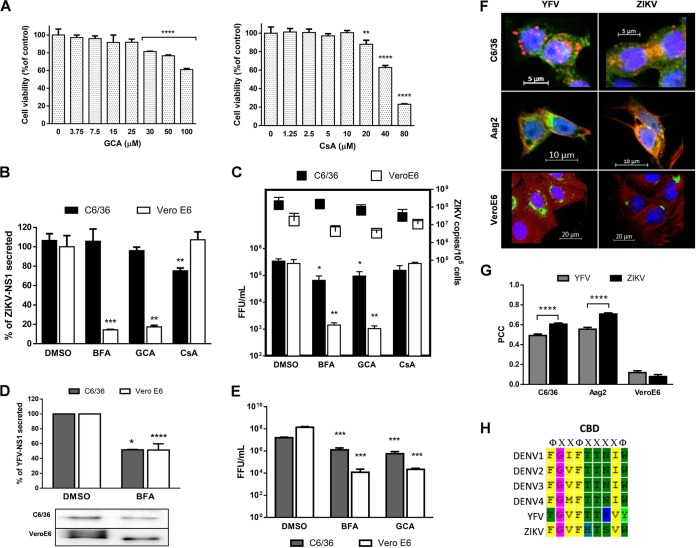
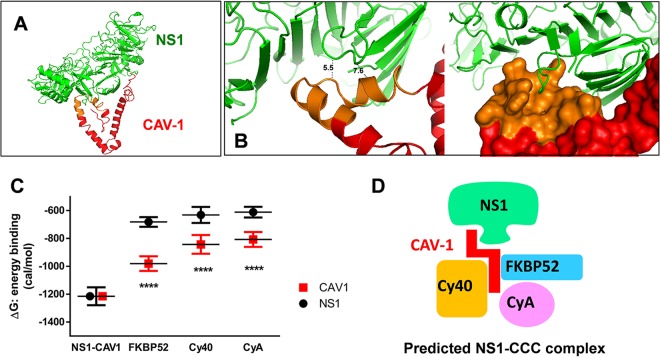
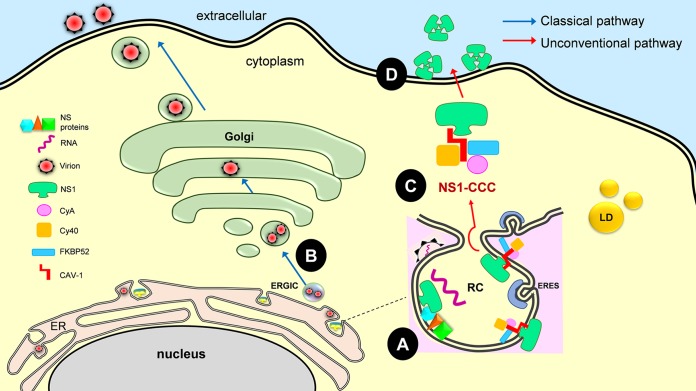
Dengue virus (DENV) is a mosquito-borne virus of the family Flaviviridae The RNA viral genome encodes three structural and seven nonstructural proteins. Nonstructural protein 1 (NS1) is a multifunctional protein actively secreted in vertebrate and mosquito cells during infection. In mosquito cells, NS1 is secreted in a caveolin-1-dependent manner by an unconventional route. The caveolin chaperone complex (CCC) is a cytoplasmic complex formed by caveolin-1 and the chaperones FKBP52, Cy40, and CyA and is responsible for the cholesterol traffic inside the cell. In this work, we demonstrate that in mosquito cells, but not in vertebrate cells, NS1 associates with and relies on the CCC for secretion. Treatment of mosquito cells with classic secretion inhibitors, such as brefeldin A, Golgicide A, and Fli-06, showed no effect on NS1 secretion but significant reductions in recombinant luciferase secretion and virion release. Silencing the expression of CAV-1 or FKBP52 with short interfering RNAs or the inhibition of CyA by cyclosporine resulted in significant decrease in NS1 secretion, again without affecting virion release. Colocalization, coimmunoprecipitation, and proximity ligation assays indicated that NS1 colocalizes and interacts with all proteins of the CCC. In addition, CAV-1 and FKBP52 expression was found augmented in DENV-infected cells. Results obtained with Zika virus-infected cells suggest that in mosquito cells, ZIKV NS1 follows the same secretory pathway as that observed for DENV NS1. These results uncover important differences in the dengue virus-cell interactions between the vertebrate host and the mosquito vector as well as novel functions for the chaperone caveolin complex.IMPORTANCE The dengue virus protein NS1 is secreted efficiently from both infected vertebrate and mosquito cells. Previously, our group reported that NS1 secretion in mosquito cells follows an unconventional secretion pathway dependent on caveolin-1. In this work, we demonstrate that in mosquito cells, but not in vertebrate cells, NS1 secretion takes place in association with the chaperone caveolin complex, a complex formed by caveolin-1 and the chaperones FKBP52, CyA, and Cy40, which are in charge of cholesterol transport inside the cell. Results obtained with ZIKV-infected mosquito cells suggest that ZIKV NS1 is released following an unconventional secretory route in association with the chaperone caveolin complex. These results uncover important differences in the virus-cell interactions between the vertebrate host and the mosquito vector, as well as novel functions for the chaperone caveolin complex. Moreover, manipulation of the NS1 secretory route may prove a valuable strategy to combat these two mosquito-borne diseases.

Keywords: NS1; Zika virus; caveolin-1; chaperone caveolin complex; dengue virus; flavivirus; mosquito cells; unconventional secretion; viral protein trafficking; yellow fever virus.


Figures

FIG 1
FIG 1
NS1 secretion is not affected in mosquito cells treated with classical secretion pathway inhibitors. (A) Cell toxicity of GCA in C6/36, Aag2, and BHK-21 cells. (B) Cell toxicity of Fli-06 in C6/36 and Aag2 cells. (A and B) Serial dilutions of GCA and Fli-06 were applied for 24 h. Data are means from 3 independent experiments ± standard errors; significant differences compared with controls are denoted by asterisks (P < 0.0001). (C) Golgi matrix integrity after cell treatment with GCA at 27 μM and Fli-06 at 100 μM for 24 h was determined by staining the cis-Golgi matrix. Cells were fixed and stained with anti-GM130 (cis-Golgi, in green) and DAPI (nuclei in blue). (D) NS1 secretion with inhibition of classical secretory pathway in C6/36 cells. (E) NS1 secretion with inhibition of classical secretory pathway in Aag2 cells. (F) NS1 secretion with inhibition of classical secretory pathway in BHK-21 cells. (G) Viral release and DENV RNA copies in drug-treated C6/36 cells. (H) Viral release and DENV RNA copies in drug-treated Aag2 cells. (I) Viral release and DENV RNA copies in drug-treated BHK-21 cells. (D, E, and F) Cells were infected with DENV2 or DENV4 at an MOI of 3 for 1 h. The cells were washed 3 times and treated with DMSO (control), 25 μM BFA, 27 μM GCA, or 100 μM Fli-06, and supernatants were harvested at 24 hpi. DENV NS1 was measured using Platelia NS1 Ag (Bio-Rad) and represented as percentage of NS1 secreted compared to the value for the DMSO control. (G, H, and I) Viral titers were measured in supernatants from treated cells by focus-forming assay in BHK-21 cells by following a standard protocol. Total DENV RNA copies were calculated in 105 cells and values plotted on a secondary y axis. DENV2/DENV4 RNA copies were measured by real-time RT-PCR using TaqMan technology as described in the text. (J) C6/36 cells (pAc5-mCherry-GLuc-neo transfected) and BHK-21 cells (ptk-GLuc transfected) expressing Gaussia luciferase were treated with DMSO and 27 μM GCA for 24 h. Luciferase activity was measured in supernatants and represented as percentage of Luc activity. pAc5-mCherry-GLuc-Neo was constructed by cloning GLuc into the XbaI-HindIII sites of pAc5-STABLE 2-Neo, designed for tricistronic expression driven by the Actin5C promoter. FLAG-tagged mCherry, Gaussia luciferase, and NeoR, each separated by a T2A peptide, are shown. (D, E, F, G, H, I, and J) The experiments were performed in triplicate, and the bars represent means ± standard errors (error bars). Data were evaluated using the 2-way analysis of variance (ANOVA) test, and significant differences compared with results for the DMSO treatment group are denoted by asterisks (P ≤ 0.05). δ, four asterisks. (K) Diagram showing the modes of action of the drugs used and the early ER exit of DENV NS1 in mosquito cells.
FIG 2
FIG 2
NS1 secretion is inhibited in mosquito cells treated with CsA. (A) Cell toxicity of cyclosporine (CsA) in C6/36, Aag2, and BHK-21 cells. Serial dilutions of CsA were applied for 24 h. Data are means from 3 independent experiments ± standard errors, and significant differences compared with the control are denoted by asterisks (P < 0.0001). (B) NS1 secretion in CsA-treated C6/36 cells. (C) Viral release and DENV RNA copies in CsA-treated C6/36 cells. (D) Lipid droplet counting in C6/36 cells treated with CsA. (E) NS1 secretion in CsA-treated Aag2 cells. (F) Viral release and DENV RNA copies in CsA-treated Aag2 cells. (G) Lipid droplet counting in Aag2 cells treated with CsA. (H) NS1 secretion in CsA-treated BHK-21 cells. (I) Viral release and DENV RNA copies in CsA-treated BHK-21 cells. (J) Lipid droplet counting in BHK-21 cells treated with CsA. (B, E, and H) Cells were infected with DENV2 or DEN4 at an MOI of 3 for 1 h. The cells were washed 3 times, treated with DMSO (control) or 9 μM CsA, and harvested at 24 hpi. DENV NS1 in supernatants was measured using Platelia NS1 Ag (Bio-Rad) and represented as percentage of NS1 secreted compared to the control level (DMSO). (C, F, and I) Viral titers in supernatants were measured by focus-forming assay in BHK-21 cells according to standard procedures. Total DENV RNA copies in 105 cell lysates were measured by real-time RT-PCR using TaqMan technology as described in the text. (D, G, and J) Lipid droplets were stained with Nile red (red) and nuclei with DAPI (blue). LD were counted in maximum projection images in treated cells from at least 25 cells by group (DMSO or CsA) using the Spot Detector plugin with Icy Image software. LD median count differences were compared using Student's t test, denoted by asterisks (P ≤ 0.05). (B, C, E, F, H, and I) The experiments were performed in triplicate, and the bars represent means ± standard errors (error bars). Data were evaluated using the 2-way ANOVA test, and significant differences are from comparisons to the DMSO treatment group, denoted by asterisks (P ≤ 0.05).
FIG 3
FIG 3
NS1 secretion is inhibited in mosquito cells transfected with FKBP52 siRNA. (A) C6/36 cells were transfected with 50 nM siRNA targeting FKBP52 or with AllStars negative-control siRNA. Protein expression was measured by Western blotting after 48 h (FKBP52 antibody, 1/2,000). After 24 h posttransfection, cells were infected with DENV4 for 1 h at an MOI of 3. (B) LD count in C6/36 cells silenced for FKBP52 expression. LD counting in FKBP52 and negative knockdown were measured by LD staining with Nile red. LD were counted in maximum projection images in at least 20 treated cells using the Spot Detector plugin in Icy Image software. LD median count differences were compared using Student's t test, denoted by asterisks (P ≤ 0.05). (C) Secreted DENV NS1 in siRNA-transfected C6/36-infected cells. NS1 was measured after 48 h posttransfection using Platelia NS1 Ag (Bio-Rad) and represented as percentage of NS1 secreted compared to that of the negative siRNA. (D) Viral titers in supernatants were measured by focus-forming assay in BHK-21 cells by following standard procedures. (E) Independence of the FKBP52 cochaperone activity on HSP90 was assayed by geldanamycin (GA) treatment. HSP90 inhibition is not responsible for reduction in NS1 secretion. C6/36 cells were treated with 10 μM GA, a specific inhibitor of HSP90. Percentage of secreted NS1 in 24 hpi is shown. (F) Viral titers in GA treatment in C6/36-DENV-infected cells. Supernatants were measured by focus-forming assay in BHK-21 cells by following standard procedures. (C, D, E, and F) All data are means from 3 independent experiments ± standard errors (error bars), and significant differences were compared using Student's t test, denoted by asterisks (P ≤ 0.05).
FIG 4
FIG 4
NS1 secretion is not affected in mosquito cells transfected with Cy40 siRNA. (A) C6/36 cells were transfected with 50 nM siRNA targeting Cy40 or with All Stars negative-control siRNA. Protein expression was measured by Western blotting after 48 h (Cy40 antibody, 1/2,000). After 24 h posttransfection, cells were infected with DENV4 for 1 h at an MOI of 3. (B) LD count in C6/36 cells silenced for Cy40 expression. LD counting in Cy40 and negative-control knockdown were measured by LD staining with Nile red. LD were counted in maximum projection images in at least 20 treated cells using the Spot Detector plugin in Icy Image software. LD median count differences were compared using Student's t test, denoted by asterisks (P ≤ 0.05). (C) Secreted DENV NS1 was measured after 48 h posttransfection using Platelia NS1 Ag (Bio-Rad) and represented as percentage of NS1 secreted compared to that of negative siRNA. (D) Viral titers in supernatants were measured by focus-forming assay in BHK-21 cells by following standard procedures. (C and D) All data are means from 3 independent experiments ± standard errors, and significant differences were compared using Student's t test, denoted by asterisks (P ≤ 0.05).
FIG 5
FIG 5
Cholesterol metabolic stress modifies lipid droplets, and DENV NS1 does not colocalize with lipid droplets in mosquito cells. (A) Cell toxicity of MβCD in C6/36 cells. Data are means from 3 independent experiments ± standard errors, and significant differences compared with values for the control are denoted by asterisks (P < 0.0001). (B) Modification in lipid droplet count in mosquito cells during cholesterol stress. DENV4 infection (MOI of 3), MβCD treatment (1 mM), and serum starvation were performed in the absence of bovine fetal serum for 24 h. LD median count differences were compared with mock infection using two-way ANOVA, denoted by asterisks (P ≤ 0.05). (C) Colocalization of NS1 and lipid droplets in DENV2- and DENV4-infected mosquito and vertebrate cells (C6/36, Aag2, and BHK-21). LD were stained with BODIPY (shown in red), DENV NS1 is shown in green, and nuclei are in blue (DAPI). The insets show magnifications of the selected zones. PCC was used to evaluate the degree of colocalization between NS1 and LD. PCC are shown in each square panel. The images were analyzed using an LSM 700 confocal microscope with laser sections (0.38 μm).
FIG 6
FIG 6
Expression of the chaperone caveolin complex is augmented in DENV-infected mosquito cells. (A) Relative protein expression of CCC in DENV4-C6/36-infected cells at an MOI of 3. (B) Relative protein expression of CCC in DENV4-BHK-21-infected cells at an MOI of 3. (C) CAV-1 expression levels in C6/36 cells treated with 1 mM MβCD. CAV-1 expression was determined by Western blotting and normalized with GAPDH. Values are means ± SEM from 4 independent experiments. (A and B) Cells were mock or DENV4 infected at an MOI of 3 for 24 h. The relative protein expression of caveolin chaperone complex was determined in 20 μg of cell lysates by the ratio of the sample value to an internal standard control (GAPDH). Ratio values are means ± SEM (n = 4 for mock or DENV4). Significant differences were compared using Mann-Whitney U test. Significance is indicated by asterisks (P < 0.05).
FIG 7
FIG 7
NS1 secretion is not affected in vertebrate cells transfected with CAV-1, FKBP52, or Cy40 siRNAs. (A to D) Knockdown of CAV-1. (A) BHK-21 cells were transfected with 50 nM siRNA targeting CAV-1 or with AllStars negative-control siRNA. (B) Secreted DENV NS1 after CAV-1 knockdown. (C) Viral release after CAV-1 knockdown. (D) LD count in BHK-21 cells silenced for CAV-1 expression. (E to H) Knockdown of FKBP52. (E) BHK-21 cells were transfected with 50 nM siRNA targeting FKBP52 or with AllStars negative-control siRNA. (F) Secreted DENV NS1 after FKBP52 knockdown. (G) Viral release after FKBP52 knockdown. (H) LD count in BHK-21 cells silenced for FKBP52 expression. (I to L) Knockdown of cyclophilin 40. (I) BHK-21 cells were transfected with 50 nM siRNA targeting Cy40 or with AllStars negative-control siRNA. (J) Secreted DENV NS1 after Cy40 knockdown. (K) Viral release after Cy40 knockdown. (L) LD count in BHK-21 cells silenced for Cy40 expression. (A, E, and I) Gene knockdown was assessed using Western blotting. Protein expression was measured and normalized with GAPDH after 48 h. After 24 h posttransfection, cells were infected with DENV4 at an MOI of 3 for 1 h. Data are means from three experiments ± standard errors of the means (SEM). (B, F, and J) Secreted DENV NS1 was measured after 48 h posttransfection of siRNA using Platelia NS1 Ag (Bio-Rad) and represented as percentage of NS1 secreted compared to results for negative-control siRNA. (C, G, and K) Viral titers were measured by focus-forming assay in BHK-21 cells. (B, C, F, G, J, and K) All data are means ± SEM (error bars), n = 3, and significant differences were compared using Student's t test, denoted by asterisks (P ≤ 0.05). (D, H, and L) LD were measured by LD staining with Nile red and counted in maximum projection images in at least 20 cells using the Spot Detector plugin in Icy Image software. LD median count differences were compared using Student's t test, denoted by asterisks (P ≤ 0.05).
FIG 8
FIG 8
DENV NS1 colocalizes with proteins of the CCC in mosquito cells. (A, B, C, and D) Colocalization for NS1 and CCC in C6/36 cells. (E, F, G, and H) Colocalization for NS1 and CCC in Aag2 cells. (I, J, K, and L) Colocalization for NS1 and CCC in BHK-21 cells. All cells were infected with DENV4 at an MOI  of  3 and fixed at 18 hpi. The cells were probed against NS1 (in green) and CAV-1, FKBP52, CyA, and Cy40 (in red). Nuclei were stained with DAPI (in blue). In merged fluorescent images of DAPI, red and green channels are shown. Inset panels show magnifications of the detected spots corresponding to the colocalization. The images were analyzed using an LSM 800 confocal microscope. (M) PCC was used to evaluate the degree of colocalization between NS1 and each of the CCC proteins in the 3 cell lines infected with DENV4. (N) PCC was used to evaluate degree of colocalization between CAV-1 and FKBP52, CyA, and Cy40 in noninfected cell lines as a control for CCC. Confocal images of noninfected cells are shown in Fig. 9. (M and N) The images were analyzed using an LSM 800 confocal microscope with laser sections (0.45 μm). The bars represent means ± standard errors from at least 20 independent confocal cell images. Data were evaluated using the 2-way ANOVA test, and significant differences between groups are denoted by asterisks (P ≤ 0.0001). The dotted line indicates the threshold for true colocalization (PCC ≥ 0.5).
FIG 9
FIG 9
Chaperone caveolin complex colocalization in noninfected vertebrate and mosquito cells. (A, B, and C) Colocalization for NS1 and CCC in C6/36 cells. (D, E, and F) Colocalization for NS1 and CCC in Aag2 cells. (G, H, and I) Colocalization for NS1 and CCC in BHK-21 cells. Mock-infected cells were fixed and probed against CAV-1 (shown in red) and FKBP52, CyA, and Cy40 (shown in green). Merged fluorescent images, with red and green channels, are shown. The images were analyzed using an LSM 800 confocal microscope. PCC were used to analyze the degree of colocalization with laser sections (0.41 μm) (PCC are shown in Fig. 8N).
FIG 10
FIG 10
DENV NS1 interacts with proteins of the CCC in mosquito cells. (A) Immunoprecipitation assays with anti-NS1 and anti-CAV-1 antibodies in C6/36 cells. Mock-infected (M) and DENV4-infected (I) cell lysates (18 hpi) were processed for IP using anti-CAV-1 polyclonal antibody (n-20; Santa Cruz) and anti-NS1 polyclonal antibody (GTX124280; Genetex). After extensive washing, eluted protein complexes were analyzed for the presence of CAV-1, NS1, FKBP52, Cy40, and CyA by Western blotting. For the input, mock- and DENV4-infected cell lysates prior to the immunoprecipitation served as controls for protein detection. (B) Proximity ligation assay (PLA-Duolink) between NS1 and the CCC in infected mosquito cells. PLA signals (green) represent dual-recognition PLA against NS1 and CAV-1, FKBP52, Cy40, or CyA. Nuclei were stained with DAPI (blue). (C) Quantification of PLA signals (green spots) per cell on DENV4-infected C6/36 and Aag2 cells (PLA signals greater than 3 pixels) from panel B. PLA signals per cell were counted in each Duolink experiment in at least 20 cells using the Spot Detector plugin in Icy Image software. (B and C) C6/36 and Aag2 mock-infected cells were incubated with both primary antibodies, and infected cells incubated without CAV-1 antibody were included as negative controls. The bars represent mean PLA signals per cell ± standard errors from at least 20 cells. Data were evaluated using the Student's t test, and significant differences are denoted by asterisks (P ≤ 0.05).
FIG 11
FIG 11
ZIKV and YFV NS1 secretion in infected mosquito cells. (A) Cell toxicity of GCA and CsA in Vero E6 cells. Serial dilutions of GCA and CsA were applied for 24 h. Data are means from 3 independent experiments ± standard errors; significant differences compared with values for the controls are denoted by asterisks (P < 0.0001). (B) NS1 secretion with inhibition of classical secretory pathway and CyA by CsA in ZIKV-infected C6/36 and Vero E6 cells at 48 hpi. (C) Viral release and RNA copies in ZIKV-infected cells treated with inhibitors of the classical secretion pathway and CsA at 48 hpi (n = 2). Total ZIKV RNA copies were calculated in 105 cells and values plotted in a secondary y axis. ZIKV copies were measured by real-time RT-PCR using TaqMan technology as described in the text. (D) NS1 secretion with inhibition of classical secretory pathway in YFV-17D-infected C6/36 and Vero E6 cells at 72 hpi. Secreted YFV NS1 amount was evaluated by Western blotting and estimated by densitometric measuring with ImageJ software (57). Densitometric measuring was changed to percentage of NS1 secreted as described in the text. (E) Viral release in YFV-17D-infected cells treated with inhibitors of the classical secretion pathway at 72 hpi. (F) Colocalization between YFV NS1 or ZIKV NS1 and CAV-1 in mosquito and VeroE6 cells. C6/36, Aag2, and VeroE6 cells were infected at an MOI of 1 for 48 h. Cells were probed for CAV-1 (shown in red), viral NS1 (shown in green), and nuclei stained with DAPI (blue). (G) PCC for CAV1-NS1 were measured in at least 20 confocal independent images with 0.48-μm laser sections. The bars represent means ± standard errors. Data were evaluated using the 2-way ANOVA test, and significant differences are denoted by asterisks (P ≤ 0.05). (H) Protein sequence alignment of caveolin binding domain (CBD) in Flavivirus NS1. Φ, aromatic amino acid (F/Y/W); X, any amino acid. (B, C, D, and E) Cells were infected with YFV or ZIKV at an MOI of 3 for 1 h. The cells were washed 3 times and then treated with DMSO (control), 25 μM BFA, 27 μM GCA, or 9 μM CsA. For ZIKV infection, supernatants were harvested at 48 hpi, and for YFV infection, supernatants were collected 72 hpi. Secreted ZIKV NS1 was measured using in-house ELISA and represented as percentage of secreted NS1 compared to the level for DMSO. Viral titers in supernatants were measured by focus-forming assay in Vero E6 cells according to standard procedures. The experiments were performed in triplicate, and the bars represent means ± standard errors. Data were evaluated using the 2-way ANOVA test, and significant differences compared with levels for the DMSO treatment group are denoted by asterisks (P ≤ 0.05).
FIG 12
FIG 12
In silico prediction of the interaction of DENV NS1 with the CCC. (A) Interaction of NS1 and human CAV-1 (isoform alpha; GenBank accession no. NP_001844.2). The CAV-1 3D model (red) was retrieved from the RaptorX server (26). CAV-1 scaffolding domain (CSD) is indicated in orange, and dimeric DENV2 NS1 (PDB entry 4O6B) is in green. (B) Interface distances in docking simulation of DENV NS1 and CAV-1. Dotted lines show measurement distances between amino acids (in Å) as estimated by the PyMOL Molecular Graphics System (version 2.0; Schrödinger, LLC). (C) Intermolecular binding energy for DENV NS1 and the CCC proteins. Energies of twenty clusters of protein dockings were plotted. ΔG (cal/mol) values were estimated by ClusPro server (https://cluspro.bu.edu/home.php). (D) Modeled prediction of DENV NS1 and CCC based on the intermolecular binding energies.
FIG 13
FIG 13
Proposed model for unconventional secretion of DENV NS1 through CCC in mosquito cells. (A) DENV replication complexes. Viral RNA is synthesized within RC with the assistance of viral nonstructural proteins. NS1 interacts with the nonstructural proteins to assist membrane bending and envelopment of nucleocapsids. Virions are packed and transported to ERGIC vesicles. NS1 dimer interacts with ER inner membrane in RC. (B) Virions are incorporated into vesicles within the Golgi membrane and transported through the trans-Golgi network. Finally, mature virions are released to extracellular space by following a classical Golgi pathway (BFA or GCA sensitive). (C) NS1 interacts with CAV-1 scaffolding domain through its β-roll domain in the ER-lumen. Proteins FKBP52, Cy40, and CyA interact with CAV-1 and assemble the caveolin chaperone complex (CCC). The NS1-CCC complex is detached from ER exterior membrane by unknown mechanisms, bypassing the ERES. (D) Cytoplasmic NS1-CCC complex follows the intracellular cholesterol pathway until grasping the inner plasmatic cell membrane, and then hexameric NS1 is released to the extracellular space. NS1 does not interact with LD during trafficking. RC, replication complex; ERGIC, ER-Golgi intermediate compartment.

Similar articles

Cited by

References

    1. Guzman MG, Harris E. 2015. Dengue. Lancet 385:453–465. doi:10.1016/S0140-6736(14)60572-9. - DOI - PubMed
    1. Bhatt S, Gething PW, Brady OJ, Messina JP, Farlow AW, Moyes CL, Drake JM, Brownstein JS, Hoen AG, Sankoh O, Myers MF, George DB, Jaenisch T, Wint GRW, Simmons CP, Scott TW, Farrar JJ, Hay SI. 2013. The global distribution and burden of dengue. Nature 496:504–507. doi:10.1038/nature12060. - DOI - PMC - PubMed
    1. Acosta EG, Kumar A, Bartenschlager R. 2014. Revisiting dengue virus-host cell interaction: new insights into molecular and cellular virology. Adv Virus Res 88:1–109. doi:10.1016/B978-0-12-800098-4.00001-5. - DOI - PubMed
    1. Muller DA, Young PR. 2013. The flavivirus NS1 protein: molecular and structural biology, immunology, role in pathogenesis and application as a diagnostic biomarker. Antiviral Res 98:192–208. doi:10.1016/j.antiviral.2013.03.008. - DOI - PubMed
    1. Akey ADL, Brown WC, Dutta S, Konwerski J, Jose J. 2014. Flavivirus NS1 crystal structures reveal a surface for membrane association and regions of interaction with the immune system. Science 343:1–31. - PMC - PubMed

Publication types

MeSH terms