. 2019 Feb 5;93(4):e01806-18.
doi: 10.1128/JVI.01806-18. Print 2019 Feb 15.

A Human Gain-of-Function STING Mutation Causes Immunodeficiency and Gammaherpesvirus-Induced Pulmonary Fibrosis in Mice

Affiliations

A Human Gain-of-Function STING Mutation Causes Immunodeficiency and Gammaherpesvirus-Induced Pulmonary Fibrosis in Mice

Brock G Bennion et al. J Virol. .

Abstract

We previously generated STING N153S knock-in mice that have a human disease-associated gain-of-function mutation in STING. Patients with this mutation (STING N154S in humans) develop STING-associated vasculopathy with onset in infancy (SAVI), a severe pediatric autoinflammatory disease characterized by pulmonary fibrosis. Since this mutation promotes the upregulation of antiviral type I interferon-stimulated genes (ISGs), we hypothesized that STING N153S knock-in mice may develop more severe autoinflammatory disease in response to a virus challenge. To test this hypothesis, we infected heterozygous STING N153S mice with murine gammaherpesvirus 68 (γHV68). STING N153S mice were highly vulnerable to infection and developed pulmonary fibrosis after infection. In addition to impairing CD8+ T cell responses and humoral immunity, STING N153S also promoted the replication of γHV68 in cultured macrophages. In further support of a combined innate and adaptive immunodeficiency, γHV68 infection was more severe in Rag1-/- STING N153S mice than in Rag1-/- littermate mice, which completely lack adaptive immunity. Thus, a gain-of-function STING mutation creates a combined innate and adaptive immunodeficiency that leads to virus-induced pulmonary fibrosis.IMPORTANCE A variety of human rheumatologic disease-causing mutations have recently been identified. Some of these mutations are found in viral nucleic acid-sensing proteins, but whether viruses can influence the onset or progression of these human diseases is less well understood. One such autoinflammatory disease, called STING-associated vasculopathy with onset in infancy (SAVI), affects children and leads to severe lung disease. We generated mice with a SAVI-associated STING mutation and infected them with γHV68, a common DNA virus that is related to human Epstein-Barr virus. Mice with the human disease-causing STING mutation were more vulnerable to infection than wild-type littermate control animals. Furthermore, the STING mutant mice developed lung fibrosis similar to that of patients with SAVI. These findings reveal that a human STING mutation creates severe immunodeficiency, leading to virus-induced lung disease in mice.

Keywords: MHV68; STING; adaptive immunity; autoimmunity; gammaherpesvirus; innate immunity; pulmonary fibrosis; vasculopathy.


Figures

FIG 1
FIG 1
STING N153S mice are highly vulnerable to viral infections. (A) Kaplan-Meier curve showing 60-day mortality of 25- to 30 week-old STING N153S mice and WT littermates following intraperitoneal inoculation with 106 PFU of γHV68 or PBS (uninfected). Shown are results for 7 to 13 mice per genotype pooled from 3 independent experiments. (B) Kaplan-Meier curve showing mortality rates of 7- to-8-week-old STING N153S, WT littermate, Ifngr1–/–, Rag1–/–, and STING goldenticket (GT) mice that were inoculated intranasally with 2 × 105 PFU of γHV68. Survival was assessed for 60 days after infection. Shown are results for 8 (WT), 9 (STING N153S), 16 (Ifngr1–/–), and 5 (Rag1–/–) mice pooled from at least 2 independent experiments. (C) Viral burdens in the lung on days 4, 8, and 14 after intranasal inoculation of STING N153S mice and WT littermates with 2 × 105 PFU of γHV68. Shown are results for 7 to 9 mice per genotype at each time point from 3 independent experiments. (D) Viral burdens in WT, STING GT, Ifngr1–/–, and Rag1–/– mouse lungs at day 14 after intranasal inoculation with 2 × 105 PFU of γHV68. Shown are results for 8 mice per genotype pooled from at least 2 independent experiments. (E) PFU of γHV68 in the lungs of WT, STING N153S, Rag1–/–, and STING GT animals 14 days after infection with γHV68. Shown are results for 6 to 8 mice per genotype. Data were pooled from at least 2 independent experiments. (F) γHV68 viral burdens in the serum on day 14 after intranasal inoculation of STING N153S mice and WT littermates with 2 × 105 PFU of γHV68. Shown are results for 8 to 9 mice per group, pooled from two independent experiments. The dashed line denotes the limit of sensitivity of the assay. (G) Viral burdens in the spleen on days 4, 8, and 14 after intranasal inoculation of STING N153S mice and WT littermates with 2 × 105 PFU of γHV68. Shown are results for 7 to 9 animals per genotype, pooled from at least 2 independent experiments. The dashed line denotes the limit of sensitivity of the assay. (H) PFU of γHV68 in the spleens of WT and STING N153S mice 14 days after infection with γHV68. Shown are results for 7 to 9 mice per genotype, pooled from at least 2 independent experiments. (I) Kaplan-Meier curve showing mortality rates of 7-to-8 week-old STING N153S, WT littermate, and STING GT mice after subcutaneous inoculation with 102 FFU of WNV. Shown are results for 14 (WT), 8 (STING N153S), and 21 (STING GT) mice. Kaplan-Meier curves (A, B, and I) were analyzed by the log rank test. The data in other panels were analyzed by the unpaired t test (C and H), Kruskal-Wallis test (D), one-way ANOVA (E), or Mann-Whitney test (F and G). All data represent the means ± standard errors of the means of results from at least 2 independent experiments. *, P < 0.05; **, P < 0.01; ***, P < 0.001; ****, P < 0.0001; ns, not significant.
FIG 2
FIG 2
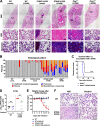
STING N153S mice develop viral pneumonia and pulmonary fibrosis after γHV68 infection. Seven- to 8-week-old mice were intranasally inoculated with 2 × 105 PFU of γHV68 or PBS (mock) and were euthanized at day 14 after infection. Lungs were fixed in 4% PFA, sectioned, and stained with hematoxylin and eosin (H&E) or Gomori's trichrome stain, followed by histological analysis. (A) Representative lung sections from mock-infected and γHV68-infected WT, STING N153S, Rag1–/–, and Ifngr1–/– mice. Sections were stained with H&E (top and center) or trichrome (bottom). Bar, 20 μm. (B) Percentages of ×20 fields of view with the indicated histological patterns (unaffected or small lymphoid aggregates, fibrosis, pneumonia, or mixed). Shown are results for 7 to 9 mice per genotype, pooled from two independent experiments. (C) Kaplan-Meier curves showing 30-day mortality of 11- to 15-week-old Ifnar1−/− STING N153S mice and Ifnar1−/− littermates following intranasal inoculation with 2 × 105 PFU of γHV68. Shown are results for 10 to 14 mice per genotype, pooled from three independent experiments. The curves were analyzed by the log rank test. (D to F) Fourteen days after intranasal inoculation with 2 × 105 PFU of γHV68. Animals received 25 mg/kg of cidofovir or an equivalent volume of vehicle only (PBS) via intraperitoneal injections on days 4, 5, 8, and 11 after infection. (D and E) γHV68 burdens in the lungs of WT or STING N153S animals receiving PBS or cidofovir treatment (D) and percentages of change from starting weight for γHV68-infected WT and STING N153S animals (E). Shown are results for 4 to 7 mice per condition and genotype, pooled from two independent experiments. Data were analyzed by the Mann-Whitney test. *, P < 0.05; **, P < 0.01; ****, P < 0.0001. The dagger indicates that this animal was removed at this time point after meeting euthanasia criteria. (F) Representative ×40 H&E images of sections from WT and STING N153S animals receiving PBS or cidofovir treatment. Bar, 20 μm.
FIG 3
FIG 3
Cytokine and ISG expression levels in WT and STING N153S mouse lung homogenates prior to and during infection with γHV68. (A to E) WT and STING N153S mice were inoculated intranasally with 2 × 105 PFU of γHV68. Animals were euthanized at day 8 or 14 after infection; mock-infected animals were euthanized on day 0. Cytokine and chemokine levels were assessed by a Luminex assay of lung homogenates. Data represent the means ± standard errors of the means of results for 7 to 9 mice per group at each time point, pooled from 2 independent experiments. (F to O) STING N153S and WT littermate control mice were inoculated intranasally with 2 × 105 PFU of γHV68. Animals were euthanized at day 4, 8, or 14 after infection; mock-infected animals were euthanized on day 0. ISG (F to J) and cytokine (K to O) gene expression levels in lung homogenates were assessed by qRT-PCR and are reported as the fold change relative to expression levels for the WT. Results from 6 mice per group at each time point were pooled from 2 independent experiments. All data represent the means ± standard errors of the means from 2 independent experiments. Results were analyzed by the Mann-Whitney test. *, P < 0.05; **, P < 0.01; ***, P < 0.001; ****, P < 0.0001.
FIG 4
FIG 4
CD8+ T cell responses and ISG expression in the spleens of WT and STING N153S mice after γHV68 infection. Mice were inoculated intranasally with 2 × 105 PFU of γHV68 and were sacrificed 14 days after infection. Spleens were harvested and leukocytes isolated for flow cytometric analysis. (A) Total number of CD45+ cells. (B and C) Frequency (B) and number (C) of CD8+ cells in the CD45+ population. (D and E) Frequency (D) and number (E) of ORF6 tetramer-positive CD8+ cells in the CD8+ population. (F to I) Splenocytes were restimulated with the immunodominant ORF6-derived peptide for 4 h. Cells were intracellularly stained and were analyzed for cytokine production via flow cytometry to calculate the frequency (F and H) and numbers (G and I) of restimulated CD8+ T cells producing IFN-γ (F and G) and TNF-α (H and I). Data represent the mean results for 8 to 9 mice per group, pooled from 2 independent experiments. Results for panels A to I were analyzed by an unpaired t test. (J) Splenocytes of uninfected WT and STING N153S mice were analyzed for expression of ISGs by qRT-PCR. Data represent the mean results for 8 to 9 mice per group, pooled from 2 independent experiments. Results were analyzed by the Mann-Whitney test. **, P < 0.01; ***, P < 0.001; ****, P < 0.0001.
FIG 5
FIG 5
Impaired antigen-specific CD8+ T cell responses in the lungs of STING N153S mice infected with γHV68. (A to J) Mice were inoculated intranasally with 2 × 105 PFU of γHV68 and were euthanized 14 days after infection. Lungs were harvested and leukocytes isolated for flow cytometric analysis. (A) Total numbers of CD45+ cells in the lungs of infected WT and STING N153S animals. (B and C) Frequency (B) and number (C) of CD8+ cells in the CD45+ population. (D) Representative FACS plots of ORF6 tetramer-positive and -negative CD8+ T cells in the lungs of WT (left) and STING N153S (right) mice. Numbers indicate the percentage of events in each gate. (E and F) Frequency (E) and number (F) of ORF6 tetramer-positive CD8+ cells in the CD8+ population. (G to J) Lung leukocytes were restimulated with the immunodominant ORF6-derived peptide for 4 h. Cells were intracellularly stained and were analyzed for cytokine production via flow cytometry to calculate the frequency (G and I) and numbers (H and J) of restimulated CD8+ T cells producing IFN-γ (G and H) and TNF-α (I and J). Data represent the means for 8 or 9 mice per group, pooled from two independent experiments. (K to S) Mice were inoculated intranasally with 2 × 105 PFU of γHV68 or PBS (mock) and were euthanized 14 days after infection. (K) Total numbers of CD45+ cells in the lungs of mock-infected WT and STING N153S animals. (L to S) Total numbers of monocytes (L to O), neutrophils (P and Q), and alveolar macrophages (R and S) in the lungs of WT and STING N153S animals. Data represent the means for 4 to 9 mice per group, pooled from at least two independent experiments. Results were analyzed by an unpaired t test. *, P < 0.05; **, P < 0.01; ***, P < 0.001; ****, P < 0.0001.
FIG 6
FIG 6
CD4+ T cells in the spleens and lungs of STING N153S mice. Mice were inoculated intranasally with 2 × 105 PFU of γHV68 or with PBS (mock) and were euthanized 14 days after infection. Splenocytes and pulmonary leukocytes were isolated for flow cytometric analysis. (A and B) Frequency (A) and number (B) of CD4+ cells in the spleens of mock-infected WT and STING N153S animals. (C and D) Frequency (C) and number (D) of CD4+ cells in the spleens of γHV68-infected WT and STING N153S animals. (E and F) Frequency (E) and number (F) of CD4+ cells in the lungs of mock-infected WT and STING N153S animals. (G and H) Frequency (G) and number (H) of CD4+ cells in the lungs of γHV68-infected WT and STING N153S animals. Data represent the means of results for 4 to 9 mice per group, pooled from at least two independent experiments. Results were analyzed by an unpaired t test. *, P < 0.05; **, P < 0.01; ****, P < 0.0001.
FIG 7
FIG 7
B cell numbers and γHV68-specific IgM and IgG levels in WT and STING N153S mice. Mice were inoculated intranasally with 2 × 105 PFU of γHV68 and were euthanized 14 days after infection. Splenocytes and pulmonary leukocytes were isolated for flow cytometric analysis. (A and B) Total numbers of CD19+ cells in the spleens (A) and lungs (B) of STING N153S and WT mice 14 days after infection with γHV68. (C and D) Virus-specific IgM (C) and IgG (D) in the sera of STING N153S and WT mice 14 days after infection with γHV68. Data represent the means of results for 8 to 9 mice per group, pooled from two independent experiments. Results were analyzed by an unpaired t test. ***, P < 0.001; ****, P < 0.0001.
FIG 8
FIG 8
Adoptive transfer of naïve and primed WT CD8+ T cells into Rag1−/− and Rag1−/− STING N153S recipient mice. (A to D) Adoptive transfer of PBS (mock), naïve WT CD8+ T cells, or primed WT CD8+ T cells. Splenocytes were enriched for CD8+ T cells via negative selection, and 5 × 105 CD8+ T cells were retro-orbitally transferred into intranasally infected Rag1–/– or Rag1–/– STING N153S recipients 1 day after inoculation with γHV68. Tissues were harvested 14 days after infection and viral burdens measured by qPCR. (A) Frequency of ORF6 tetramer-positive cells in the CD8+ population of WT donor mouse spleens on day 10 after infection with γHV68. (B) Numbers of ORF6 tetramer-positive CD8+ cells in the lungs of Rag1−/− STING N153S and Rag1−/− mice that received naïve or primed WT CD8+ T cells. Five to six mice per group were used. Data were analyzed by an unpaired t test. (C and D) Viral burdens measured by qPCR in the spleens (C) and lungs (D) of Rag1−/− STING N153S and Rag1−/− mice that received PBS, naïve WT CD8+ T cells, or primed WT CD8+ T cells. Daggers indicate survivor bias. Three to nine mice per group were used. Data were analyzed by the Kruskal-Wallis test. All data represent means pooled from at least 2 independent experiments. *, P < 0.05; **, P < 0.01.
FIG 9
FIG 9
Enhanced replication of γHV68 in STING N153S bone marrow-derived macrophages (BMDMs). (A) Kaplan-Meier curves showing 30-day mortality of 17- to 20-week-old Rag1−/− STING N153S mice and Rag1−/− littermates following intranasal inoculation with 2 × 105 PFU of γHV68. Shown are results for 7 to 10 mice per genotype, pooled from 2 independent experiments. The curves were analyzed by a log rank test. (B) γHV68 viral DNA levels in the spleens of Rag1−/− STING N153S mice and Rag1−/− littermates on day 12 after infection. (C) Multistep growth curve analysis of viral DNA levels in WT and STING N153S BMDMs after infection with γHV68 at an MOI of 0.05. (D) Multistep growth curve analysis of γHV68 in WT and STING N153S BMDMs after infection at an MOI of 0.05. Viral titers were measured by plaque assay with 2 wells per time point in 3 independent experiments. Data in panels C and D were analyzed by 2-way ANOVA. (E) Genome copies of ORF8 from BMDMs 24 h after infection with γHV68 at an MOI of 10. (F to H) ISG expression in WT and STING N153S BMDMs 24 h after infection with γHV68. Data in panels E to H were analyzed by the Mann-Whitney test. (I to L) Flow cytometric analysis and quantitation of total numbers of CD11blo F4/80+ and CD11bhi F4/80+ macrophages in the spleens of uninfected WT and STING N153S mice. All data represent the means for 6 to 12 biological replicates from at least 2 independent experiments. Data in panels B and I to L were analyzed by an unpaired t test. *, P < 0.05; **, P < 0.01; ***, P < 0.001; ****, P < 0.0001.

Similar articles

Cited by

References

    1. Wu J, Sun L, Chen X, Du F, Shi H, Chen C, Chen ZJ. 2013. Cyclic GMP-AMP is an endogenous second messenger in innate immune signaling by cytosolic DNA. Science 339:826–830. doi:10.1126/science.1229963. - DOI - PMC - PubMed
    1. Ishikawa H, Ma Z, Barber GN. 2009. STING regulates intracellular DNA-mediated, type I interferon-dependent innate immunity. Nature 461:788–792. doi:10.1038/nature08476. - DOI - PMC - PubMed
    1. Kobayashi H, Kobayashi CI, Nakamura-Ishizu A, Karigane D, Haeno H, Yamamoto KN, Sato T, Ohteki T, Hayakawa Y, Barber GN, Kurokawa M, Suda T, Takubo K. 2015. Bacterial c-di-GMP affects hematopoietic stem/progenitors and their niches through STING. Cell Rep 11:71–84. doi:10.1016/j.celrep.2015.02.066. - DOI - PubMed
    1. Tanaka Y, Chen ZJ. 2012. STING specifies IRF3 phosphorylation by TBK1 in the cytosolic DNA signaling pathway. Sci Signal 5:ra20. doi:10.1126/scisignal.2002521. - DOI - PMC - PubMed
    1. Ishikawa H, Barber GN. 2008. STING is an endoplasmic reticulum adaptor that facilitates innate immune signaling. Nature 455:674–678. doi:10.1038/nature07317. - DOI - PMC - PubMed

Publication types

MeSH terms