

Brain oxylipin concentrations following hypercapnia/ischemia: effects of brain dissection and dissection time
- PMID: 30463986
- PMCID: PMC6399504
- DOI: 10.1194/jlr.D084228
Brain oxylipin concentrations following hypercapnia/ischemia: effects of brain dissection and dissection time
Abstract
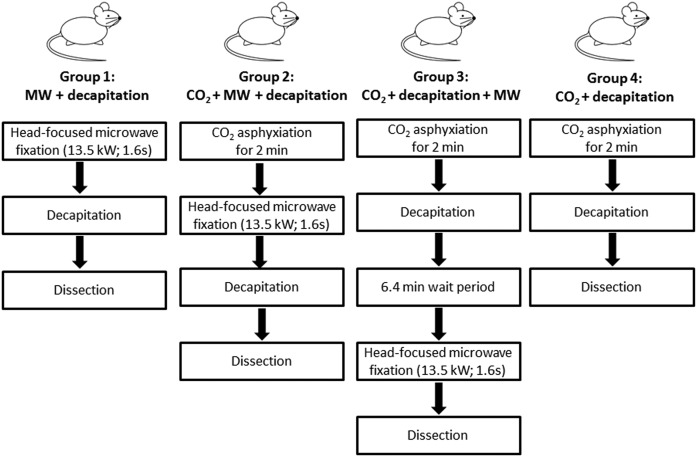
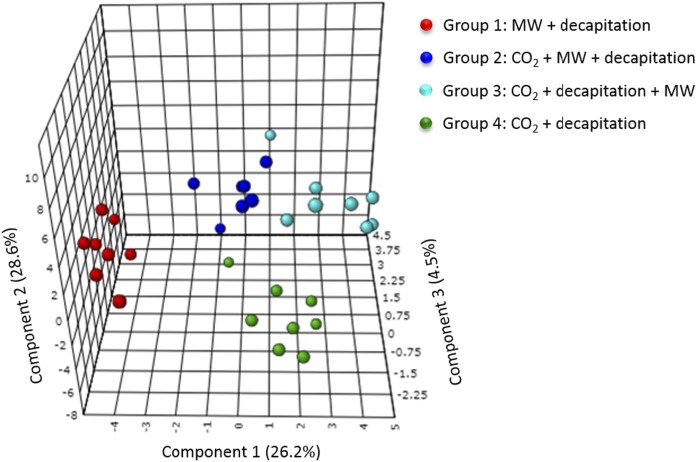
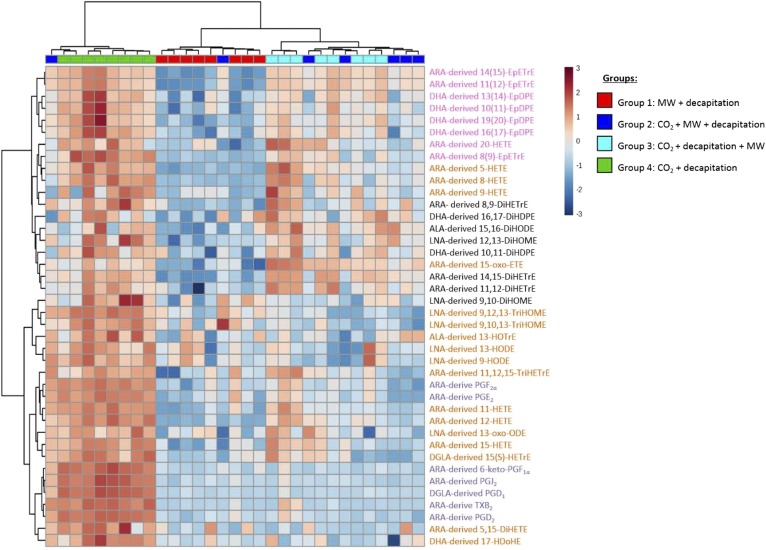
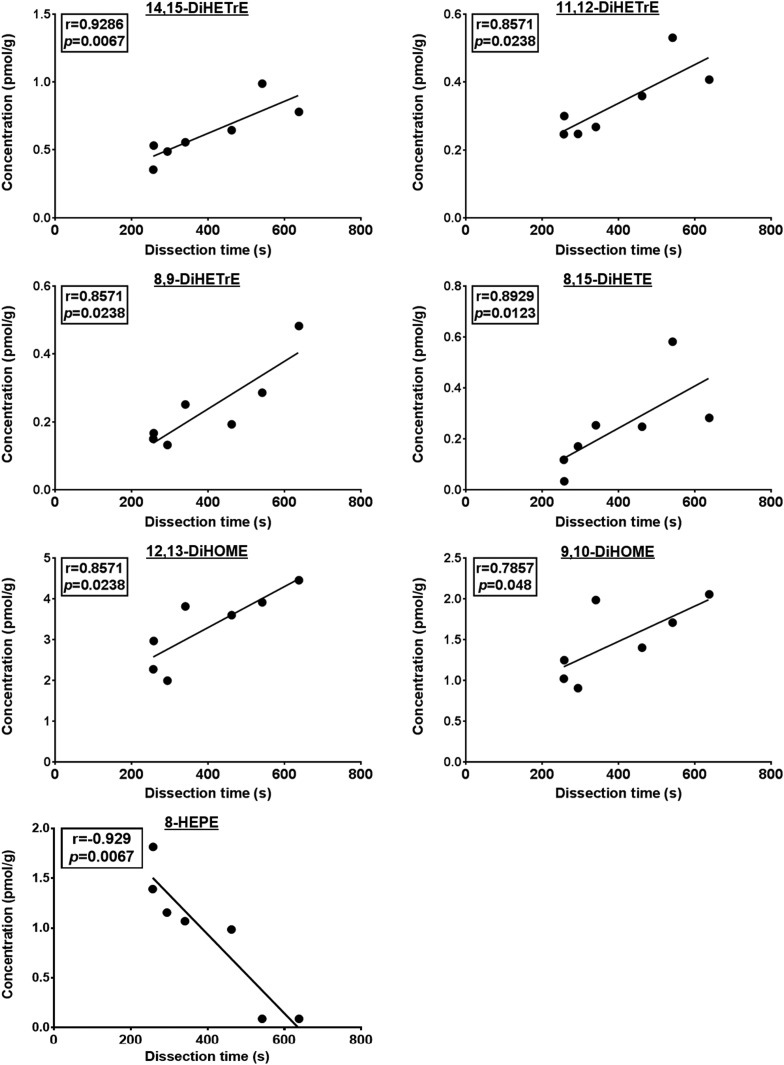
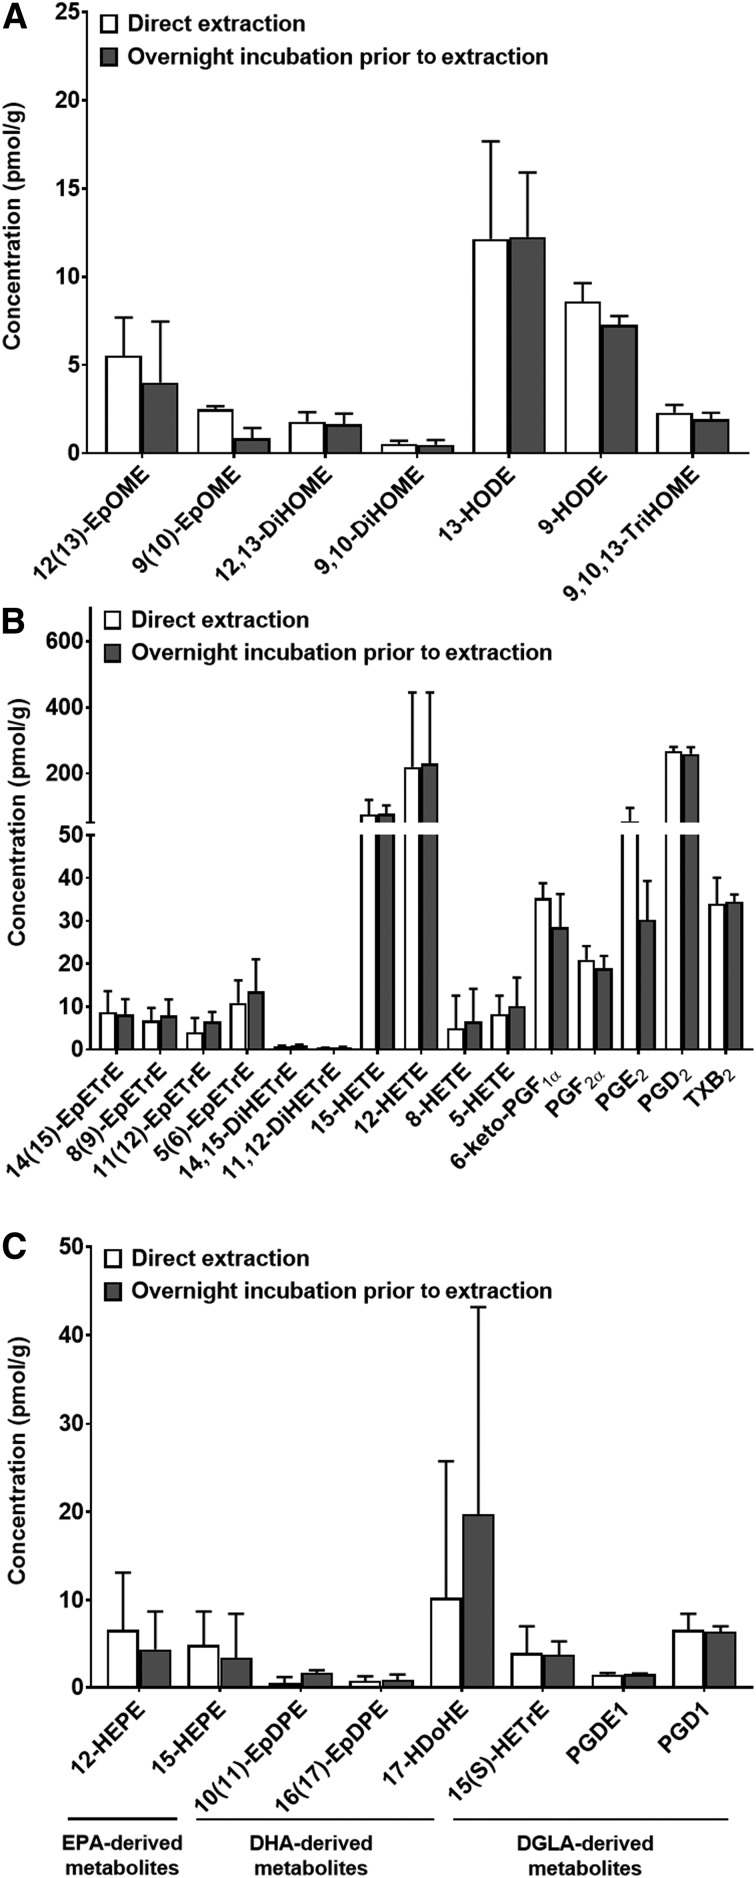
PUFAs are precursors to bioactive oxylipin metabolites that increase in the brain following CO2-induced hypercapnia/ischemia. It is not known whether the brain-dissection process and its duration also alter these metabolites. We applied CO2 with or without head-focused microwave fixation for 2 min to evaluate the effects of CO2-induced asphyxiation, dissection, and dissection time on brain oxylipin concentrations. Compared with head-focused microwave fixation (control), CO2 followed by microwave fixation prior to dissection increased oxylipins derived from lipoxygenase (LOX), 15-hydroxyprostaglandin dehydrogenase (PGDH), cytochrome P450 (CYP), and soluble epoxide hydrolase (sEH) enzymatic pathways. This effect was enhanced when the duration of postmortem ischemia was prolonged by 6.4 min prior to microwave fixation. Brains dissected from rats subjected to CO2 without microwave fixation showed greater increases in LOX, PGDH, CYP and sEH metabolites compared with all other groups, as well as increased cyclooxygenase metabolites. In nonmicrowave-irradiated brains, sEH metabolites and one CYP metabolite correlated positively and negatively with dissection time, respectively. This study presents new evidence that the dissection process and its duration increase brain oxylipin concentrations, and that this is preventable by microwave fixation. When microwave fixation is not available, lipidomic studies should account for dissection time to reduce these artifacts.
Keywords: brain lipids; lipid mediators; polyunsaturated fatty acid metabolites.
Copyright © 2019 Hennebelle et al.
Conflict of interest statement
The authors declare no conflict of interest.
Figures
Similar articles
-
Effects of hypercapnia / ischemia and dissection on the rat brain metabolome.Neurochem Int. 2022 Jun;156:105294. doi: 10.1016/j.neuint.2022.105294. Epub 2022 Jan 31. Neurochem Int. 2022. PMID: 35104537
-
Acute Hypercapnia/Ischemia Alters the Esterification of Arachidonic Acid and Docosahexaenoic Acid Epoxide Metabolites in Rat Brain Neutral Lipids.Lipids. 2020 Jan;55(1):7-22. doi: 10.1002/lipd.12197. Epub 2019 Nov 6. Lipids. 2020. PMID: 31691988 Free PMC article.
-
Fatty acid amide hydrolase (FAAH) regulates hypercapnia/ischemia-induced increases in n-acylethanolamines in mouse brain.J Neurochem. 2017 Sep;142(5):662-671. doi: 10.1111/jnc.14067. Epub 2017 Jul 25. J Neurochem. 2017. PMID: 28488728
-
Advances in Our Understanding of Oxylipins Derived from Dietary PUFAs.Adv Nutr. 2015 Sep 15;6(5):513-40. doi: 10.3945/an.114.007732. Print 2015 Sep. Adv Nutr. 2015. PMID: 26374175 Free PMC article. Review.
-
Epoxy-Oxylipins and Soluble Epoxide Hydrolase Metabolic Pathway as Targets for NSAID-Induced Gastroenteropathy and Inflammation-Associated Carcinogenesis.Front Pharmacol. 2019 Jun 25;10:731. doi: 10.3389/fphar.2019.00731. eCollection 2019. Front Pharmacol. 2019. PMID: 31293429 Free PMC article. Review.
Cited by
-
A Review of Efforts to Improve Lipid Stability during Sample Preparation and Standardization Efforts to Ensure Accuracy in the Reporting of Lipid Measurements.Lipids. 2021 Jan;56(1):3-16. doi: 10.1002/lipd.12263. Epub 2020 Jun 9. Lipids. 2021. PMID: 32519378 Free PMC article. Review.
-
12-Hydroxyeicosatetraenoic acid is the only enzymatically produced HETE increased under brain ischemia.Prostaglandins Leukot Essent Fatty Acids. 2024 Mar;202:102631. doi: 10.1016/j.plefa.2024.102631. Epub 2024 Jul 19. Prostaglandins Leukot Essent Fatty Acids. 2024. PMID: 39059107 Free PMC article.
-
Polyunsaturated fatty acids and fatty acid-derived lipid mediators: Recent advances in the understanding of their biosynthesis, structures, and functions.Prog Lipid Res. 2022 Apr;86:101165. doi: 10.1016/j.plipres.2022.101165. Epub 2022 May 1. Prog Lipid Res. 2022. PMID: 35508275 Free PMC article. Review.
-
Linoleic acid-derived 13-hydroxyoctadecadienoic acid is absorbed and incorporated into rat tissues.Biochim Biophys Acta Mol Cell Biol Lipids. 2021 Mar;1866(3):158870. doi: 10.1016/j.bbalip.2020.158870. Epub 2020 Dec 17. Biochim Biophys Acta Mol Cell Biol Lipids. 2021. PMID: 33340768 Free PMC article.
-
Tissue pretreatment for LC-MS/MS analysis of PUFA and eicosanoid distribution in mouse brain and liver.Anal Bioanal Chem. 2020 Apr;412(10):2211-2223. doi: 10.1007/s00216-019-02170-w. Epub 2019 Dec 21. Anal Bioanal Chem. 2020. PMID: 31865417 Free PMC article.
References
-
- O’Brien J. S., and Sampson E. L.. 1965. Lipid composition of the normal human brain: gray matter, white matter, and myelin. J. Lipid Res. 6: 537–544. - PubMed
-
- Fraser T., Tayler H., and Love S.. 2010. Fatty acid composition of frontal, temporal and parietal neocortex in the normal human brain and in Alzheimer’s disease. Neurochem. Res. 35: 503–513. - PubMed
-
- McNamara R. K., and Carlson S. E.. 2006. Role of omega-3 fatty acids in brain development and function: potential implications for the pathogenesis and prevention of psychopathology. Prostaglandins Leukot. Essent. Fatty Acids. 75: 329–349. - PubMed
Publication types
MeSH terms
Substances
Grants and funding
LinkOut - more resources
Full Text Sources
Miscellaneous
