

High COPD prevalence at high altitude: does household air pollution play a role?
- PMID: 30464013
- PMCID: PMC6428658
- DOI: 10.1183/13993003.01193-2018
High COPD prevalence at high altitude: does household air pollution play a role?
Abstract
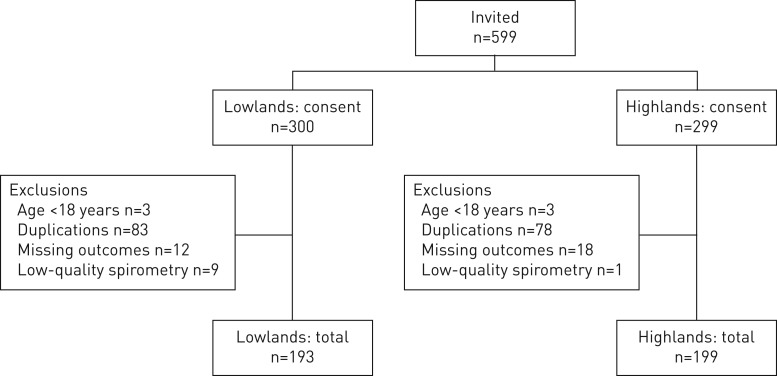
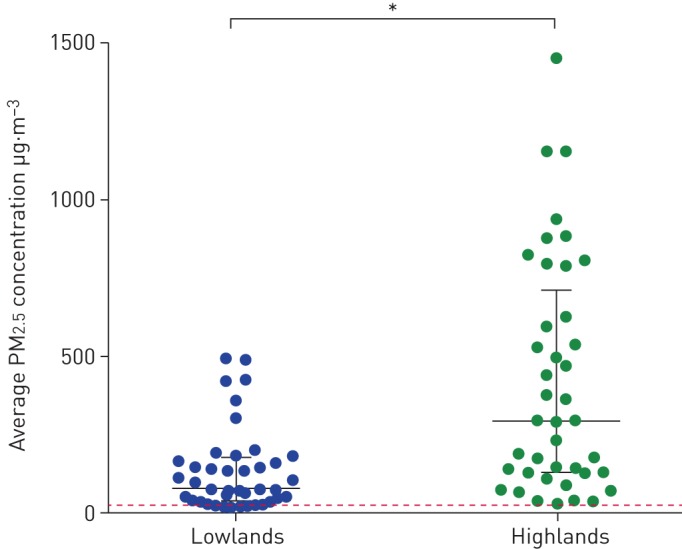
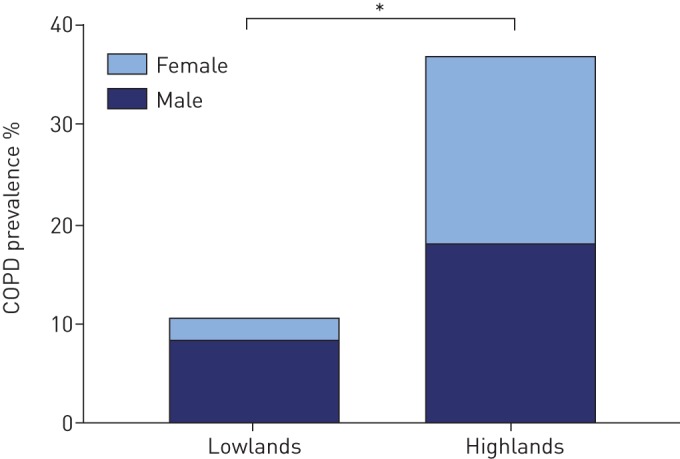
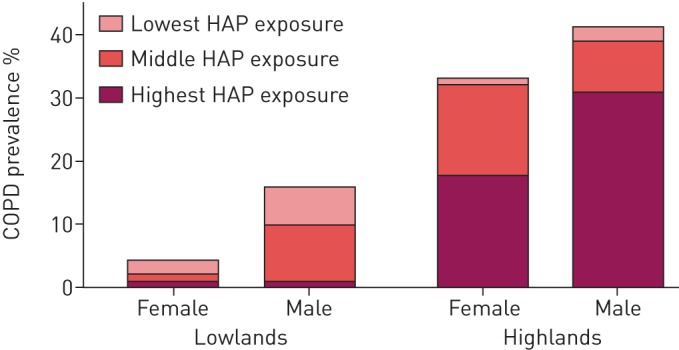
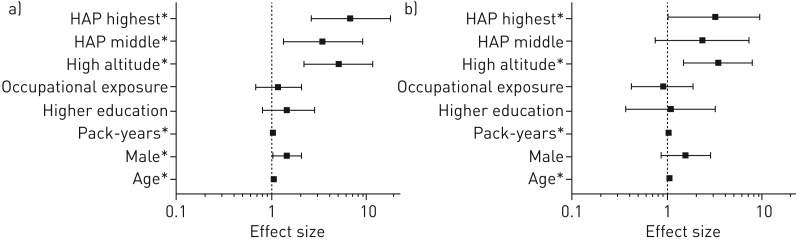
Studies comparing chronic obstructive pulmonary disease (COPD) prevalence across altitudes report conflicting results. However, household air pollution (HAP), a major COPD risk factor, was mostly not accounted for in previous analyses and never objectively measured. We aimed to compare the prevalence of COPD and its risk factors between low-resource highlands and lowlands, with a particular focus on objectively measured HAP.We conducted a population-based, observational study in a highland (∼2050 m above sea level) and a lowland (∼750 m above sea level) setting in rural Kyrgyzstan. We performed spirometry in randomly selected households, measured indoor particulate matter with an aerodynamic diameter <2.5 µm (PM2.5) and administered a questionnaire on other COPD risk factors. Descriptive statistics and multivariable logistic regressions were used for analyses.We included 392 participants: 199 highlanders and 193 lowlanders. COPD was more prevalent among highlanders (36.7% versus 10.4%; p<0.001). Their average PM2.5 exposure was also higher (290.0 versus 72.0 µg·m-3; p<0.001). In addition to high PM2.5 exposure (OR 3.174, 95% CI 1.061-9.493), the altitude setting (OR 3.406, 95% CI 1.483-7.825), pack-years of smoking (OR 1.037, 95% CI 1.005-1.070) and age (OR 1.058, 95% CI 1.037-1.079) also contributed to a higher COPD prevalence among highlanders.COPD prevalence and HAP were highest in the highlands, and were independently associated. Preventive interventions seem warranted in these low-resource, highland settings. With this study being one of the first spirometry-based prevalence studies in Central Asia, generalisability needs to be assessed.
Copyright ©ERS 2019.
Conflict of interest statement
Conflict of interest: E.A. Brakema has nothing to disclose. Conflict of interest: A. Tabyshova has nothing to disclose. Conflict of interest: M.J. Kasteleyn has nothing to disclose. Conflict of interest: E. Molendijk has nothing to disclose. Conflict of interest: R.M.J.J. van der Kleij has nothing to disclose. Conflict of interest: J.F.M. van Boven has nothing to disclose. Conflict of interest: B. Emilov has nothing to disclose. Conflict of interest: M. Akmatalieva has nothing to disclose. Conflict of interest: M. Mademilov has nothing to disclose. Conflict of interest: M.E. Numans has nothing to disclose. Conflict of interest: S. Williams has nothing to disclose. Conflict of interest: T. Sooronbaev has nothing to disclose. Conflict of interest: N.H. Chavannes has nothing to disclose.
Figures
Comment in
-
Household air pollution as an important factor in the complex relationship between altitude and COPD.Eur Respir J. 2019 Feb 7;53(2):1802454. doi: 10.1183/13993003.02454-2018. Print 2019 Feb. Eur Respir J. 2019. PMID: 30759422 No abstract available.
References
-
- Institute for Health Metrics and Evaluation. GBD compare data visualization 2016. http://vizhub.healthdata.org/gbd-compare Date last accessed: April 4, 2018.
-
- GBD Chronic Respiratory Disease Collaborators. Global, regional, and national deaths, prevalence, disability-adjusted life years, and years lived with disability for chronic obstructive pulmonary disease and asthma, 1990–2015: a systematic analysis for the Global Burden of Disease Study 2015. Lancet Respir Med 2017; 5: 691–706. - PMC - PubMed
-
- World Health Organization. Chronic obstructive pulmonary disease (COPD) 2016. www.who.int/mediacentre/factsheets/fs315/en Date last accessed: April 4, 2018.
-
- Khakban A, Sin DD, FitzGerald JM, et al. . Ten-year trends in direct costs of COPD: a population-based study. Chest 2015; 148: 640–646. - PubMed
Publication types
MeSH terms
Substances
LinkOut - more resources
Full Text Sources
Medical