. 2019 Jan;31(1):231-249.
doi: 10.1105/tpc.18.00512. Epub 2018 Nov 21.

PAPST2 Plays Critical Roles in Removing the Stress Signaling Molecule 3'-Phosphoadenosine 5'-Phosphate from the Cytosol and Its Subsequent Degradation in Plastids and Mitochondria

Affiliations

PAPST2 Plays Critical Roles in Removing the Stress Signaling Molecule 3'-Phosphoadenosine 5'-Phosphate from the Cytosol and Its Subsequent Degradation in Plastids and Mitochondria

Natallia Ashykhmina et al. Plant Cell. 2019 Jan.

Abstract

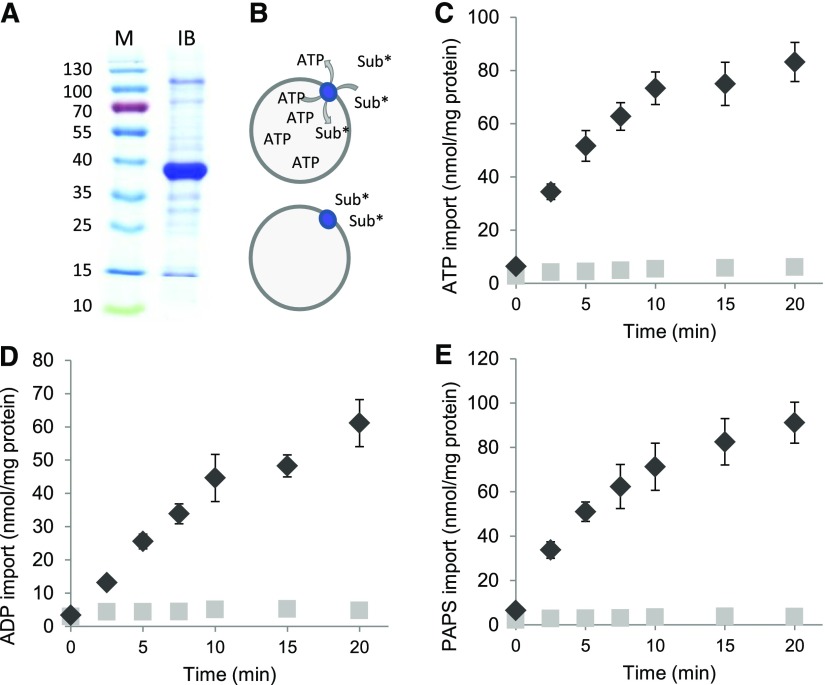
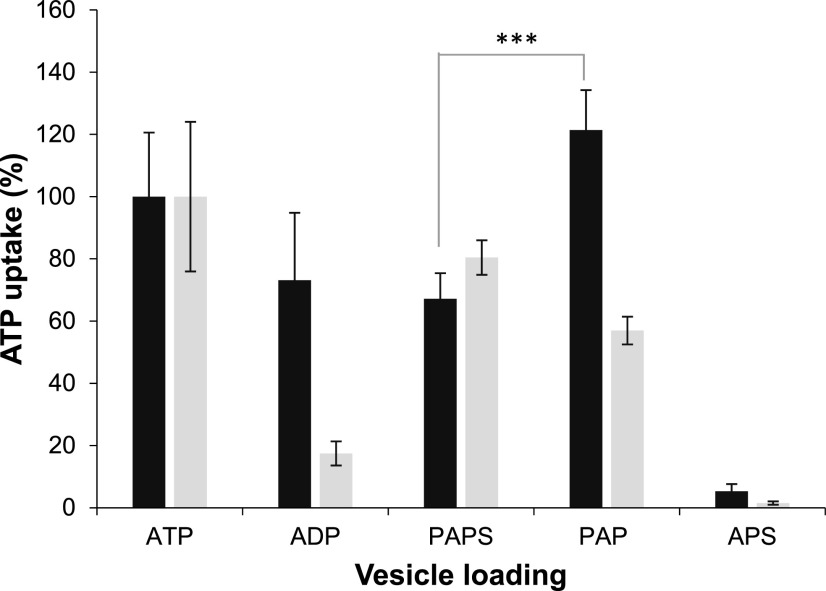
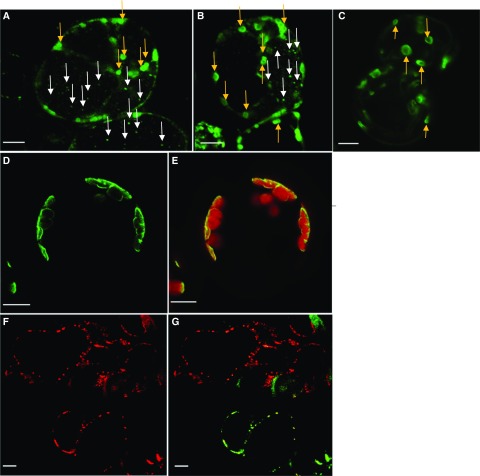
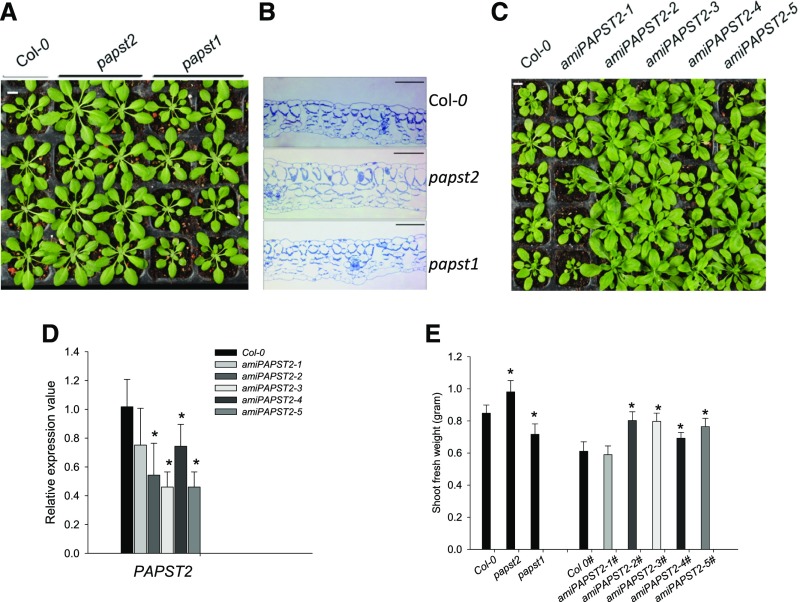
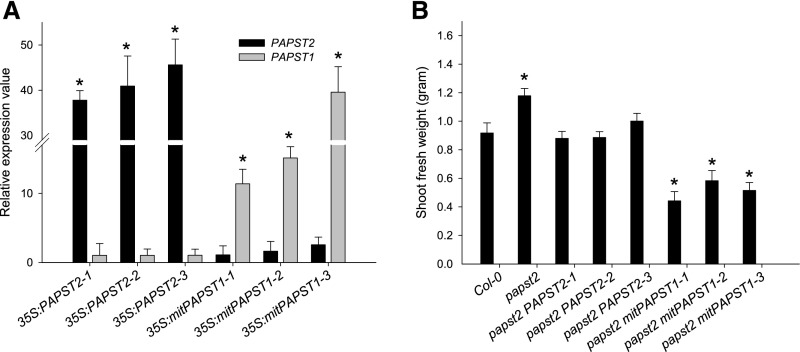
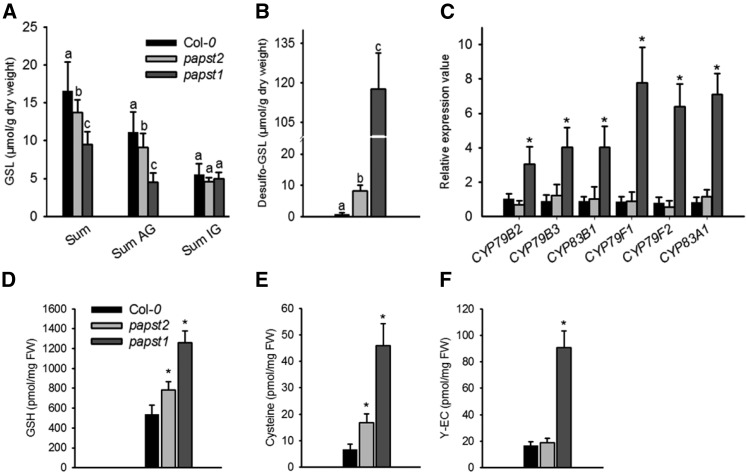
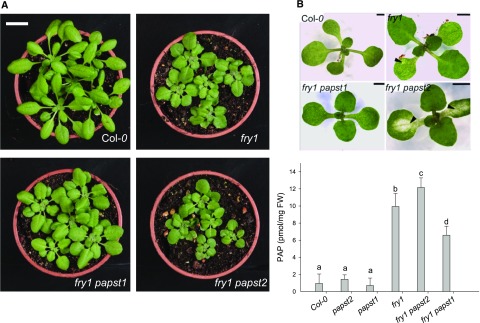
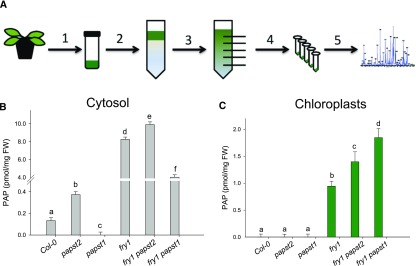
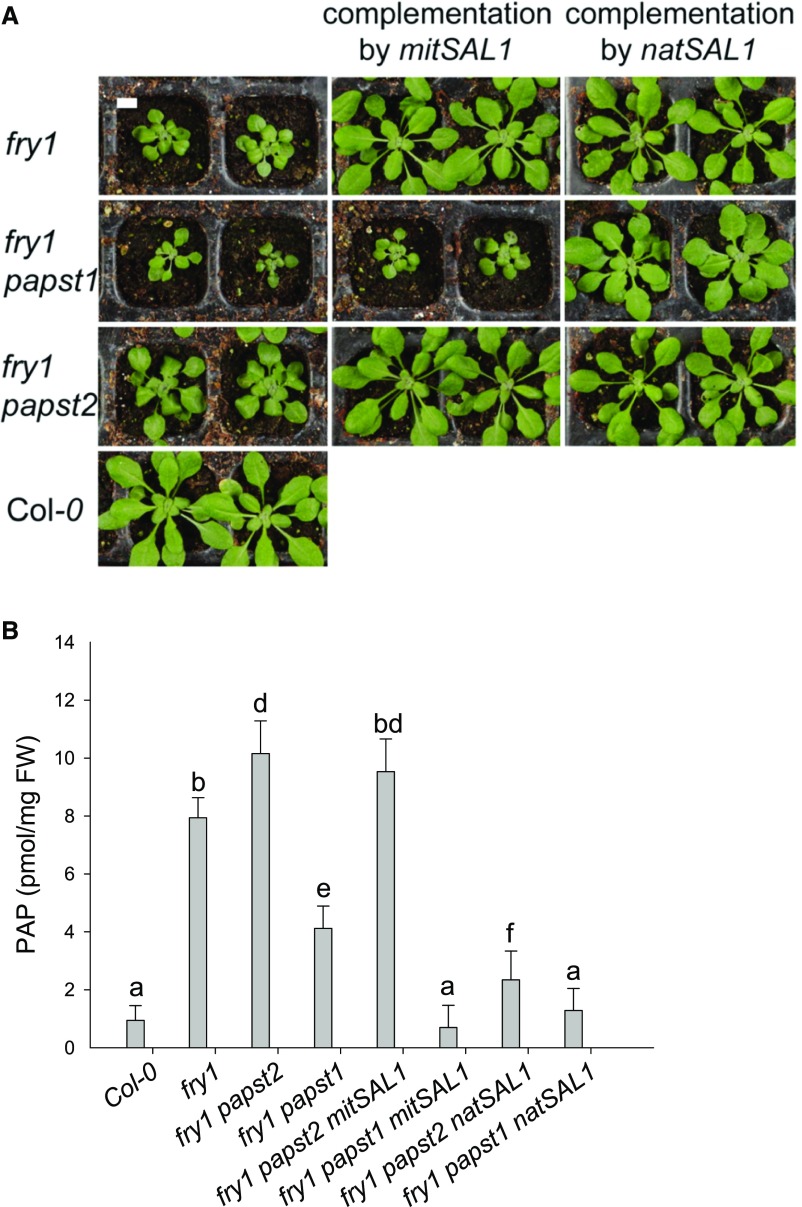
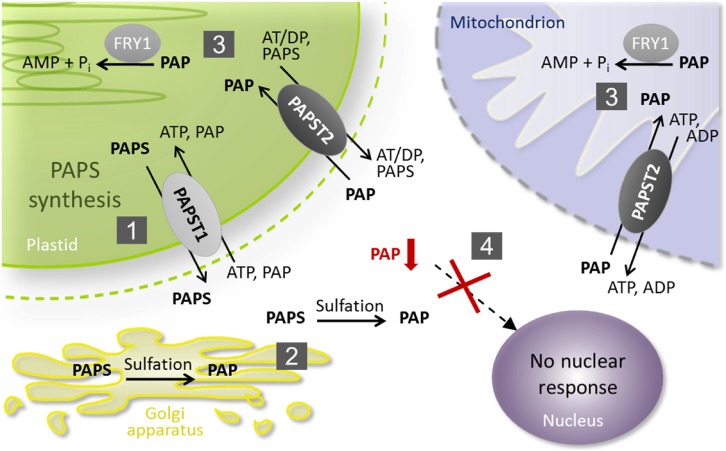
The compartmentalization of PAPS (the sulfate donor 3'-phosphoadenosine 5'-phosphosulfate) synthesis (mainly in plastids), PAPS consumption (in the cytosol), and PAP (the stress signaling molecule 3'-phosphoadenosine 5'-phosphate) degradation (in plastids and mitochondria) requires organellar transport systems for both PAPS and PAP. The plastidial transporter PAPST1 (PAPS TRANSPORTER1) delivers newly synthesized PAPS from the stroma to the cytosol. We investigated the activity of PAPST2, the closest homolog of PAPST1, which unlike PAPST1 is targeted to both the plastids and mitochondria. Biochemical characterization in Arabidopsis thaliana revealed that PAPST2 mediates the antiport of PAP, PAPS, ATP, and ADP. Strongly increased cellular PAP levels negatively affect plant growth, as observed in the fry1 papst2 mutant, which lacks the PAP-catabolizing enzyme SALT TOLERANCE 1 and PAPST2. PAP levels were specifically elevated in the cytosol of papst2 and fiery1 papst2, but not in papst1 or fry1 papst1 PAPST1 failed to complement the papst2 mutant phenotype in mitochondria, because it likely removes PAPS from the cell, as demonstrated by the increased expression of phytosulfokine genes. Overexpression of SAL1 in mitochondria rescued the phenotype of fry1 but not fry1 papst2 Therefore, PAPST2 represents an important organellar importer of PAP, providing a piece of the puzzle in our understanding of the organelle-to-nucleus PAP retrograde signaling pathway.


Figures

Figure 1.
Figure 1.
Purified, Reconstituted PAPST2 Mediates Time-Dependent ATP, ADP, and PAPS Uptake. (A) SDS-PAGE of the purified inclusion body proteins (5 µg) used for reconstitution. Recombinant PAPST2 has a calculated molecular weight of ∼40 kD. Approximate molecular weights (in kDa) are shown on the left. IB, purified inclusion body proteins; M, pre-stained molecular weight marker (Thermo Fisher). (B) Illustration displaying the transport of radiolabeled substrate (Sub*) into ATP-loaded liposomes with reconstituted PAPST2 (blue circle). No transport occurs into nonloaded vesicles. Time-dependent import of 50 µM [α32P]ATP (C), [α32P]ADP (D), [35S]PAPS (E) by the purified and reconstituted PAPST2 protein into liposomes loaded with 5 mM ATP (black diamonds) or buffer alone (light gray squares) nonloaded, negative control. Data are the mean of three independent experiments; standard errors are given.
Figure 2.
Figure 2.
PAPST2 and PAPST1 Mediate Uptake of [α32P]ATP into Differently Loaded Liposomes. Import of 50 µM [α32P]-ATP into PAPST2 (dark gray bars) or PAPST1 (light gray bars; data from Gigolashvili et al., 2012) liposomes loaded with 5 mM of the indicated substrates or into liposomes containing APS. Uptake was stopped at 2.5 min. The data represent net values (minus control values, nonloaded proteoliposomes). Homo-exchange (ATP/ATP transport) was set to 100% and transport into the remaining liposomes was calculated accordingly. Data are the mean of three independent experiments; standard errors are displayed. Asterisks indicate significant difference (Student´s two-tailed t test, P < 0.01).
Figure 3.
Figure 3.
Subcellular Localization of PAPST2 Observed by Confocal Fluorescence Microscopy. (A) and (B) Transient expression of the PAPST2-GFP fusion protein under the control of the 35S CaMV promoter in Arabidopsis suspension cells derived from roots (Berger et al., 2007). (A) and (B) show two independent experiments performed using the same cell culture. The green fluorescence labels plastids (green dots— indicated with yellow arrows) and mitochondria (tiny dots—indicated with white arrows). (C) Localization of triosephosphate/phosphate translocator -GFP—a positive control for plastids (Gigolashvili et al., 2009, 2012). (D) and (E) PAPST2-GFP under the control of the 35S CaMV promoter in Arabidopsis mesophyll protoplasts; the green fluorescence surrounds the red autofluorescence of the chloroplasts. (F) and (G) Co-localization of mitochondrial HSP90 protein fused to mCHERRY with the PAPST2-GFP fusion protein driven by the PAPST2 promoter in Arabidopsis dark-grown suspension cells derived from mesophyll cells. (F) Red fluorescence of the mitochondrial HSP90-mCHERRY. (G) Co-expression of PAPST2-GFP driven by the PAPST2 promoter (green) with the mitochondrial HSP90-mCHERRY (red). Cells co-expressing both constructs are shown in yellow. Red, green, and yellow dots label mitochondria. (A) to (G) Bars = 10 µm.
Figure 4.
Figure 4.
Phenotypes of the papst2 T-DNA Insertion Mutant and amiRNA Lines. (A) The papst2 T-DNA insertion line shows larger rosettes than the wild type (Col-0) and papst1 mutant. Bar = 1 cm. (B) Anatomical cross-sections of rosette leaves of papst2 compared with the wild type (Col-0) and papst1 showing increased cell size in the papst2 mutant. Bar = 100 µm. (C) Phenotype of amiPAPST2 plants. The larger growth phenotype depends on the reduction in PAPST2 transcript level. The amiRNA lines 1 and 4 resemble the wild type. Plants with highest reduction in PAPST2 transcript levels (lines 2, 3, and 5) exhibit larger rosettes than the wild type. Bar = 1 cm. (D) Determination of the PAPST2 transcript level in 5-week-old amiRNA lines by quantitative RT-PCR. Relative gene expression values are normalized to the wild type (set to 1). Data show means ±sd, (n = 3). Asterisks indicate significant differences compared with the wild-type Col-0 (Student´s t test, P < 0.05). Both papst2 and amiPAPST2 plants were grown in soil under short day conditions for approximately four weeks. (E) Shoot fresh weight of papst2 knockout and amiPAPST2 plants. Plants were grown for 5 weeks in soil under a short day light cycle in a controlled environmental chamber. Data show means ±sd (n = 9). The amiPAPST2 plants were cultivated in different growth chambers (marked with #) from papst2 and had their own Col-0 control. Asterisks indicate significant differences compared with the respective wild types (Student´s t test, P < 0.05).
Figure 5.
Figure 5.
Complementation of papst2 by PAPST1 and PAPST2. (A) Expression of PAPST2 and PAPST1 in papst2 lines complemented by 35S:PAPST2 or 35S:mitPAPST1. PAPST2 and PAPST1 transcript levels in rosette leaves of 5-week-old mutant plants were determined by quantitative RT-PCR. Relative gene expression values are given compared with the wild type Col-0 = 1. Data show means ±sd (n = 3). (B) Shoot fresh weight of the wild type, papst2, and complemented transgenic plants overexpressing PAPST2 and mitPAPST1. Plants were grown for 5 weeks in soil under a short day light period in a controlled environmental chamber. Data show means ±sd (n = 7). Asterisks in (A) and (B) indicate significant differences compared with the wild-type Col-0 (Student´s t test, P < 0.05).
Figure 6.
Figure 6.
Glucosinolate Biosynthesis and Sulfate Assimilation Are Slightly Affected in papst2. (A) Glucosinolate contents (µmol/mg dry weight) in papst2 plants relative to wild-type plants (Col-0) and the papst1 T-DNA insertion line. (B) Desulfo-glucosinolates (µmol/mg dry weight) contents in papst2 compared with wild-type plants (Col-0) and the papst1 T-DNA insertion line. AG = aliphatic glucosinolates; GSL = glucosinolates; IG = indolic glucosinolates. The data are the sums of three independent biological replicates (independently grown plant trays), with GSLs isolated from six individual plants from each. Statistical analysis performed with ANOVA, Tukey’s test (Supplemental Data Set). Different letters indicate significant differences at P < 0.05. (C) Glucosinolate biosynthesis gene expression is affected in papst1 but not in the papst2 T-DNA insertion line. Relative gene expression values are given compared with the wild type Col-0 = 1. Data show means ±sd, (n = 3). Asterisks indicate significant differences compared with the wild-type Col-0 (Student´s t test, P < 0.05). (D-F) Glutathione = GSH (D), Cys (E), and γ-glutamylcysteine or γ-EC (F) levels were determined in 4-week-olds as described in Methods and were compared with those of papst1. The data are the sums of two independent experiments, with five biological replicates. Asterisk indicates significant difference compared with the wild type (Col-0; Student’s t test, P < 0.05). FW = fresh weight.
Figure 7.
Figure 7.
The fry1 Phenotype Is Alleviated by the Absence of PAPST1 and Worsened by the Absence of PAPST2. Phenotypes of fry1 papst1 and the fry1 papst2 double mutant lines compared with the wild-type plants and the fry1 mutant. Plants were grown in soil under short-day conditions. (A) Adult plants (age: 5 weeks). Bar = 2 cm. (B) Young seedlings (age: 1 week). Arrows in fry1 papst2 indicate bleaching along the veins of cotyledons. Note fry1 has only slightly more pale areas in cotyledons than the wild-type (Col-0). Bar = 2 mm. (C) PAP levels in mutants with impaired PAPS and PAP transport. PAP levels in papst2, papst1, fry1 papst2, and fry1 papst1 mutants compared with those of the wild type and fry1. Results represent the means of two independent cultivations and eight biological replicates; and results were analyzed via ANOVA and Tukey’s test (Supplemental Data Set). Error bars indicate the ±sd of the mean. Different letters indicate significant differences at P < 0.05. Plants were grown in soil under short-day conditions for five weeks. FW = fresh weight.
Figure 8.
Figure 8.
Concentrations of PAP in the Cytosol and Chloroplasts of papst1, papst2, fry1, fry1 papst1, and fry1 papst2 Mutants Compared with the Wild Type, as Detected by NAF. Workflow for NAF of plant extracts. (A) PAP concentrations in the cytosol (B) and chloroplasts (C) of papst1, papst2, fry1, fry1 papst1, and fry1 papst2 calculated based on the relative subcellular distribution of PAP and the respective absolute values. Data show means from three pools of plants (6 g fresh weight each) grown in two independent experiments. Error bars indicate the SD of the mean. Different letters indicate significant differences among means based on t tests at P < 0.05. FW = fresh weight; PAP, 3′-phosphoadenosine 5′-phosphate.
Figure 9.
Figure 9.
FRY1 Exclusively Targeted to Mitochondria Cannot Complement the fry1 papst2 Mutant Phenotype. The fry1 papst2 and fry1 papst1 mutants express either mitochondrial (mitSAL1) or dually targeted FRY1 (natSAL1). Plants were grown in soil under short-day conditions for four weeks before analysis. (A). Plant phenotypes. Bar = 1 cm. (B). PAP concentrations. The data are the sums of two independent experiments, with five biological replicates each. They were analyzed via ANOVA and Tukey’s test (Supplemental Data Set). Error bars indicate the sd of the mean. Different letters indicate significant differences at P < 0.05. FW = fresh weight.
Figure 10.
Figure 10.
Schematic Illustration of PAP Metabolism and Transport. (1) PAPST1 is the major transporter that delivers newly synthesized PAPS from the plastid to the cytosol. (2) In the cytosol and the Golgi apparatus, PAPS consumption via sulfotransferases results in PAP release. (3) PAPST2 is the major transporter that imports cytosolic PAP into mitochondria and plastids, where it becomes degraded via FRY1. (4) The concerted interaction between PAP production, transport, and degradation prevents cytosolic PAP accumulation (marked in red), the associated nuclear responses, and phenotypic symptoms.

Comment in

Similar articles

Cited by

References

    1. Amano Y., Tsubouchi H., Shinohara H., Ogawa M., Matsubayashi Y. (2007). Tyrosine-sulfated glycopeptide involved in cellular proliferation and expansion in Arabidopsis. Proc. Natl. Acad. Sci. USA 104: 18333–18338. - PMC - PubMed
    1. Aubry S., Smith-Unna R.D., Boursnell C.M., Kopriva S., Hibberd J.M. (2014). Transcript residency on ribosomes reveals a key role for the Arabidopsis thaliana bundle sheath in sulfur and glucosinolate metabolism. Plant J. 78: 659–673. - PubMed
    1. Berger B., Stracke R., Yatusevich R., Weisshaar B., Flügge U.I., Gigolashvili T. (2007). A simplified method for the analysis of transcription factor-promoter interactions that allows high-throughput data generation. Plant J. 50: 911–916. - PubMed
    1. Bodén M., Hawkins J. (2005). Prediction of subcellular localization using sequence-biased recurrent networks. Bioinformatics 21: 2279–2286. - PubMed
    1. Bonaventure G., Gfeller A., Rodríguez V.M., Armand F., Farmer E.E. (2007). The fou2 gain-of-function allele and the wild-type allele of Two Pore Channel 1 contribute to different extents or by different mechanisms to defense gene expression in Arabidopsis. Plant Cell Physiol. 48: 1775–1789. - PubMed

Publication types

MeSH terms

Substances