

Metabolic cost underlies task-dependent variations in motor unit recruitment
- PMID: 30464057
- PMCID: PMC6283986
- DOI: 10.1098/rsif.2018.0541
Metabolic cost underlies task-dependent variations in motor unit recruitment
Abstract
Mammalian skeletal muscles are comprised of many motor units, each containing a group of muscle fibres that have common contractile properties: these can be broadly categorized as slow and fast twitch muscle fibres. Motor units are typically recruited in an orderly fashion following the 'size principle', in which slower motor units would be recruited for low intensity contraction; a metabolically cheap and fatigue-resistant strategy. However, this recruitment strategy poses a mechanical paradox for fast, low intensity contractions, in which the recruitment of slower fibres, as predicted by the size principle, would be metabolically more costly than the recruitment of faster fibres that are more efficient at higher contraction speeds. Hence, it would be mechanically and metabolically more effective for recruitment strategies to vary in response to contraction speed so that the intrinsic efficiencies and contraction speeds of the recruited muscle fibres are matched to the mechanical demands of the task. In this study, we evaluated the effectiveness of a novel, mixed cost function within a musculoskeletal simulation, which includes the metabolic cost of contraction, to predict the recruitment of different muscle fibre types across a range of loads and speeds. Our results show that a metabolically informed cost function predicts favoured recruitment of slower muscle fibres for slower and isometric tasks versus recruitment that favours faster muscles fibres for higher velocity contractions. This cost function predicts a change in recruitment patterns consistent with experimental observations, and also predicts a less expensive metabolic cost for these muscle contractions regardless of speed of the movement. Hence, our findings support the premise that varying motor recruitment strategies to match the mechanical demands of a movement task results in a mechanically and metabolically sensible way to deploy the different types of motor unit.
Keywords: motor recruitment; motor units; muscles; musculoskeletal modelling.
© 2018 The Author(s).
Conflict of interest statement
We declare we have no competing interests
Figures
 ) and (b) min-activation (
 ). (Online version in colour.)
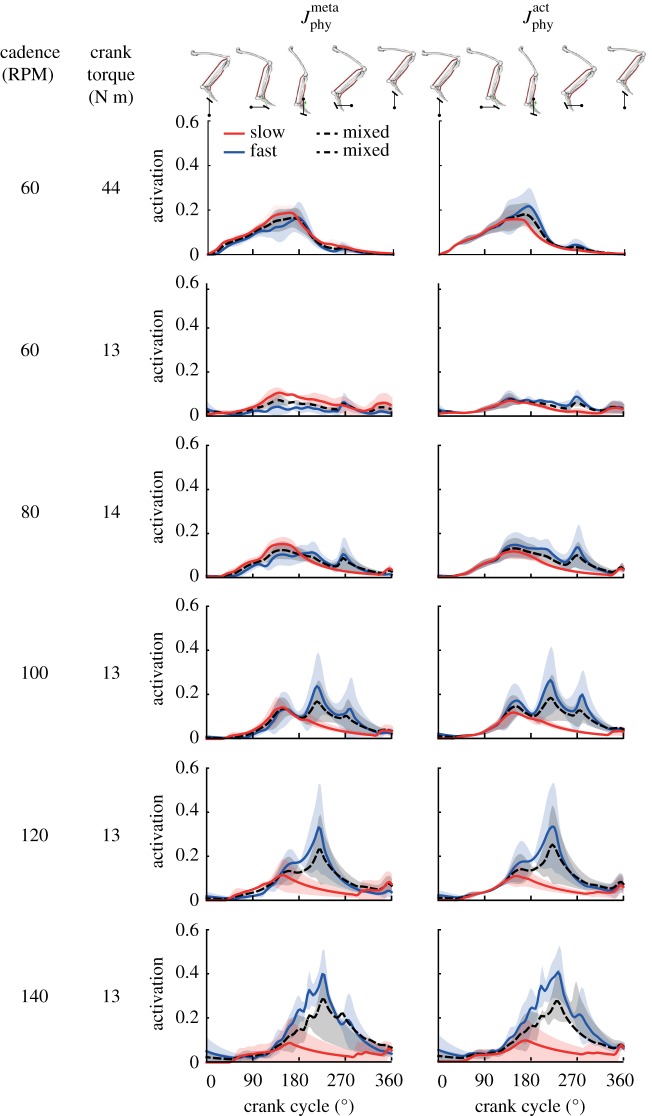
 ) (left) and min-activations (
 ) (right)) were used. (Online version in colour.)
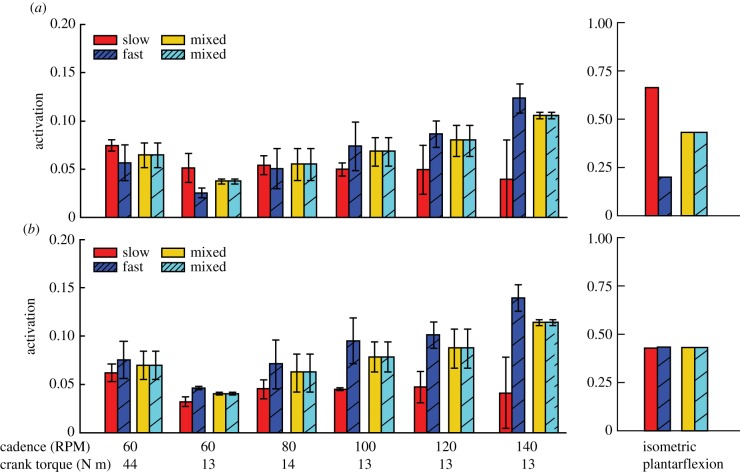
 ) and (b) min-activations (
 )) were used. Note that the mixed–mixed plantarflexor fibre combination (yellow and cyan bars) was predicted in separate simulations to the slow and fast (red and blue bars) plantarflexor fibre combination. (Online version in colour.)
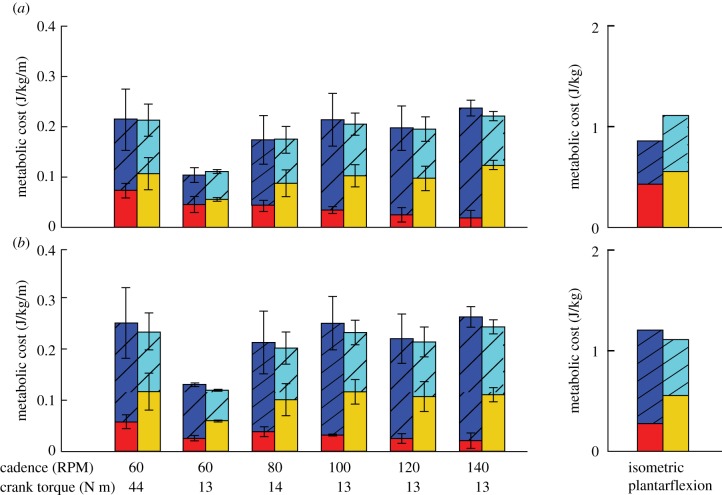
 ) and (b) min-activations (
 )) were used. Metabolic cost was normalized by the mass of the musculoskeletal model and the rotational distance travelled by the pedal around the crank centre over one crank cycle. (Online version in colour.)
Similar articles
-
Task-dependent recruitment across ankle extensor muscles and between mechanical demands is driven by the metabolic cost of muscle contraction.J R Soc Interface. 2021 Jan;18(174):20200765. doi: 10.1098/rsif.2020.0765. Epub 2021 Jan 6. J R Soc Interface. 2021. PMID: 33402020 Free PMC article.
-
Motor unit recruitment for dynamic tasks: current understanding and future directions.J Comp Physiol B. 2009 Jan;179(1):57-66. doi: 10.1007/s00360-008-0289-1. Epub 2008 Jul 3. J Comp Physiol B. 2009. PMID: 18597095 Review.
-
Motor units are recruited in a task-dependent fashion during locomotion.J Exp Biol. 2004 Oct;207(Pt 22):3883-90. doi: 10.1242/jeb.01223. J Exp Biol. 2004. PMID: 15472019
-
Activation of type-identified motor units during centrally evoked contractions in the cat medial gastrocnemius muscle. I. Motor-unit recruitment.J Neurophysiol. 1996 Jan;75(1):26-37. doi: 10.1152/jn.1996.75.1.26. J Neurophysiol. 1996. PMID: 8822539
-
Can fast-twitch muscle fibres be selectively recruited during lengthening contractions? Review and applications to sport movements.Sports Biomech. 2008 Jan;7(1):137-57. doi: 10.1080/14763140701683023. Sports Biomech. 2008. PMID: 18341141 Review.
Cited by
-
Modeling muscle function using experimentally determined subject-specific muscle properties.J Biomech. 2021 Mar 5;117:110242. doi: 10.1016/j.jbiomech.2021.110242. Epub 2021 Jan 15. J Biomech. 2021. PMID: 33545605 Free PMC article.
-
Using physiologically based models to predict in vivo skeletal muscle energetics.J Exp Biol. 2025 Apr 1;228(7):jeb249966. doi: 10.1242/jeb.249966. Epub 2025 Mar 31. J Exp Biol. 2025. PMID: 39960312 Free PMC article.
-
OpenSim Moco: Musculoskeletal optimal control.PLoS Comput Biol. 2020 Dec 28;16(12):e1008493. doi: 10.1371/journal.pcbi.1008493. eCollection 2020 Dec. PLoS Comput Biol. 2020. PMID: 33370252 Free PMC article.
-
Age-related differences in calf muscle recruitment strategies in the time-frequency domain during walking as a function of task demand.J Appl Physiol (1985). 2021 Oct 1;131(4):1348-1360. doi: 10.1152/japplphysiol.00262.2021. Epub 2021 Sep 2. J Appl Physiol (1985). 2021. PMID: 34473576 Free PMC article.
-
Task-dependent recruitment across ankle extensor muscles and between mechanical demands is driven by the metabolic cost of muscle contraction.J R Soc Interface. 2021 Jan;18(174):20200765. doi: 10.1098/rsif.2020.0765. Epub 2021 Jan 6. J R Soc Interface. 2021. PMID: 33402020 Free PMC article.
References
Publication types
MeSH terms
Grants and funding
LinkOut - more resources
Full Text Sources
