. 2018 Nov 21;8(1):17184.
doi: 10.1038/s41598-018-35562-6.

Optical coherence tomography angiography analysis of changes in the retina and the choroid after haemodialysis

Affiliations

Optical coherence tomography angiography analysis of changes in the retina and the choroid after haemodialysis

Yong Un Shin et al. Sci Rep. .

Abstract

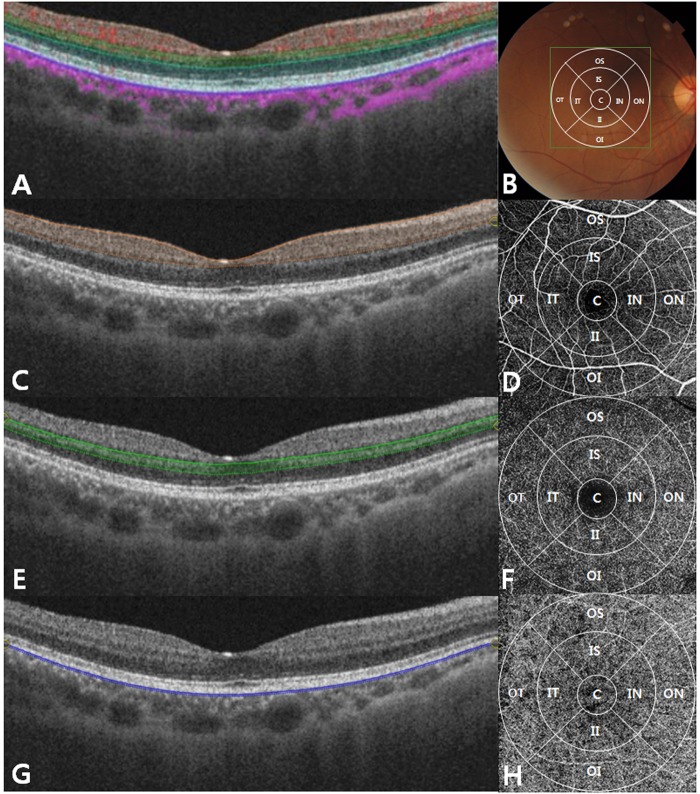
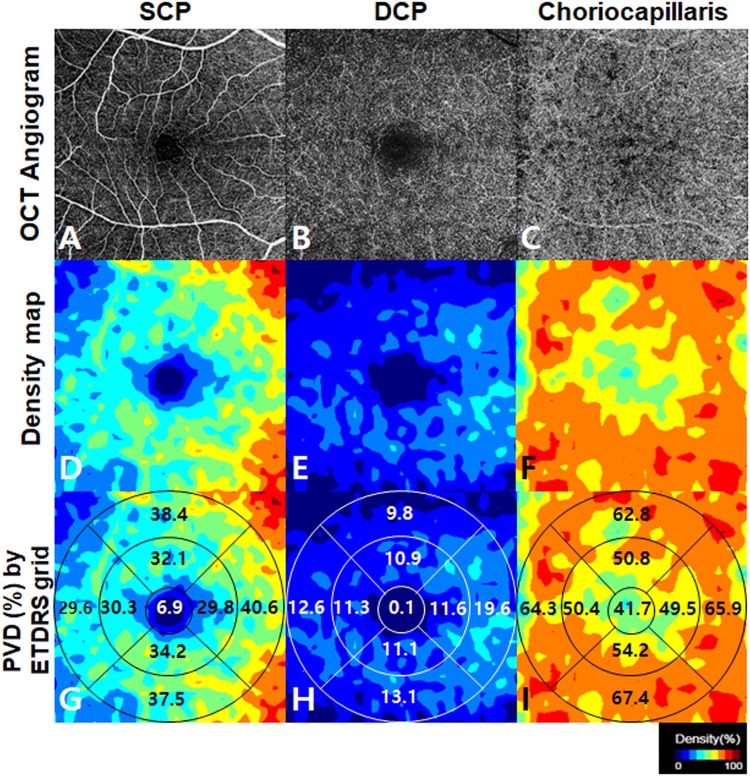
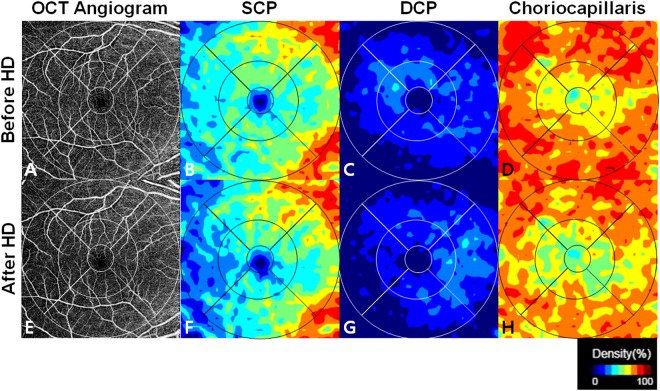
The purpose of this study is to evaluate the effect of haemodialysis on perfused vessel density, choroidal thickness (CT), and retinal thickness in end-stage renal disease (ESRD) using swept-source optical coherence tomography angiography (SS-OCTA). We studied twenty-nine eyes of 29 ESRD patients by ophthalmologic examination and SS-OCTA before and after haemodialysis. The colour-coded perfusion density maps were generated and perfused vessel density was calculated. Changes in systemic and other ocular parameters such as retinal and choroidal thickness were measured and analysed. Total perfused vessel density decreased significantly after haemodialysis in the choriocapillaris; it was not significantly different in the superficial capillary plexus (SCP) and the deep capillary plexus (DCP). Total CT decreased significantly, but total retinal thickness was not significantly different. There was no significant correlation between choriocapillaris perfused vessel density and CT. The reduction in choriocapillaris perfused vessel density correlated with the decrease in systolic and mean arterial blood pressures. The decrease in CT correlated with the ultrafiltration volume. There were no significant systemic and ocular factors affecting change in retinal thickness and perfused vessel density of SCP and DCP. This is the first study to assess the effect of haemodialysis on blood flow changes using SS-OCTA; changes may be more prominent in the choroidal compared to the retinal layer.


Conflict of interest statement

The authors declare no competing interests.

Figures

Figure 1
Figure 1
Swept-source optical coherence tomography (OCT) high resolution single scan (A), and corresponding fundus imaging with the Early Treatment Diabetic Retinopathy Study (ETDRS) grid (B). Single scan swept-source OCT image and corresponding en face OCT angiography of the superficial capillary plexus (C,D), respectively; from 2.6 µm below the internal limiting membrane to 15.6 µm below the interface of the inner plexiform layer and inner nuclear layer (IPL/INL)), the deep capillary plexus (E,F), respectively; from 15.6 µm below the IPL/INL to 70.2 µm below the IPL/INL), and the choriocapillaris (G,H), respectively; from the basement membrane to 10.4 µm below the basement membrane). C = central, OS = outer superior, ON = outer nasal, OI = outer inferior, OT = outer temporal, IS = inner superior, IN = inner nasal, II = inner inferior, IT = inner temporal.
Figure 2
Figure 2
Representative optical coherence tomography angiography (OCTA) images obtained by DRI OCT-1 Atlantis® (Topcon Corporation, Tokyo, Japan). Original grayscale images at the level of superior capillary plexus (A), deep capillary plexus (B), and choriocapillaris (C) were obtained using a 6 × 6 mm protocol centred on the fovea. Colour-coded perfusion density maps at each layer (DF) were automatically generated. Numerical information about perfused vessel density (PVD) of each subfield divided into 9 zone Early Treatment Diabetic Retinopathy Study (ETDRS) grid was calculated using Matlab® (The MathWorks, Inc., Natick, MA, USA) (G–I).
Figure 3
Figure 3
Representative examples of swept-source optical coherence tomography angiography showing changes in perfused vessel density before (A–D) and after (E–H) haemodialysis. Using these density maps and a colour-scaled bar, a numeric perfusion value (%) is calculated for each layer with Matlab® (The MathWorks, Inc., Natick, MA, USA). The decreased perfused vessel density in all subfields at the choriocapillaris can be appreciated qualitatively and quantitatively with the perfusion density map after haemodialysis. HD = haemodialysis, SCP = superficial capillary plexus, DCP = deep capillary plexus.

References

    1. Charlton JF, Schwab IR, Stuchell R. Tear hyperosmolarity in renal dialysis patients asymptomatic for dry eye. Cornea. 1996;15:335–339. doi: 10.1097/00003226-199607000-00001. - DOI - PubMed
    1. Diaz-Couchoud P, Bordas FD, Garcia JRF, Camps EM, Carceller A. Corneal disease in patients with chronic renal insufficiency undergoing hemodialysis. Cornea. 2001;20:695–702. doi: 10.1097/00003226-200110000-00005. - DOI - PubMed
    1. Mullaem, G. & Rosner, M. H. In seminars in dialysis. 403–407 (Wiley Online Library). - PubMed
    1. Niutta A, Spicci D, Barcaroli I. Fluoroangiographic findings in hemodialyzed patients. Annals of ophthalmology. 1993;25:375–380. - PubMed
    1. Tosun Ö, et al. Determination of the effect of a single hemodialysis session on retrobulbar blood hemodynamics by color Doppler ultrasonography. Acta Radiologica. 2007;48:763–767. doi: 10.1080/02841850701348713. - DOI - PubMed

Publication types