. 2018 Nov 21;9(1):4900.
doi: 10.1038/s41467-018-07270-2.

Integrative epigenetic taxonomy of primary prostate cancer

Affiliations

Integrative epigenetic taxonomy of primary prostate cancer

Suzan Stelloo et al. Nat Commun. .

Abstract

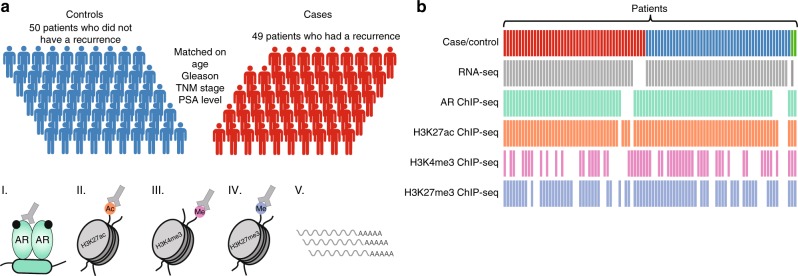
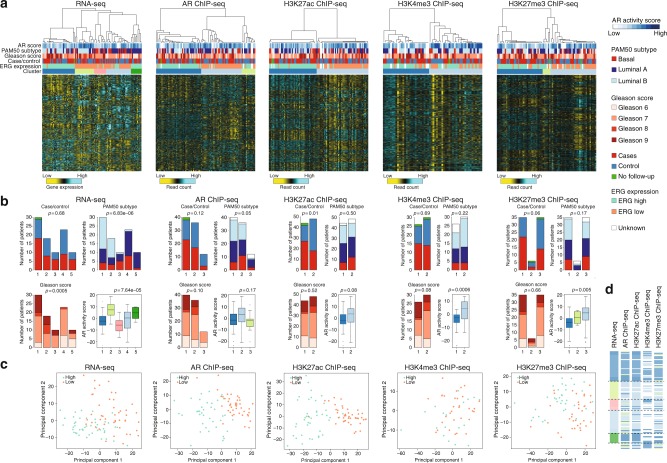
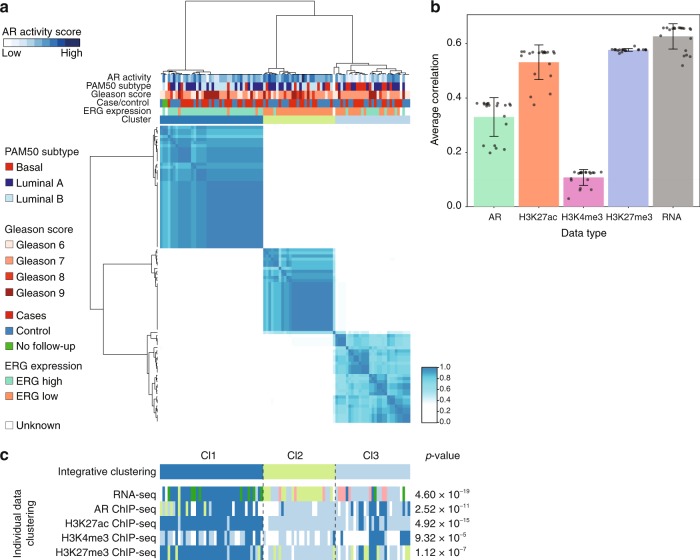
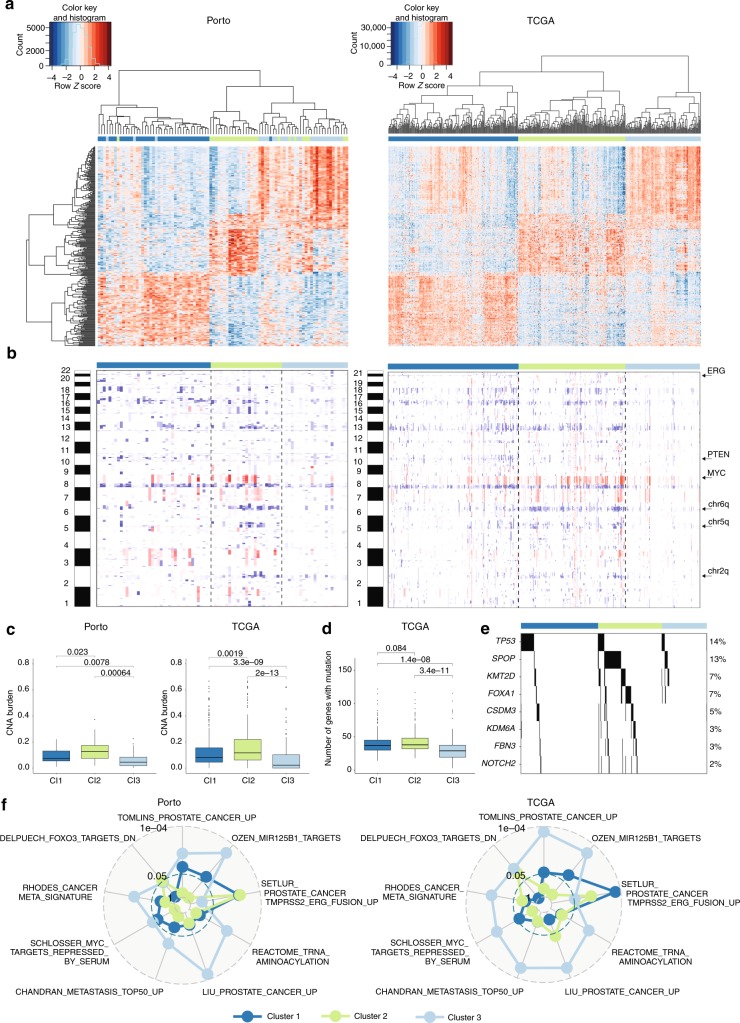
The Androgen Receptor (AR) is the key-driving transcription factor in prostate cancer, tightly controlled by epigenetic regulation. To date, most epigenetic profiling has been performed in cell lines or limited tissue samples. Here, to comprehensively study the epigenetic landscape, we perform RNA-seq with ChIP-seq for AR and histone modification marks (H3K27ac, H3K4me3, H3K27me3) in 100 primary prostate carcinomas. Integrative molecular subtyping of the five data streams revealed three major subtypes of which two were clearly TMPRSS2-ERG dictated. Importantly, we identify a third subtype with low chromatin binding and activity of AR, but with high activity of FGF and WNT signaling. While positive for neuroendocrine-hallmark genes, these tumors were copy number-neutral with low mutational burden, significantly depleted for genes characteristic of poor-outcome associated luminal B-subtype. We present a unique resource on transcriptional and epigenetic control in prostate cancer, revealing tight control of gene regulation differentially dictated by AR over three subtypes.


Conflict of interest statement

The authors declare no competing interests.

Figures

Fig. 1
Fig. 1
Overview of data. a Illustration of the matched case-control cohort. Prostate tumor samples from 49 patients with biochemical recurrence were matched to 50 patients without a recurrence. Samples were matched on clinical parameters age, TNM stage, PSA level, and Gleason score. Fresh frozen material of each patient was processed for RNA-seq, AR ChIP-seq, H3K27ac ChIP-seq, H3K4me3 ChIP-seq, and H3K27me3 ChIP-seq. The male silhouette was adapted from Wikipedia (https://upload.wikimedia.org/wikipedia/commons/archive/4/4e/20180727161732%21Aiga_toiletsq_men.svg). b Data availability for RNA-seq, AR ChIP-seq, H3K27ac ChIP-seq, H3K4me3 ChIP-seq, and H3K27me3 ChIP-seq for each sample. Columns represent individual patient samples. Cases and controls are depicted in red and blue, respectively. Two samples without follow-up are depicted in green (top row)
Fig. 2
Fig. 2
Characterization of ChIP-seq data. a Snapshots for AR (green), H3K27ac (orange), H3K4me3 (pink), and H3K27me3 (purple) ChIP-seq are shown at four example loci in four patients. Genomic coordinates are indicated above. b Peak width distribution of ChIP-seq peaks for AR (green), H3K27ac (orange), and H3K4me3 (pink) peaks. c Distribution of peak width for H3K27me3 ChIP-seq peaks. d Scores plot of principal component analysis based on occupancy (called peaks) of AR (green), H3K27ac (orange), H3K4me3 (pink), and H3K27me3 (purple) ChIP-seq samples. e Correlation heatmap based on peak occupancy. The clustering of the samples represents correlations between individual ChIP-seq samples on the basis of all called peaks. The column color bar indicates the ChIPped factor. Pearson correlation is plotted in white-green color scale. f Plot depicts the number of peaks overlapping in tumors for each factor ChIPped. Consensus peakset were chosen by using a cutoff of peaks present in at least 25, 40, 25, or 15 samples for AR, H3K27ac, H3K4me3, and H3K27me3, respectively. The number of consensus peaks is indicated for each factor. g Genomic distribution of consensus peaks from AR, H3K27me3, H3K27ac, and H3K4me3 across genomic features. h Bar chart shows the Z-score of the top 5 sequence motifs found at consensus AR peaks
Fig. 3
Fig. 3
Consensus clustering of prostate cancer samples by each dataset. a Heatmaps of RNA expression, AR binding, H3K27ac, H3K4me3, and H3K27me3 ChIP-seq signal. Each sample is annotated for AR activity score, PAM50 subtype, Gleason score, case/control status, ERG expression, and consensus cluster assignment. Samples are ordered according to consensus clustering in Supplementary Figure 6. As shown in the color scale for RNA-seq, yellow indicates relatively low expression and blue relatively high expression (z-scores), whereas for ChIP-seq, yellow indicates relatively low peak intensity and blue relatively high peak intensity (z-scores). b Plots showing the distribution of case/control status, Gleason score, PAM50 subtypes, and AR activity score across the clusters identified in RNA-seq, AR ChIP-seq, H3K27ac ChIP-seq, H3K4me3 ChIP-seq, and H3K27me3 ChIP-seq datasets. Boxplots represent median AR activity scores with interquartile ranges. c PCA scores plot for RNA expression, AR binding, H3K27ac, H3K4me3, and H3K27me3 ChIP-seq signal, based on the top 1000 most-varying genes/regions across the samples. Samples are colored according to ERG high or low expression. d Comparison of consensus cluster assignment of the samples (rows) for each datatype (columns)
Fig. 4
Fig. 4
Integrative clustering of prostate cancer samples. a Heatmap displays the consensus matrix of integrative analysis (MIV-NMF) on the basis of RNA-seq, AR, H3K27ac, H3K4me3, and H3K27me3 ChIP-seq for k = 3 (three clusters). Rows and columns are samples, and the more frequently samples occur in the same cluster, the darker the color blue. b Bar plot showing the Pearson’s correlation coefficient capturing the contribution of each data type in integrative clustering. Error bars indicate the standard deviation. c The sample classification into three clusters according to integrative clustering analysis is shown in the top row. The bottom panels show the resultant clustering according to consensus clustering analysis based on each individual data type sorted by integrative cluster assignment. Chi-square tests were used to test for association between the integrative clusters and clusters obtained in each individual data type
Fig. 5
Fig. 5
Validation and characterization of three subtypes. a On the left: unsupervised hierarchical clustering of 285 differentially expressed genes between the three integrative clusters. The sample classification according to integrative cluster analysis is indicated below the branching. On the right: unsupervised hierarchical clustering on the TCGA cohort using the genes differentially expressed across the three clusters of the Porto cohort. The genes (rows) in the heatmap are ordered the same as for the Porto cohort. Color scale: red indicates high expression an blue low expression (z-score). b Heatmap of copy number alterations (CNAs) of 88 Porto samples (left) and TCGA samples (right). Samples from Porto and TCGA cohort are ordered the same as in Figs. 4a and 5a, respectively. Red and blue represent copy number gains and losses, respectively. c CNA burden as fraction of the genome that is copy number altered in the Porto cohort (left) and TCGA cohort (right). Boxplot: median values with interquartile range. p-Values were calculated using the Wilcoxon test. d Boxplot (median values with interquartile range) showing the number of genes with a mutation for the three clusters in the TCGA cohort. p-Values were calculated using the Wilcoxon test. e Association of mutation with the three clusters identified in the TCGA cohort. Only genes with significant differential enrichment among the clusters are shown (FDR < 0.2). Percentages on the left show the mutation frequency. f p-Values for top gene sets enriched (FDR < 0.2) from the MSigDB collection of “curated” gene sets in any of the three clusters, represented in a radar plot for Porto (left) and TCGA cohort (right). p-Value for each cluster is indicated with a line with the corresponding color

References

    1. Ferlay J, et al. Cancer incidence and mortality worldwide: sources, methods and major patterns in GLOBOCAN 2012. Int. J. Cancer. 2015;136:E359–E386. doi: 10.1002/ijc.29210. - DOI - PubMed
    1. Mottet N, et al. EAU-ESTRO-SIOG guidelines on prostate cancer. Part 1: screening, diagnosis, and local treatment with curative intent. Eur. Urol. 2017;71:618–629. doi: 10.1016/j.eururo.2016.08.003. - DOI - PubMed
    1. Roehl KA, Han M, Ramos CG, Antenor JA, Catalona WJ. Cancer progression and survival rates following anatomical radical retropubic prostatectomy in 3,478 consecutive patients: long-term results. J. Urol. 2004;172:910–914. doi: 10.1097/01.ju.0000134888.22332.bb. - DOI - PubMed
    1. Varambally S, et al. Integrative genomic and proteomic analysis of prostate cancer reveals signatures of metastatic progression. Cancer Cell. 2005;8:393–406. doi: 10.1016/j.ccr.2005.10.001. - DOI - PubMed
    1. Taylor BS, et al. Integrative genomic profiling of human prostate cancer. Cancer Cell. 2010;18:11–22. doi: 10.1016/j.ccr.2010.05.026. - DOI - PMC - PubMed

Publication types