. 2018 Nov;563(7732):508-513.
doi: 10.1038/s41586-018-0665-2. Epub 2018 Oct 31.

TDP-43 and RNA form amyloid-like myo-granules in regenerating muscle

Affiliations

TDP-43 and RNA form amyloid-like myo-granules in regenerating muscle

Thomas O Vogler et al. Nature. 2018 Nov.

Abstract

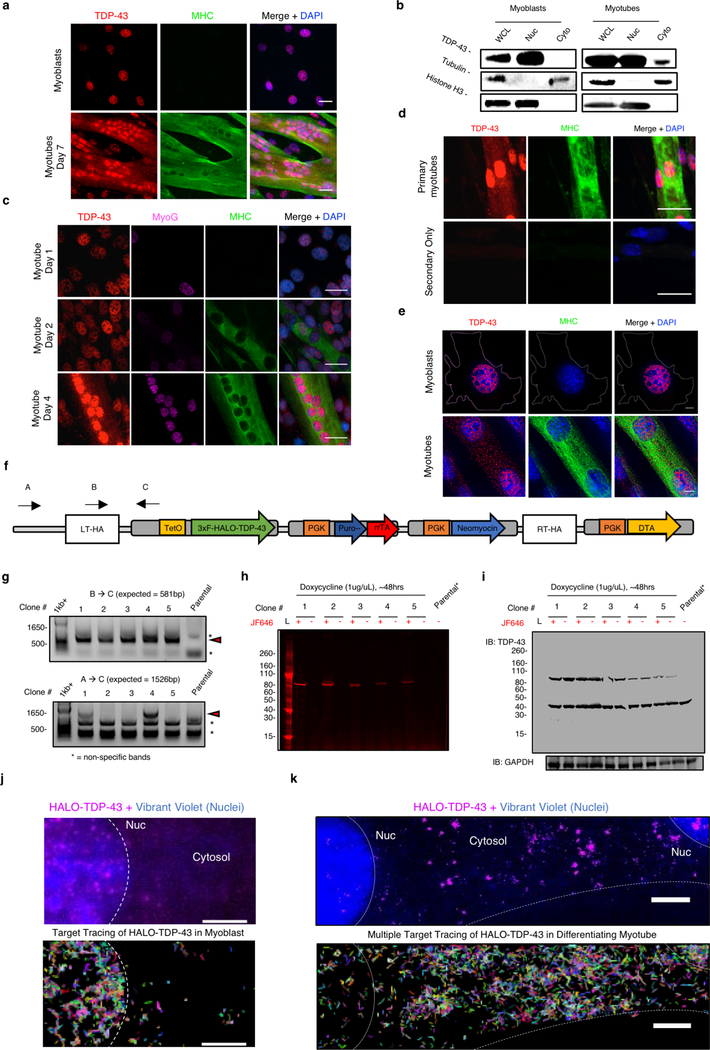
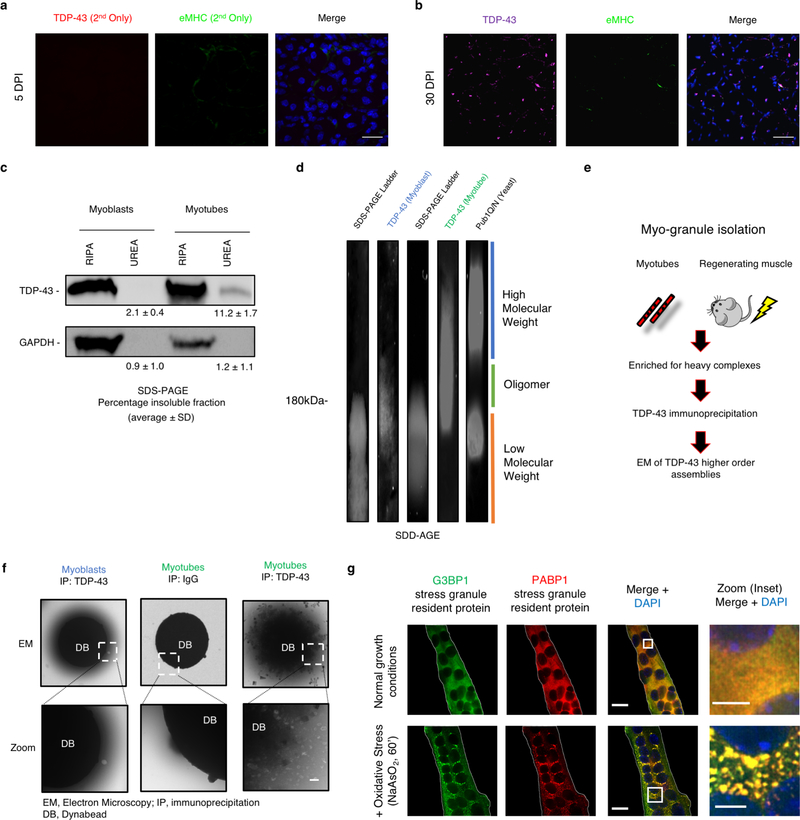
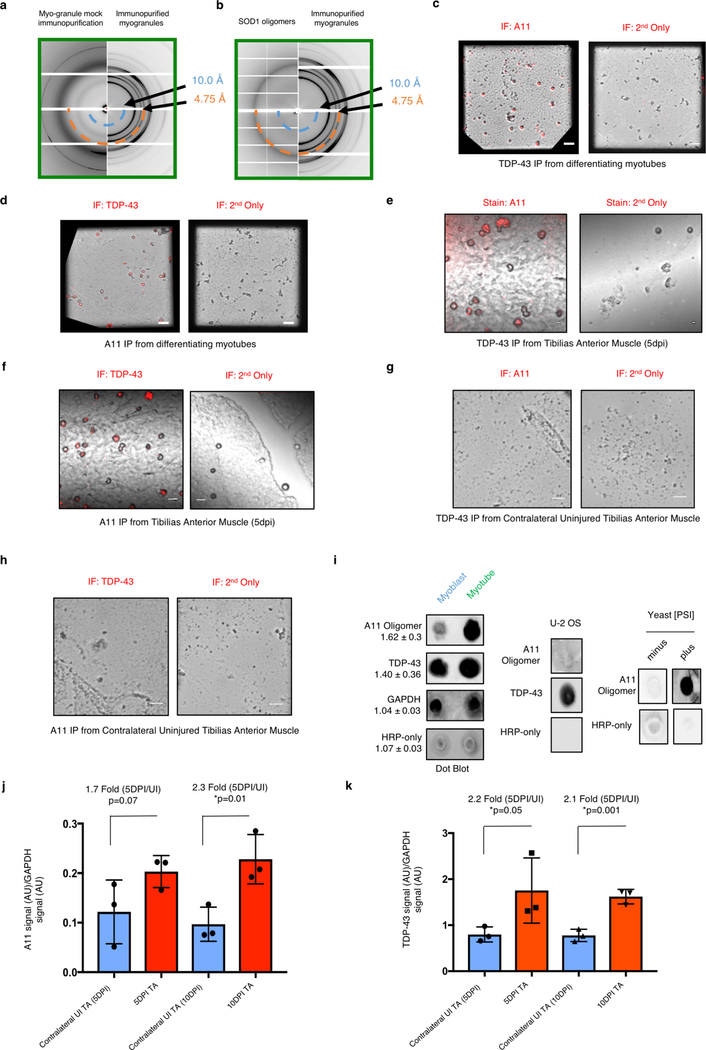
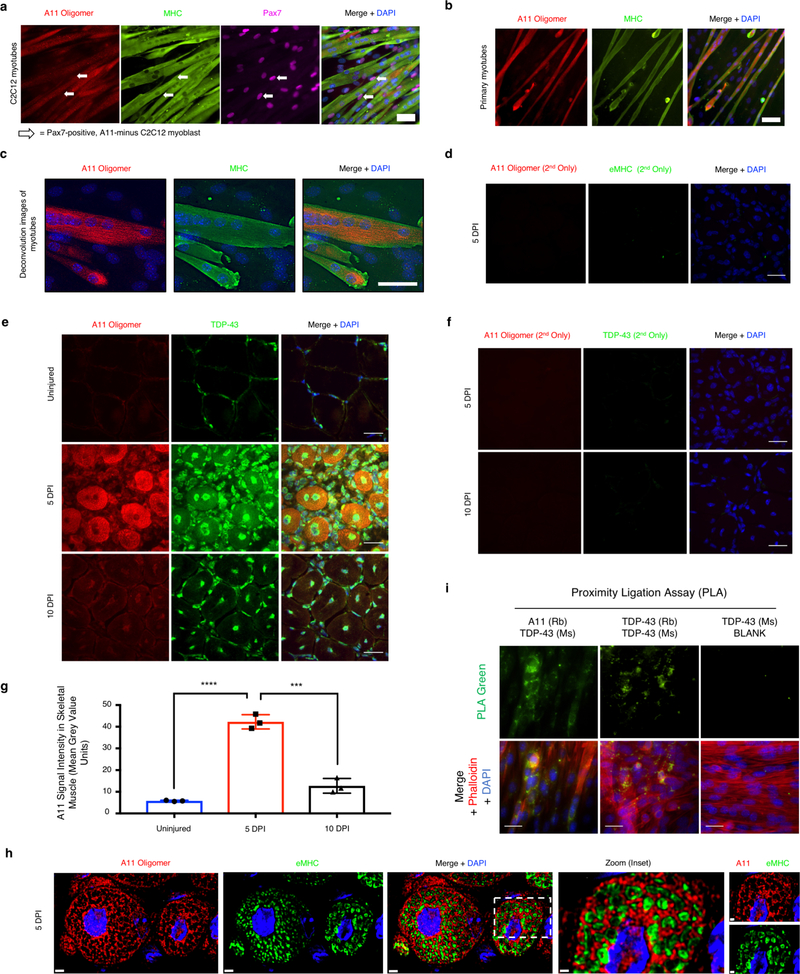
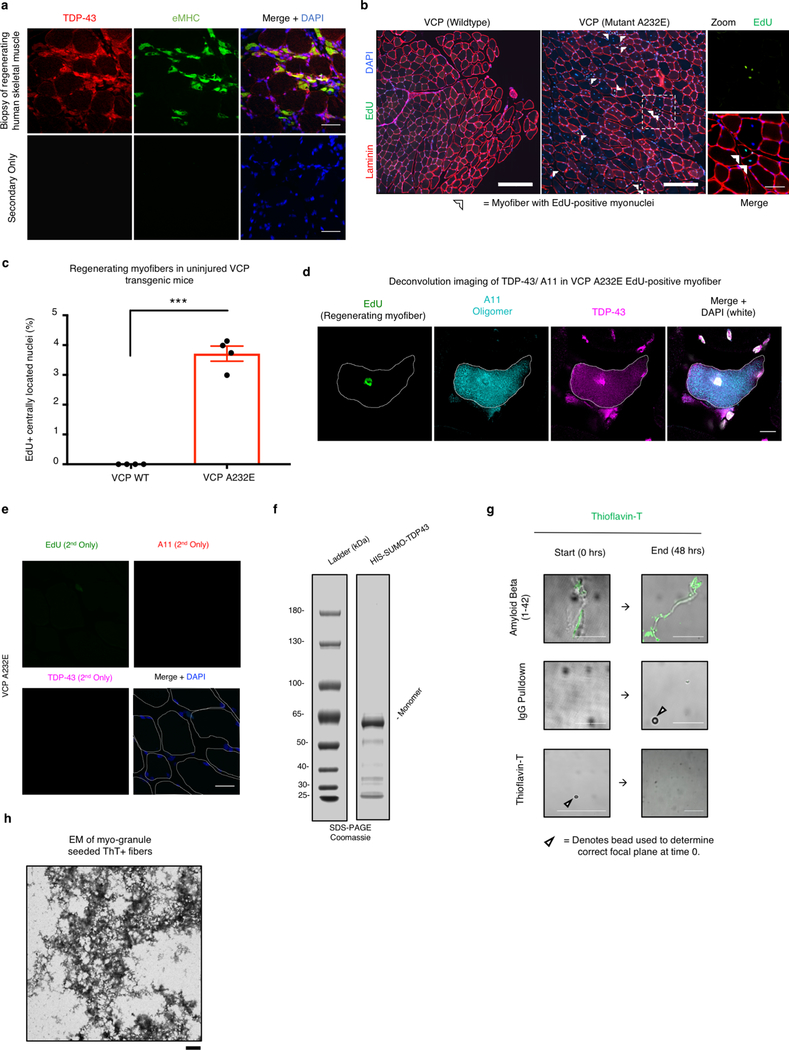
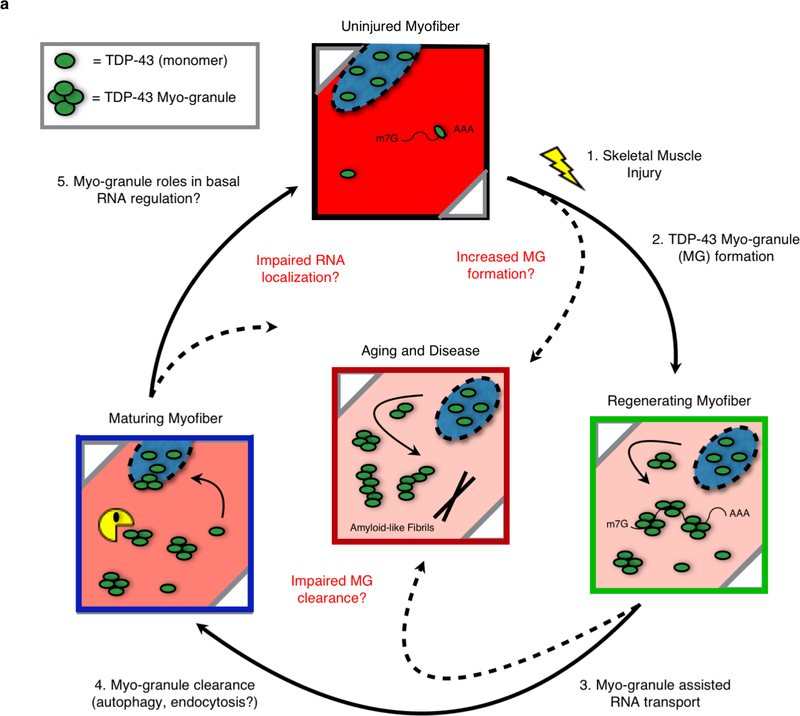
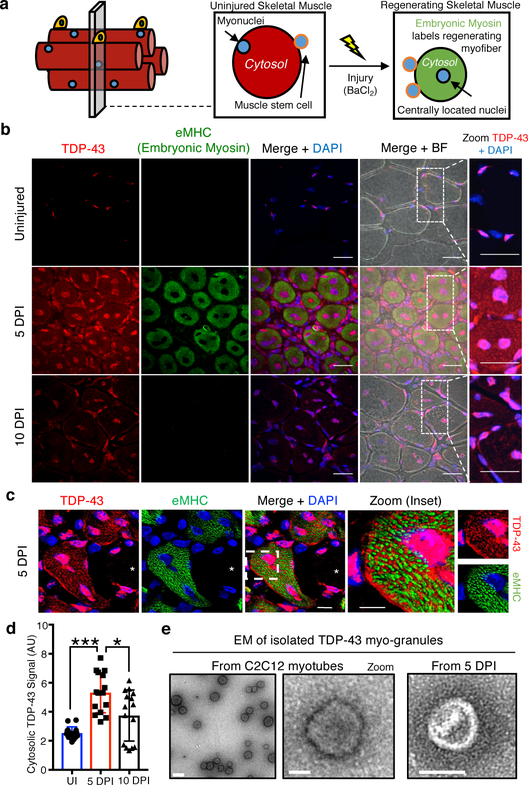
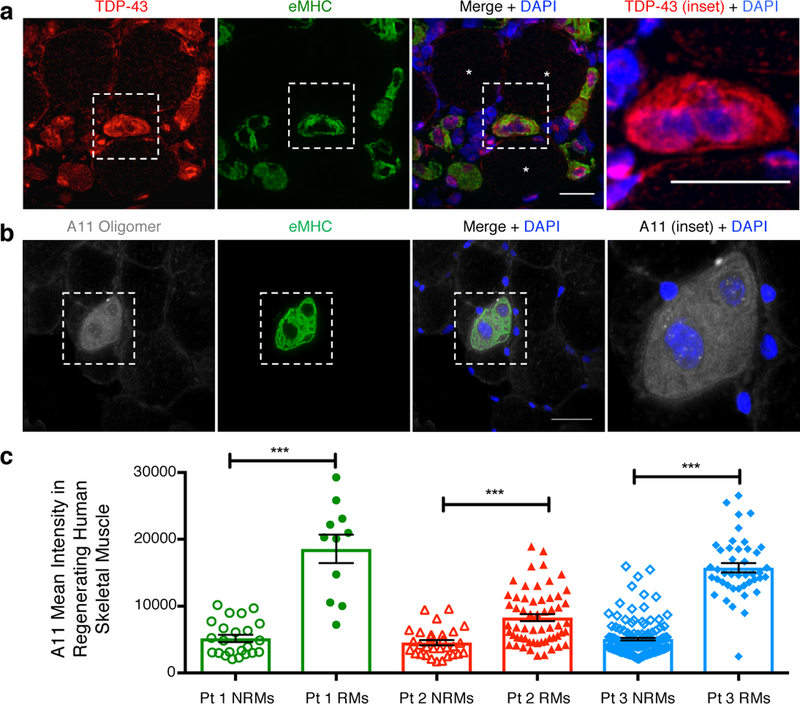
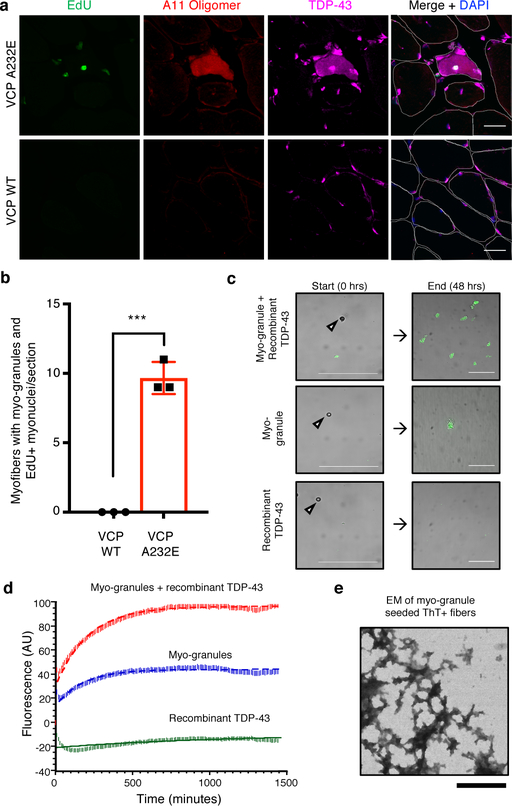
A dominant histopathological feature in neuromuscular diseases, including amyotrophic lateral sclerosis and inclusion body myopathy, is cytoplasmic aggregation of the RNA-binding protein TDP-43. Although rare mutations in TARDBP-the gene that encodes TDP-43-that lead to protein misfolding often cause protein aggregation, most patients do not have any mutations in TARDBP. Therefore, aggregates of wild-type TDP-43 arise in most patients by an unknown mechanism. Here we show that TDP-43 is an essential protein for normal skeletal muscle formation that unexpectedly forms cytoplasmic, amyloid-like oligomeric assemblies, which we call myo-granules, during regeneration of skeletal muscle in mice and humans. Myo-granules bind to mRNAs that encode sarcomeric proteins and are cleared as myofibres mature. Although myo-granules occur during normal skeletal-muscle regeneration, myo-granules can seed TDP-43 amyloid fibrils in vitro and are increased in a mouse model of inclusion body myopathy. Therefore, increased assembly or decreased clearance of functionally normal myo-granules could be the source of cytoplasmic TDP-43 aggregates that commonly occur in neuromuscular disease.


Conflict of interest statement

Author Information

The authors declare no competing interests.

Figures

Extended Data Fig. 1.
Extended Data Fig. 1.. TDP-43 adopts higher-ordered state during normal skeletal muscle formation. (Related to Fig. 1).
(a) Nuclear localization of TDP-43 immunofluorescence in C2C12 myoblasts and both nuclear and cytoplasmic localization in C2C12 myotubes differentiated for 7 days (n = 3 independent experiment). Myosin heavy chain (MHC) identifies differentiated cells. Scale bar is 25μm (b) Subcellular fractionation reveals increased cytosolic TDP-43 in differentiating myotubes (Cyto MB, 5.0 ± 2.1%; Cyto MT,19.7 ± 3.1%; n=3 biologically independent experiments giving similar results, unpaired two-tailed t-test, p-value = 2.0 × 10⁻³). (c) Time-course of TDP-43 immunoreactivity during skeletal muscle differentiation (n = 3 independent experiments with similar results). Myogenin (MyoG) immunoreactivity (magenta) and MHC immunoreactivity (green), identify differentiated cells. Nuclei counterstained with DAPI. Scale bar is 25μm (d) TDP-43 immunoreactivity in primary myotubes derived from muscle stem cells differentiated in culture for 4 days (n = 3 independent experiments with similar results). Images for a secondary antibody control on the lower panel. Scale bar is 25 μm. (e) Deconvolution microscopy of TDP-43 immunoreactivity in C2C12 myotubes differentiated for 5 days (n=3 independent experiments with similar results). (f) CRISPR/Cas9-mediated genomic integration of tetracycline inducible HALO-TDP-43 into the ROSA26 safe harbor locus in C2C12 myoblasts. (g) PCR of C2C12 myoblast gDNA for the presence of the HALO-TDP-43 construct (top panel) and for integration into the ROSA26 locus (bottom panel) using the primers mapped in (f) (n=3 independent experiments with similar results). Red arrowheads point to the expected PCR product for ROSA26 integration. Subsequent live-imaging experiments were performed using clones 1 and 4. (h) Detection of fluorescently labeled HALO-tagged TDP-43 in C2C12 myoblasts following induction resolved on SDS-PAGE. Janelia Fluor® 646 (JF646) (n = 3 independent experiments with similar results). (i) Detection of both HALO-tagged TDP-43 and endogenous TDP-43 in selected C2C12 cell clones (n=3 independent experiments with similar results). (j) Representative myoblast and (k) multinucleated myotube image of individual HALO-TDP-43 molecules. Top panels are taken from start of acquisition (frame 1). Nuclei (Nuc) and cytosolic borders are demarcated with white dotted lines (n=3 independent experiments with similar results). Lower panels show dynamic mapping of single TDP-43 molecule tracks using multiple target tracing Matlab script. Vibrant Violet was used to detect myonuclei. Scale is 5 μm.
Extended Data Fig. 2.
Extended Data Fig. 2.. TDP-43 adopts higher-ordered state during normal skeletal muscle formation (Related to Fig 1).
(a) Secondary antibody control for 5 dpi TDP-43 staining in TA muscle sections. (n = 5 mice per condition providing similar results). eMHC (embryonic myosin heavy chain) immunoreactivity in regenerating myofibers with nuclei counterstained with DAPI. (b) Immunoreactive TDP-43 in 30dpi TA muscle sections with nuclei counterstained with DAPI (n = 4 mice). Scale bar is 50 μm. (c) RIPA-UREA assay reveals presence of a urea insoluble TDP-43 fraction isolated from C2C12 myotubes differentiated for 7 days but not in C2C12 myoblasts (n=3 independent experiments, each giving similar results, unpaired two-tailed t-test, p-value = 0.0008). GAPDH remains RIPA-soluble in both myoblasts and myotubes (n = 3 independent experiments, each giving similar results, unpaired two-tailed t-test, p-value = 0.7443) (d) Higher molecular weight SDS-resistant TDP-43 assemblies present in differentiating C2C12 myotubes resolved by SDD-AGE (Semi-Denaturing Detergent Agarose Gel Electrophoresis) (n = 3 independent experiments). Pub1 Q/N-GFP from yeast forms higher molecular weight SDS-resistant assemblies than TDP-43 assemblies. (e) Schematic for the isolation of myo-granules containing TDP-43 during skeletal muscle formation (f) Immunoprecipitation (IP) of TDP-43 on dynabeads (DB) reveals oligomers isolated from C2C12 myotubes but absent in myoblasts as observed by electron microscopy (EM) (n = 3 independent experiments). (g) Stress granule formation in multinucleated myotubes derived from C2C12 cells. Immunofluorescence using antibodies against stress granule proteins, G3BP1 and Pabp1, after ± NaAsO2 treatment for 60min (n=3 independent experiments, each giving similar results). Zoom represents magnified inset. Scale bars are 5μm and 20μm, respectively.
Extended Data Fig. 3.
Extended Data Fig. 3.. Myo-granules containing TDP-43 are amyloid-like oligomers. (Related to Fig 2).
(a-b) X-ray diffraction on immunoprecipitated myo-granules (right half of both panels) compared to the diffraction of mock IgG immunoprecipitation (left half of panel a) and to the diffraction of super oxide dismutase 1 (SOD1) amyloid oligomers (left half of panel b). In all diffraction patterns two rings at ~4.8 Å and ~10 Å are drawn on the bottom half to highlight absence of an ~4.8 Å reflection in the mock immunoprecipitation and a similar ~4.8 Å reflection with a ~10 Å reflection absence in the SOD1 diffraction. One sample per condition was used. Two diffraction images at different rotations were taken per sample and each image gave similar results. (c) Complexes immunopurified using TDP-43 or (d) A11 isolated from C2C12 myotubes are immunoreactive for A11 and TDP-43 respectively, while immunopurified TDP-43 or A11 myo-granules immunostained with secondary antibodies lack signal (red) (n=3 independent experiments). Scale bar is 1 μm. (e) Complexes immunopurified using TDP-43 or (f) A11 isolated from 5 dpi TA muscle are immunoreactive for A11 and TDP-43 respectively, while immunopurified TDP-43 or A11 myo-granules immunostained with secondary antibodies lack signal (red) (n=3 mice). Scale bar is 0.05 μm. (g) TDP-43 immunopurified complexes isolated from an uninjured TA muscle (contralateral to the 5dpi muscle) reveal no complexes with an A11 oligomeric confirmation (n = 3 mice). Scale bar is 0.05 μm. (h) A11 immunopurified complexes from an uninjured TA muscle (contralateral to the 5dpi muscle) reveal no complexes containing TDP-43 (n = 3 mice). Scale bar is 0.05 μm. (i) Dot blot A11 immunoreactivity in C2C12 cells differentiated into myotubes as compared to myoblasts. Quantification reflects fold change in dot blot signal from myoblast to myotube. Data are mean ± s.d. (n=3 independent experiments) (j) Quantification of dot blot signal for A11 conformation complexes and TDP-43 (k) during skeletal muscle regeneration at 5dpi and at 10dpi compared to contralateral uninjured TA muscle and normalized to HRP-only signal. Quantification reflects fold change in dot blot signal. Data are mean ± s.d., n = 3 mice, p-value are unpaired two-tailed t-test.
Extended Data Fig. 4.
Extended Data Fig. 4.. Myo-granules containing TDP-43 are amyloid-like oligomers. (Related to Fig 2).
(a) C2C12 myotubes differentiated for 7 days reveal strong A11 immunoreactivity in myosin heavy chain (MHC)-positive myotubes but no A11 immunoreactivity in undifferentiated Pax7-positive myoblasts (n=3 independent experiments). (b) Muscle stem cells isolated from 4-month old C57/BL6 mice were differentiated in culture for 5 days and reveal cytoplasmic and nuclear immunoreactivity for A11 oligomer. Myotubes are immunoreactive for MHC (n = 3 mice). (c) Deconvolution microscopy of C2C12 myotubes differentiated for 7 days reveal punctate A11 staining in myosin heavy chain (MHC)-positive myotubes but no A11 signal in undifferentiated myoblasts (n=3 independent experiments). (d) Secondary antibody control for 5 dpi A11 in TA muscle sections. Nuclei counterstained with DAPI. Scale bars are 25 μm (n = 4 mice). (e) Representative images of A11 and TDP-43 colocalization in uninjured, 5 dpi and 10 dpi TA muscle (n=3 mice). (f) Secondary antibody control for 5 dpi and 10dpi A11-TDP-43 colocalization in TA muscle section reveals lack of signal. Nuclei counterstained with DAPI. Scale bars are 25 μm (n = 3 mice). (g) Quantification of A11 signal intensity in myofibers from (e). Unpaired two-tailed t-test for uninjured vs 5dpi p-value = 4.4 × 10⁻⁵ (****); 5dpi vs 10dpi p-value = 4.1 × 10⁻⁴ (***); 10dpi vs uninjured p-value = 0.024 (not shown). n = 3 mice per condition, n = 10 myofibers averaged per mouse. Data are mean ± s.d. (h) Representative deconvolution image of A11 and eMHC immunoreactivity in 5dpi mouse TA myofibers quantified in Fig. 2c (n = 3 mice providing similar results). Scale bar is 2μm and 0.8μm (zoomed inset). (i) Proximity ligation assays (PLAs) reveal complexes of TDP-43 and A11 (green) in C2C12 myotubes counterstained with phalloidin (red). A PLA positive control with two antibodies that recognize different epitopes of TDP-43 are positive, whereas complexes are absent if one primary antibody is omitted (n = 3 independent experiments per condition).
Extended Data Fig. 5.
Extended Data Fig. 5.. TDP-43 binds select sarcomeric mRNA transcripts during muscle formation (Related to Fig 3).
(a) RNA immunoprecipitation (RIP) from C2C12 myotubes, followed by oligo-dT Northern blot reveals A11 and TDP-43 associate with poly-A RNA (n = 3 biologically independent samples). (b) Schematic of enhanced CLIP (eCLIP) protocol for cultured C2C12 myoblasts and myotubes. (c) Immunoprecipitation of TDP-43 complexes used for eCLIP in C2C12 myoblast (n = 2 biologically independent samples). (d) Same as in (B) but for C2C12 myotubes (n = 2 biologically independent samples). (e) Autoradiogram of 32P-labeled TDP-43 - RNA complexes fractionated by PAGE. White box indicates the area cut and used for eCLIP library preparation (n=1 library prepared per condition). (f) Scatterplots indicate correlation between significant TDP-43 eCLIP peaks in biological replicates. Scatterplot represents fold enrichment for each region in TDP-43 eCLIP relative to paired size matched input (SMInput) with significant peaks in red (p ≤ 10−8 over SMIput). P-values for each peak to determine significance were calculated by Yates’ Chi-Square test (Perl) or Fisher Exact Test (R computing software) when the expected or observed read number was below five. For myoblasts R values calculated using n = 511137 non-significant peaks and n = 596 significant peaks. For myotubes R values calculated using n = 413368 non-significant peaks and n = 1501 significant peaks. UG-rich motif is significantly enriched in clusters from ORFs and UTRs (p-value determined by DREME software tool). (g) Irreproducible discovery rate (IDR) analysis comparing peak fold enrichment across indicated datasets. (h) TDP-43 eCLIP reveals TDP-43 binds to 3’UTR of TDP-43 transcript in myoblasts (top panel) and myotubes (bottom panel) (n=3 biologically independent experiments giving similar results).
Extended Data Fig. 6.
Extended Data Fig. 6.. TDP-43 binds select sarcomeric mRNA transcripts during muscle formation (Related to Fig 3).
(a) Myoblast (left column), myotube (middle column) and shared (right column) connectome analysis for all TDP-43 eCLIP peaks (top row) and TDP-43 exonic peaks (bottom row). (b) TDP-43 binds predominantly in exons of protein coding RNAs in C2C12 myoblasts. (c) Peak distribution for significantly enriched TDP-43 peak locations in myoblasts and myotubes across the transcriptome reveal increased exonic and 3’-UTR association compared to neuronal TDP-43 peaks identified in and in. (d) Identification of multiple TDP-43 binding sites across and within exons of Titin. Zoomed region is representative of multiple UG-rich sequences within single exon (n=3 biologically independent experiments giving similar results).
Extended Data Fig. 7.
Extended Data Fig. 7.. TDP-43 binds select sarcomeric mRNA transcripts during muscle formation (Related to Fig 3).
(a) SDS-PAGE gel stained with SYPRO Ruby reveals enrichment for select proteins during fractionation of total cell lysate (T) from C2C12 myotubes, enriched fraction (EF) and TDP-43 immunoprecipitation (IP) (n=3 biologically independent experiments giving similar results). TDP-43 IP and IgG control IP are representative of the fractions used for mass spectrometry. (b) Venn diagram showing significant overlap between the myo-granule proteome and TDP-43 interactome (defined by) (p-value determined using hypergeometric test). (c) Gene Ontology of myo-granules reveals enrichment for processes relating to the localization and translation of RNA (n=356 proteins, p-value determined using hypergeometric test with Benjamini & Hochberg False Discovery Rate (FDR) correction). (d) Venn diagram showing significant overlap between myo-granules and neuronal RNA granule proteomes (defined by) (p-value determined using hypergeometric test). (e) VCP, a top hit in the myo-granule proteome, colocalizes with cytoplasmic TDP-43 and A11 signal in 5dpi mouse skeletal muscle (n = 3 mice). (f) The RNA-binding protein hnRNPA2B1 is not associated with the myo-granule proteome and remains localized to myonuclei in injured (5 dpi) and uninjured TA muscle (n = 3 mice).
Extended Data Fig. 8.
Extended Data Fig. 8.. TDP-43 binds select sarcomeric mRNA transcripts during muscle formation (Related to Fig 3).
(a) Schematic for the approach used to knockout TDP-43 and quantify C2C12 myoblast proliferation. (b) Schematic for the isolation and fluorescence activated cell sorting (FACS) of muscle stem cells from Pax7iresCre;TDP-43flox/wt;TdTom and Pax7iresCre;TDP-43wt/wt;TdTom mice. (>125k muscle stem cells collected per mouse from two populations defined in (b) as TdTom+ and TdTom++). (c) TDP-43 mRNA expression relative to GAPDH mRNA expression from isolated muscle stem cells from (b) (n = 4 independent experiments, each a mean of technical triplicates, from n = 2 mice). Unpaired, two-tailed t-test (*) p-value = 0.0469). (d) Myofiber feret diameter frequency distribution in uninjured Pax7iresCre;TDP-43flox/wt mice compared to Pax7iresCre;TDP-43wt/wt controls (n = 3 mice, 600 myofibers quantified per condition). (e) Quantification of myofiber feret diameter in (c). Box plot horizontal bars represent mean, 25th and 75th percentile ± minima/maxima (n = 3 mice, 600 myofibers per condition). Unpaired, two-tailed, t-test p-value = 0.5925 is not significant (n.s.). (f) Pax7+ muscle stem cell numbers in uninjured Pax7iresCre;TDP-43flox/wt mice compared to Pax7iresCre;TDP-43wt/wt controls (n = 3 mice). Unpaired two-tailed, t-test p-value = 0.1963 (n.s.). Data are mean ± s.d. (g) Schematic for TDP-43 depletion in Pax7+ muscle stem cells during muscle regeneration in Pax7iresCre;TDP-43flox/wt and Pax7iresCre;TDP-43wt/wt mice (Tmx, Tamoxifen). (h) Quantification of myofiber feret diameter from Fig. 3h at 10 dpi in in muscle stem cell TDP-43 haploinsufficient mice compared to wild type control. Box plot horizontal bars represent mean, 25th and 75th percentile ± minima/maxima from n = 489 myofibers from n = 3 mice per condition. Unpaired, two-tailed, t-test (****) p-value = 2.3 × 10⁻³⁰. (i) Similar Pax7+ muscle stem cell numbers at 10 dpi in muscle stem cell TDP-43 haploinsufficient mice compared to controls. Data are mean ± s.d. from n = 3 mice, Unpaired two-tailed, t-test p-value = 0.89 (n.s.).
Extended Data Fig. 9.
Extended Data Fig. 9.. Myo-granules are increased in VCP disease and are capable of seeding amyloid-like fibers (Related to Fig 4, 5).
(a) Representative image of TDP-43 immunoreactivity (top panel) and secondary antibody only control (bottom panel) in regenerating human skeletal muscle from patient with necrotizing myopathy (n = 3 independent patient biopsies each giving similar results). Scale bar is 50μm. (b) Representative TA cross-section images of uninjured VCP A232E and VCP WT mice labeled with EdU after 21 days of EdU given in the drinking water to mark division and fusion of muscle stem cells, visualized for laminin immunoreactivity to identify myofibers and stained with DAPI to identify nuclei. Arrowheads indicate myofibers with EdU+ centrally-located myonuclei (n = 3 mice each giving similar results). Scale bar is 200 μm and 50μm in inset. (c) Quantification of myofibers with EdU+ centrally-located myonuclei in VCP A232E and VCP WT mice (n = 4 mice, >1000 myofibers quantified per genotype). Data is mean ± s.d. Unpaired, two-tailed, t-test p-value = 6.5 ×10⁻⁶. (d) Representative deconvolution image of A11 and TDP-43 co-localization in a regenerating myofiber from a VCP A232E TA muscle (n = 3 mice each giving similar results). Scale bar is 10μm (e) Secondary antibody control for uninjured VCP A232E TA muscle section reveals lack of signal. Nuclei counterstained with DAPI and myofibers are outlined in white (n = 4 mice each giving similar results). Scale bar is 25μm. (f) Coomassie stained recombinant HIS-SUMO-TDP-43 used for Thioflavin-T assays resolved by SDS-PAGE (n=3 biologically independent experiments each giving similar results). (g) Thioflavin T (ThioT) incorporation reveals ThioT-positive amyloid-like fibers for recombinant Aβ1–42 and absence of ThioT signal for both IgG pulldown control and ThioT alone (n=3 biologically independent experiments each giving similar results). Scale bar is 10 μm. (e) Representative transmission electron microscopy image (zoomed out from Fig 5e) of ThioT-positive fibers formed from isolated myo-granules (n=3 biologically independent experiments). Scale bar is 1μm.
Extended Data Fig. 10.
Extended Data Fig. 10.. Myo-granules are increased in VCP disease and are capable of seeding amyloid-like fibers (Related to Fig 4).
(a) Schematic of TDP-43 oligomerization and aggregation in wild type, aging and diseased skeletal muscle myofibers.
Fig 1.
Fig 1.. TDP-43 adopts higher-ordered state during normal skeletal muscle formation.
(a) Schematic for regeneration of skeletal muscle injuries in wild type mice. (b) TDP-43 immunoreactivity following BaCl2-induced tibialis anterior (TA) muscle injury. Embryonic myosin heavy chain (eMHC) in regenerating myofibers with nuclei counterstained with DAPI. Scale bar is 25μm in merged and zoom panels (n = 5 mice per condition providing similar results). (c) Super resolution imaging of TDP-43 immunoreactivity around nascent sarcomeres in the cytoplasm during muscle regeneration. Scale bar is 10μm in merged panels and 5μm in zoom panels. Asterisk identifies an uninjured myofiber lacking eMHC and TDP-43 cytosolic signal. Nuclei are counterstained with DAPI (n=3 biologically independent experiments providing similar results) (d) Quantification of cytoplasmic TDP-43 signal in skeletal muscle myofibers using unpaired two-tailed t-tests for each individual comparison: 5dpi vs UI p-value = 4.36 × 10⁻⁸ (***); 5dpi vs 10dpi p-value = 0.011(*); 10dpi vs UI p-value = 0.015 (not shown) (n=3 biological replicates, n=5 myofibers per replicate). Data are mean ± s.d. (e) Electron microscopy of myo-granules isolated by TDP-43 immunoprecipitation from C2C12 myotubes and from mouse 5dpi TA muscle (n=3 biologically independent experiments providing similar results).
Fig 2.
Fig 2.. Myo-granules containing TDP-43 are amyloid-like oligomers.
(a) X-ray diffraction on myo-granules immunoprecipitated from C2C12 myotubes. Two rings at ~4.8 Å (orange) and ~10 Å (blue) are drawn on the bottom half to highlight locations of these reflections. One sample per condition was used. Two diffraction images at different rotations were taken per sample and each image gave similar results. (b) A11 immunoreactivity during TA muscle regeneration and uninjured muscle (n = 4 mice per condition). Regenerating myofibers are immunoreactive for eMHC. Scale bars = 25μm. (c) Quantification of A11 and TDP-43 co-localization and A11 and eMHC co-localization in 5 dpi skeletal muscle. Unpaired two-tailed t-test (***) p-value = 6.3 × 10⁻¹⁷. n = 3 mice, n = 5 myofibers per mouse. Data are mean ± s.d. (d) Representative deconvolution image of A11 and TDP-43 co-localization in 5dpi mouse TA myofibers quantified in (c). Scale bar is 3μm and 1μm (zoomed inset) (n = 3 mice providing similar results).
Fig 3.
Fig 3.. TDP-43 binds select sarcomeric mRNA transcripts during muscle formation.
(a) Distribution of TDP-43 RNA binding identified by eCLIP in C2C12 myotubes (b) TDP-43 eCLIP myotube exonic peaks identified in select sarcomeric mRNA transcripts. All listed genes are found in at least one eCLIP replicate, * = identified in two replicates, red = gene associated with muscle disease. Sarcomere schematic is adapted from (c) Single molecule FISH (smFISH) for embryonic myosin heavy chain (Myosin-3) and Troponin C1 (Tnnc1) mRNA co-localized with cytoplasmic and nuclear TDP-43 immunoreactivity in C2C12 myotubes (n=3 biologically independent experiments). (d) SmFISH for Titin mRNA co-localized with both A11 and TDP-43 immunoreactivity in cytoplasm of myosin heavy chain-positive C2C12 myotubes (n=3 biologically independent experiments). Scale bar is 10 μm for merged panels, 0.5 μm for insets for (c, d). (e) Representative images of CRISPR-Cas9 TDP-43 scramble sgRNA (top panel) and TDP-43 knockout sgRNA (bottom panel) C2C12 cells showing TDP-43 immunoreactivity and EdU incorporation. Scale bar is 50μm. Cells counterstained with DAPI (n=3 biologically independent experiments each giving similar results). (f) Quantification of EdU incorporation in TDP-43 knockout (sgTDP-43) and scramble (sgScr) C2C12 cells after 7 days in culture (n = 3 independent experiments). Unpaired two-tailed t-test *** p-value = 0.0007. Data are mean ± s.d. (g) Representative images at 10 dpi regenerating TA muscle reveals reduced myofiber feret diameter in TDP-43 haploinsufficient Pax7iresCre;TDP-43flox/wt mice. Laminin immunoreactivity identifies myofibers and nuclei are counterstained with DAPI. Scale bar is 50 μm (n = 3 mice per condition). (h) Myofiber feret diameter frequency distribution in Pax7iresCre;TDP-43flox/wt mice at 10dpi compared to Pax7iresCre;TDP-43wt/wt controls (> 450 myofibers quantified per condition from n = 3 mice).
Fig. 4.
Fig. 4.. Myo-granules form during human muscle regeneration.
(a) Representative image of cytoplasmic TDP-43 in regenerating human skeletal muscle from patient with necrotizing myopathy (n = 3 individual patient skeletal muscle biopsies gave similar results). Scale bar is 50μm. (b) Representative image of A11 immunoreactivity in regenerating human skeletal muscle from patient with necrotizing myopathy (n = 3 individual patient skeletal muscle biopsies gave similar results). Scale bar is 100μm. (c) Quantification of A11 immunoreactive intensity in regenerating myofibers (RM = eMHC+) compared to non-regenerating myofibers (NRMs = eMHC-) from three patients (Pt) with necrotizing myopathy. Unpaired two-tailed t-test used for each individual comparison: For Pt 1 NRMs (n = 23) vs RMs (n = 11) *** p-value = 2.54 × 10⁻⁹; For Pt 2 NRMs (n = 31) vs RMs (n = 59) *** p-value = 7.89 × 10⁻⁶; For Pt 3 NRMs (n = 146) vs RMs (n = 44) *** p-value = 6.17 × 10−49. Data are mean ± s.e.m.
Fig 5.
Fig 5.. Myo-granules are increased in VCP disease and are capable of seeding amyloid-like fibers.
(a) Uninjured VCP A232E TA muscle (top panel) and uninjured VCP wild type (WT) TA muscle (bottom panel) probed for EdU incorporation into centrally-located nuclei and immunostained for A11 and TDP-43. Cells counterstained with DAPI and myofibers outlined in white. Scale bar is 25μm. (b) Quantification of myofibers with EdU+ centrally-located myonuclei, A11 immunoreactivity and cytoplasmic TDP-43 in VCP A232E and VCP WT mice. Unpaired two-tailed t-test p-value = 1.3 × 10⁻⁴ (n = 3 mice, 1 tibialis anterior cross section quantified per mouse). Data are mean ± s.d. (c) Representative images of purified myo-granules from C2C12 myotubes incubated with or without recombinant TDP-43 and Thioflavin-T (ThioT) reveals formation of higher order ThioT-positive amyloid-like fibers. Scale bar is 25 μm (n=3 biologically independent experiments). (d) Plot of kinetics for fiber aggregation determined by ThioT incorporation measured in 10-minute intervals. Rates derived by fitting time points to single exponential rate equation: Myo-granule + recombinant TDP-43 R2 = 0.96; kobs × 10−4 (min−1) = 47 ± 1.6; Myo-granule R = 0.92; kobs × 10−4 (min−1) = 56 ± 2.9; Recombinant TDP-43 R = 0.47; kobs × 10−4 (min−1) = 8.5 ± 4.9) (n=3 biologically independent experiments, background corrected arbitrary units, AU). (e) Representative transmission electron microscopy images of ThioT-positive fibers formed from isolated myo-granules (n=3 biologically independent experiments). Scale bar is 1μm.

Comment in

References

    1. Küsters B et al. TDP-43 accumulation is common in myopathies with rimmed vacuoles. Acta Neuropathol. (Berl.) 117, 209–211 (2009). - PubMed
    1. Weihl CC et al. TDP-43 accumulation in IBM muscle suggests a common pathogenic mechanism with Frontotemporal dementia. J. Neurol. Neurosurg. Psychiatry 79, 1186–1189 (2008). - PMC - PubMed
    1. Neumann M et al. Ubiquitinated TDP-43 in frontotemporal lobar degeneration and amyotrophic lateral sclerosis. Science 314, 130–133 (2006). - PubMed
    1. Renton AE, Chiò A & Traynor BJ State of play in amyotrophic lateral sclerosis genetics. Nat. Neurosci 17, 17–23 (2014). - PMC - PubMed
    1. Kraemer BC et al. Loss of murine TDP-43 disrupts motor function and plays an essential role in embryogenesis. Acta Neuropathol. (Berl.) 119, 409–419 (2010). - PMC - PubMed

Publication types

MeSH terms