. 2018 Nov;563(7733):714-718.
doi: 10.1038/s41586-018-0735-5. Epub 2018 Nov 21.

Efferocytosis induces a novel SLC program to promote glucose uptake and lactate release

Affiliations

Efferocytosis induces a novel SLC program to promote glucose uptake and lactate release

Sho Morioka et al. Nature. 2018 Nov.

Abstract

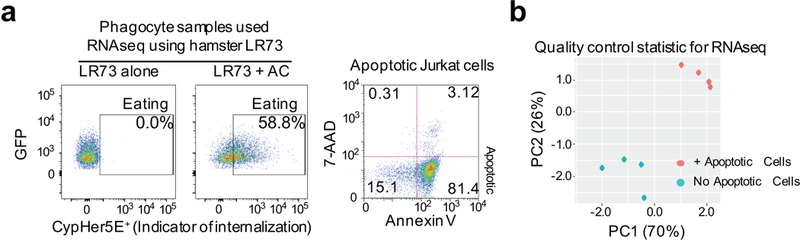
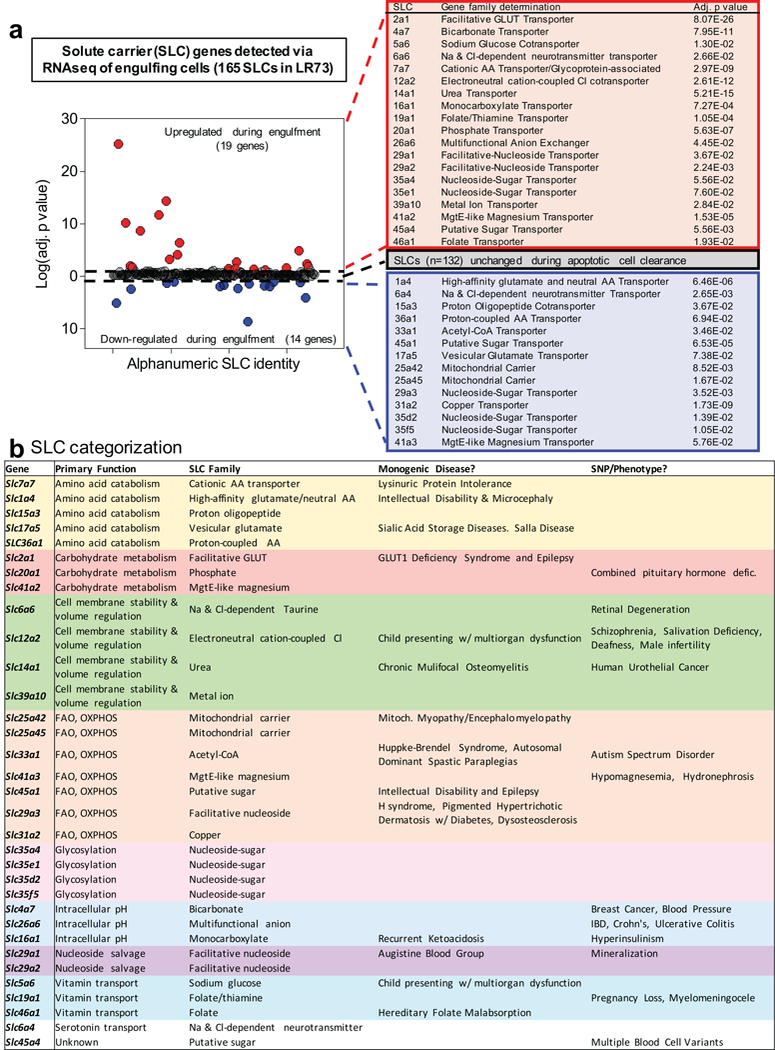
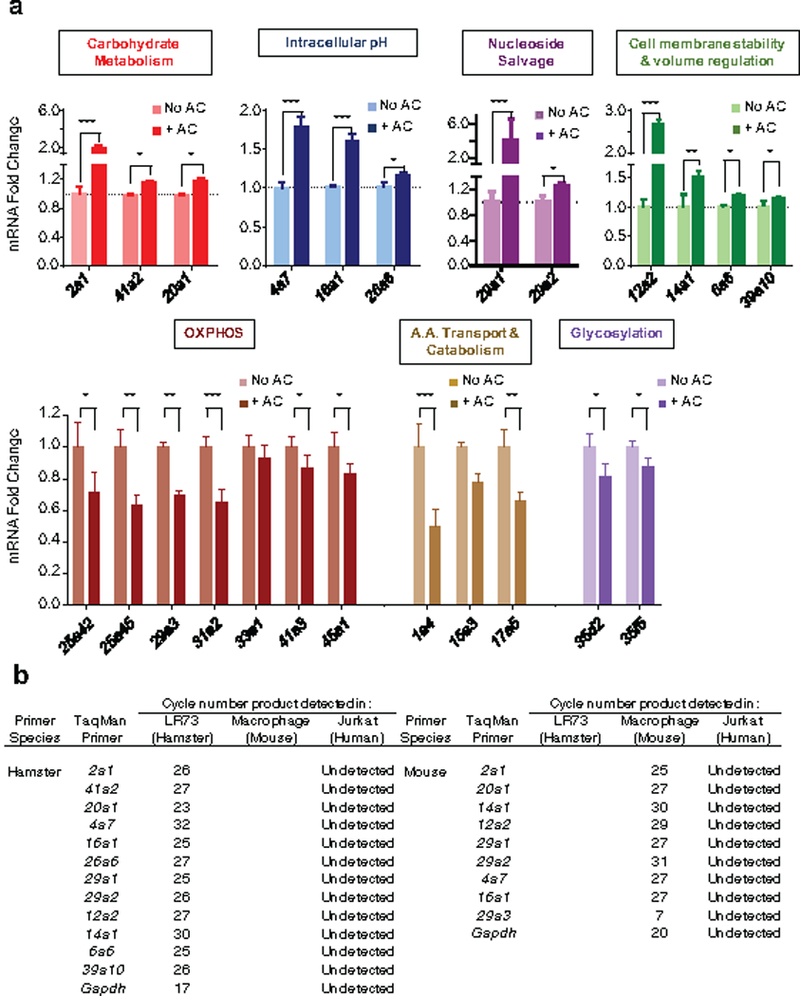
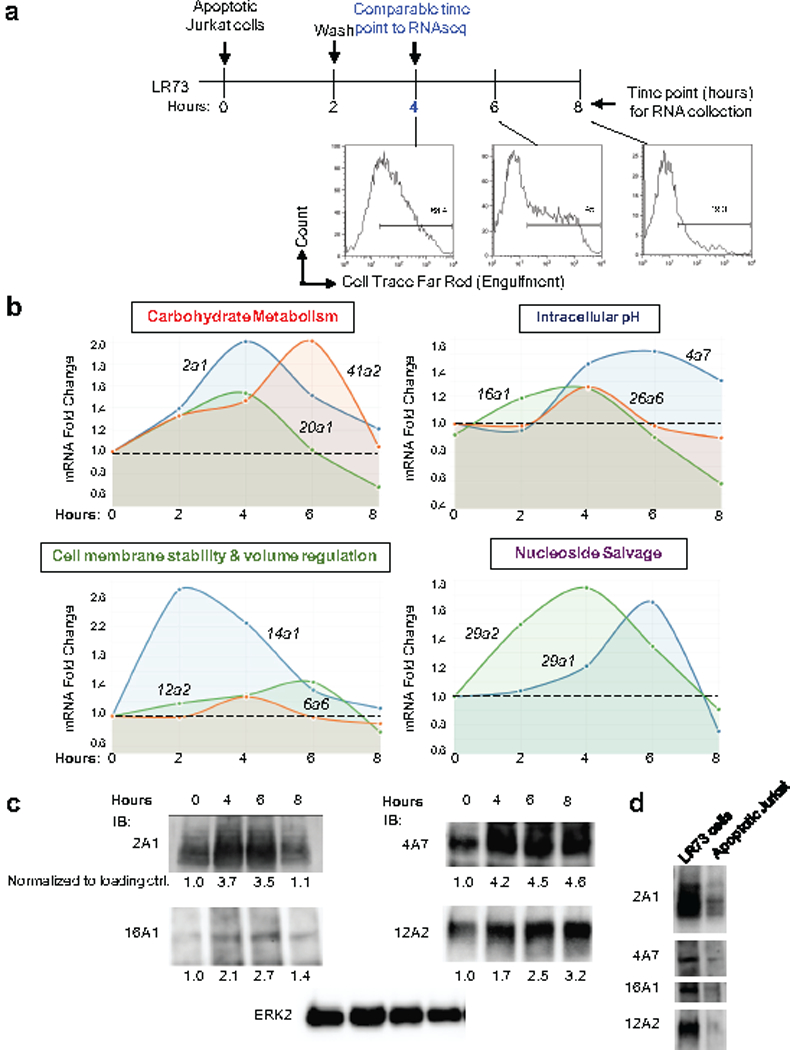
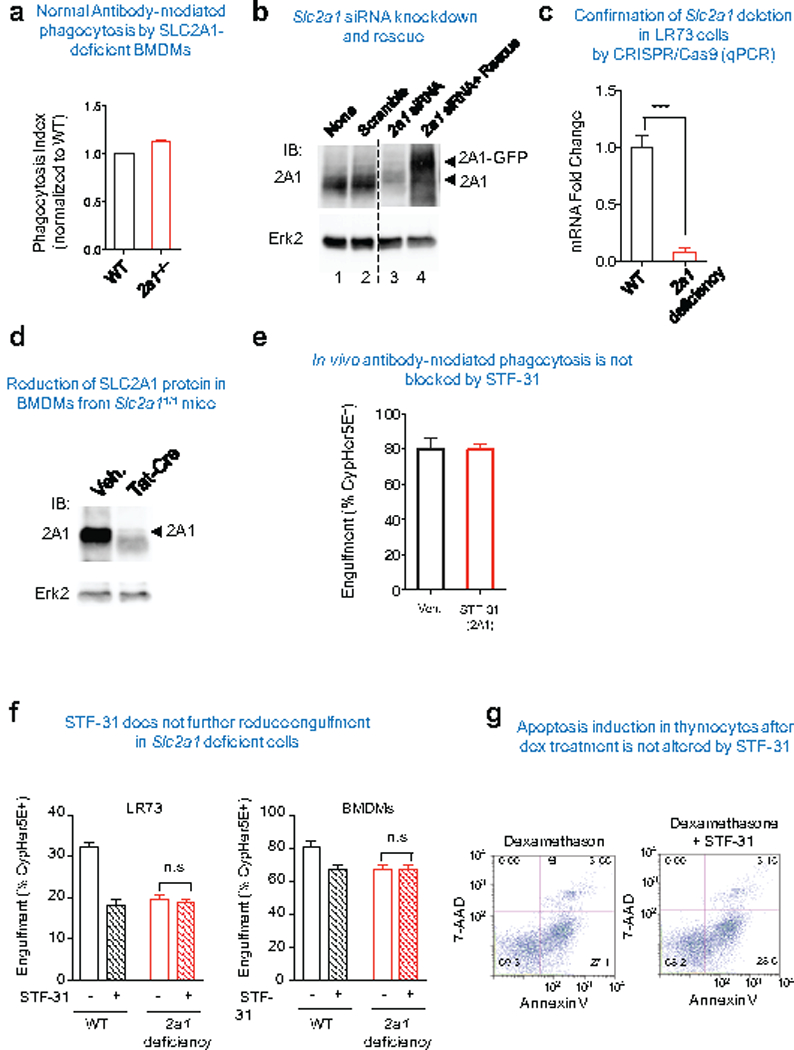
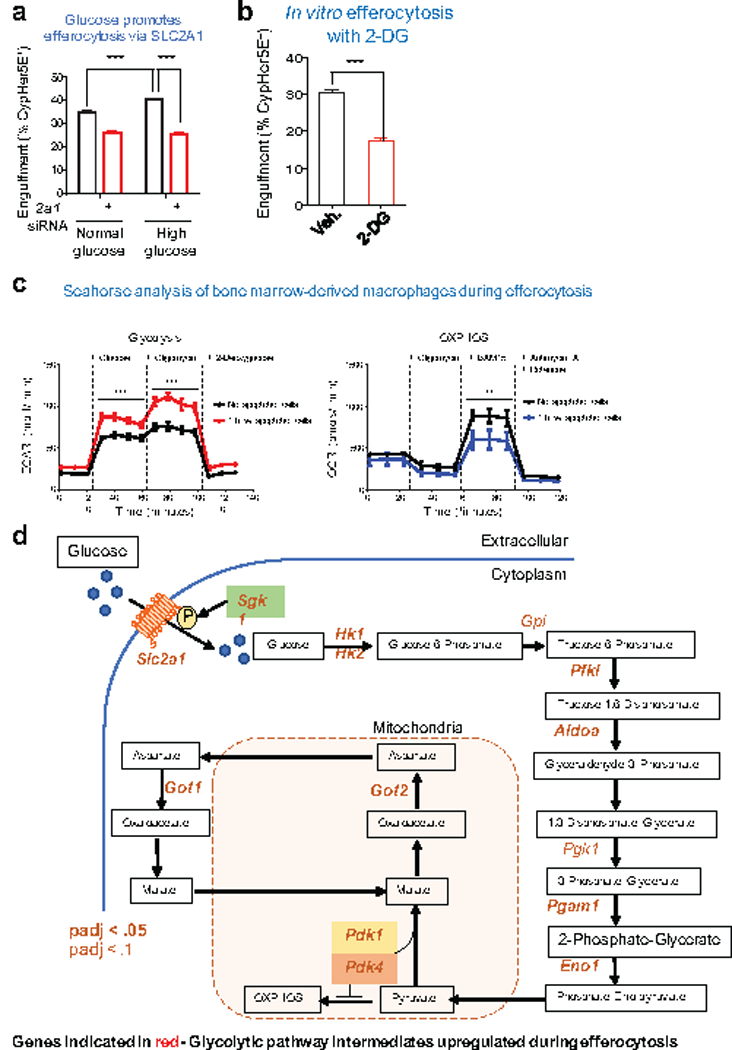
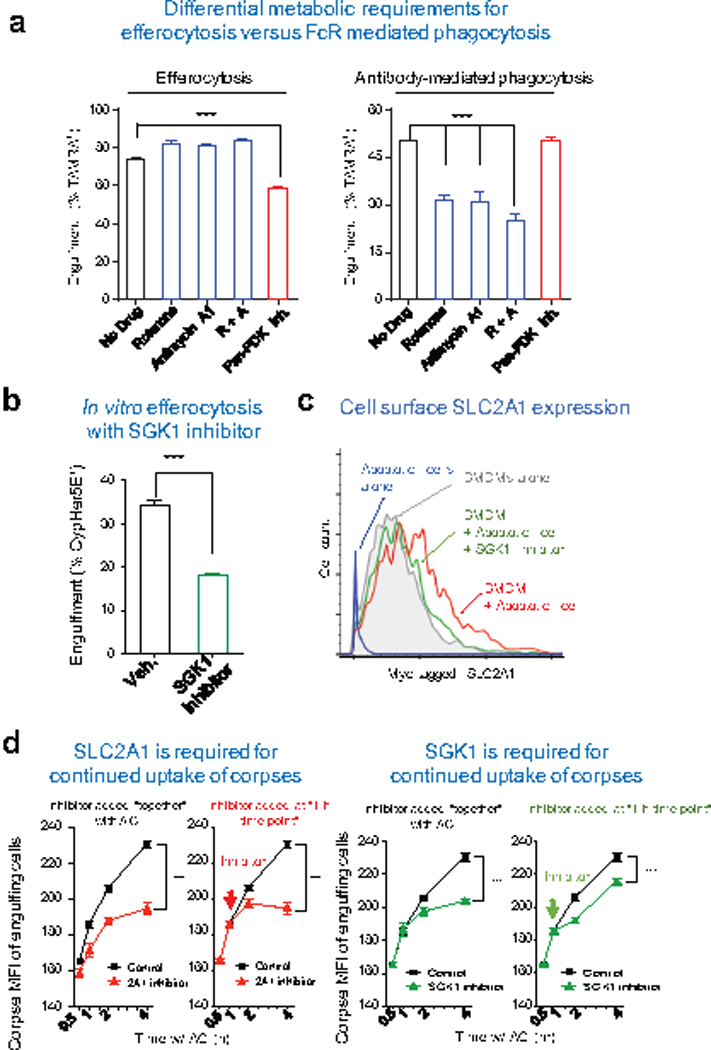
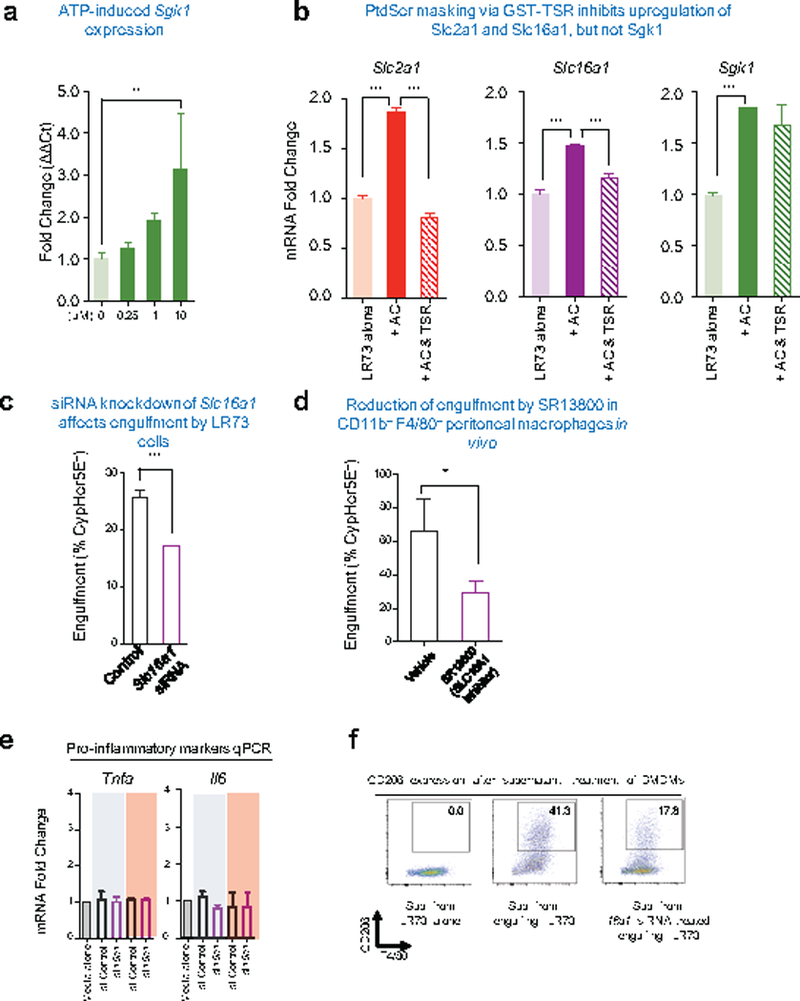
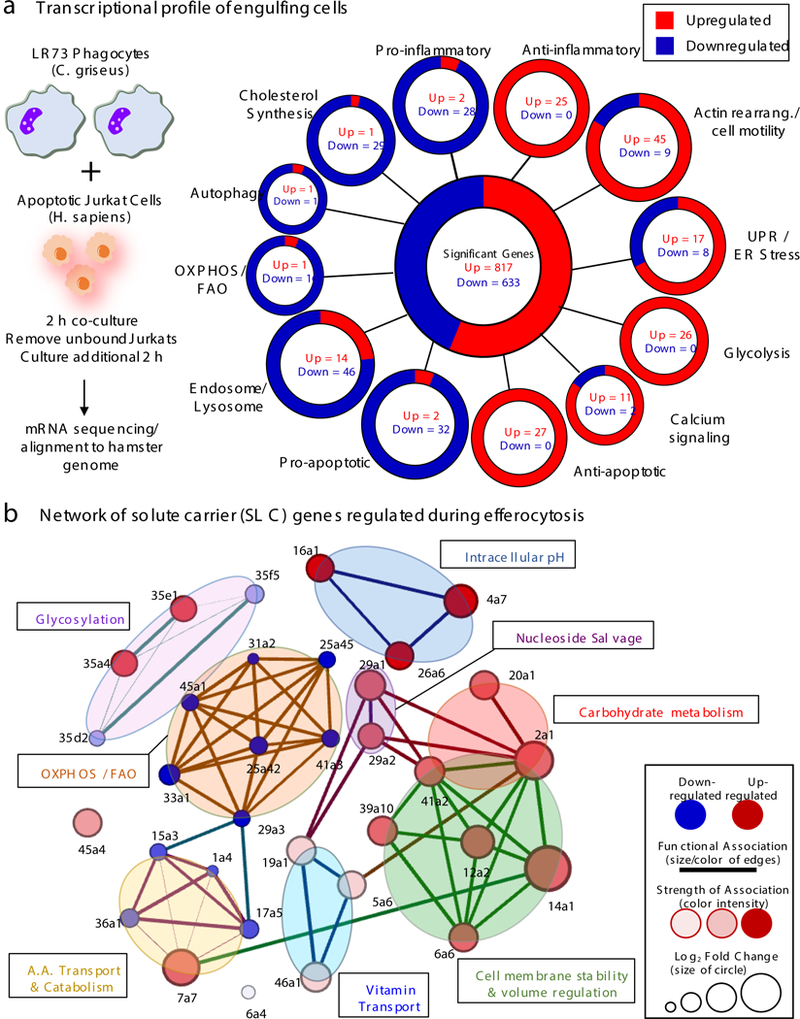
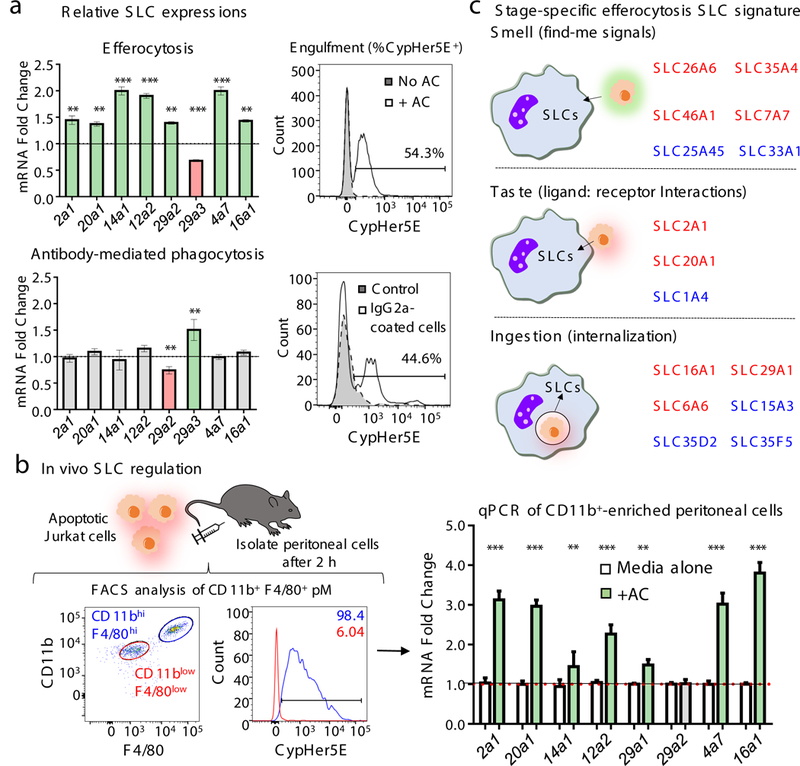
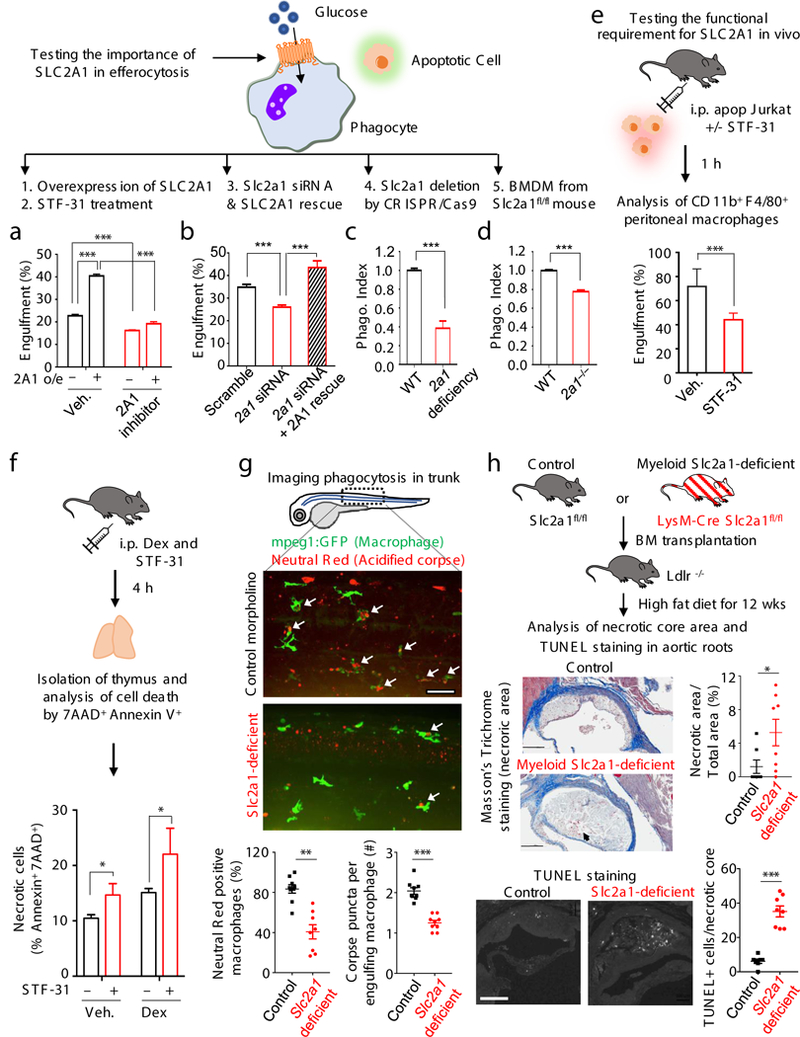
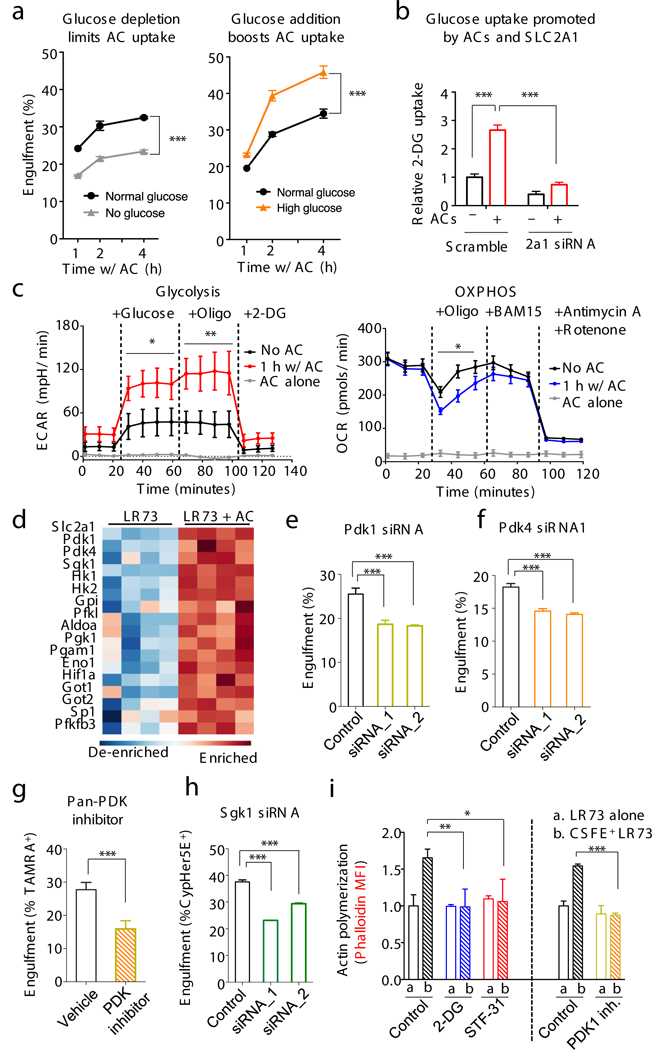
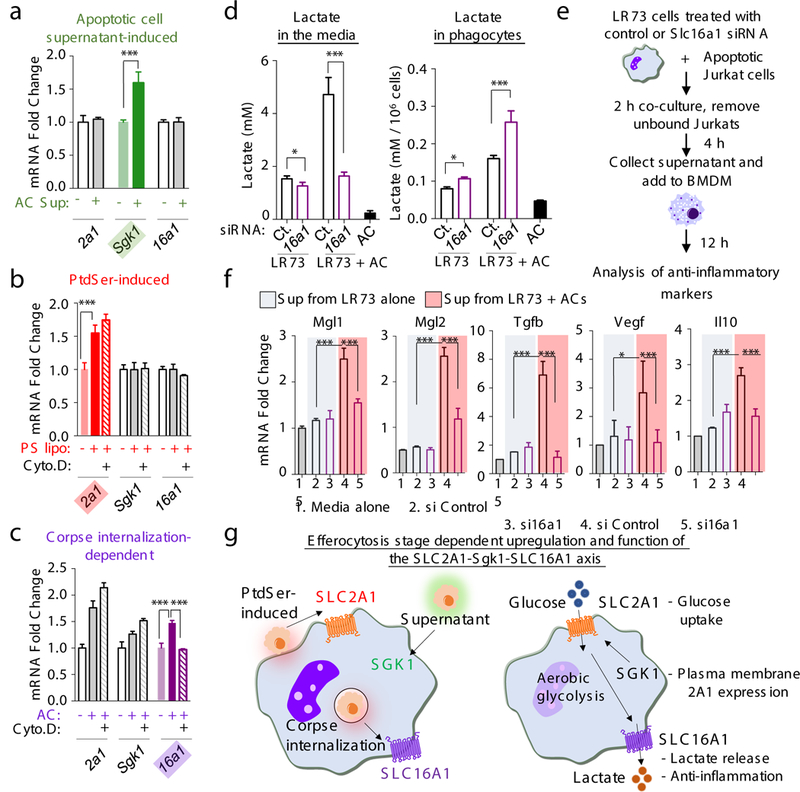
Development and routine tissue homeostasis require a high turnover of apoptotic cells. These cells are removed by professional and non-professional phagocytes via efferocytosis1. How a phagocyte maintains its homeostasis while coordinating corpse uptake, processing ingested materials and secreting anti-inflammatory mediators is incompletely understood1,2. Here, using RNA sequencing to characterize the transcriptional program of phagocytes actively engulfing apoptotic cells, we identify a genetic signature involving 33 members of the solute carrier (SLC) family of membrane transport proteins, in which expression is specifically modulated during efferocytosis, but not during antibody-mediated phagocytosis. We assessed the functional relevance of these SLCs in efferocytic phagocytes and observed a robust induction of an aerobic glycolysis program, initiated by SLC2A1-mediated glucose uptake, with concurrent suppression of the oxidative phosphorylation program. The different steps of phagocytosis2-that is, 'smell' ('find-me' signals or sensing factors released by apoptotic cells), 'taste' (phagocyte-apoptotic cell contact) and 'ingestion' (corpse internalization)-activated distinct and overlapping sets of genes, including several SLC genes, to promote glycolysis. SLC16A1 was upregulated after corpse uptake, increasing the release of lactate, a natural by-product of aerobic glycolysis3. Whereas glycolysis within phagocytes contributed to actin polymerization and the continued uptake of corpses, lactate released via SLC16A1 promoted the establishment of an anti-inflammatory tissue environment. Collectively, these data reveal a SLC program that is activated during efferocytosis, identify a previously unknown reliance on aerobic glycolysis during apoptotic cell uptake and show that glycolytic by-products of efferocytosis can influence surrounding cells.


Conflict of interest statement

The authors declare no competing financial interests. Correspondence and request for materials should be addressed to: ravi@virginia.edu

Figures

Extended Data Figure 1.
Extended Data Figure 1.. RNA preparation for the RNA-seq.
(a) Representative FACS plots of engulfment assays with LR73 hamster phagocytes (left) and Annexin V/7-AAD staining of apoptotic human Jurkat cells (right) in conditions matching experiments performed for RNAseq (2h with apoptotic cells followed by 2h rest in the absence of apoptotic cells). (b) Principal component analysis was performed on hamster genome-aligned RNAseq data as a quality control statistic (right).
Extended Data Figure 2.
Extended Data Figure 2.. SLC modified during efferocytosis.
(a) Solute carrier (SLC) genes are differentially regulated during efferocytosis. (left) Plotting of the 165 SLC genes detected by RNAseq of efferoytic LR73 cells highlighting the 19 significantly upregulated (red) and 14 downregulated (blue) SLC genes that were altered during efferocytosis. The 132 SLC genes that were not altered are located on the midline (black). The current genetic classifications of these 33 SLC genes altered during engulfment are shown (right). (b) Efferocytosis associated SLCs and their properties. Current genetic classification/functional linkages of the 33 SLCs modulated during apoptotic cell engulfment. Shown are the significantly upregulated and downregulated SLCs and the substrates they are known to transport grouped by predicted general function, as well as the known monogenic diseases and SNP/disease phenotype to which the specific SLCs have been linked.
Extended Data Figure 3.
Extended Data Figure 3.. qPCR confirmation of the RNAseq data
(a) qPCR determination of the modulation of specific SLCs during efferocytosis. Indicated SLC genes were tested for mRNA expression levels during engulfment assays performed similar to Fig. 1a. AC = apoptotic cell. *p < .05, **p < .01, ***p < .001. Data are representative of at least two independent experiments with 3–4 replicates per condition. (b) Table presents the cycle numbers for each species-specific qPCR primer. None of these primers gave signals when tested against human Jurkat cell mRNA (target) alone.
Extended Data Figure 4.
Extended Data Figure 4.. Dynamic expression of SLCs during efferocytosis.
(a) Schematic of the experiment and time points when RNA from phagocytes was assessed for specific Slc gene expression. Apoptotic Jurkat cells were added to LR73 cells and co-cultured for 2 h. Unbound/floating apoptotic cells were then washed, and LR73 cells were cultured in fresh media for the indicated amounts of time. Time scale bar reflects total time of experiment, such that the 4 h time point reflects 2 h with apoptotic cells plus 2hr subsequent incubation (to match the time frame used in our RNAseq experiment). Total RNA was subsequently isolated and qPCR for specific Slc genes was performed. Flow cytometry plots indicate that fluorescent signal from the internalized corpses are significantly degraded by the 8 h time point. (b) Expression of Slc genes are regulated over the time course of efferocytosis. Relative expression of mRNAs for specific slc genes belonging to different functional classes over the time course of engulfment is shown. Data are representative of three biological replicates. (c) Immunoblotting for the some of the SLCs modified during efferocytosis. Indicated SLCs were probed at various time points after addition of apoptotic cells. Quantification normalized to ERK2 is shown below representative blots. Quantification was done with Photoshop CS6 software, and then normalized to control ERK2. (d) Immunoblotting for the some of the SLCs in LR73 phagocytes and apoptotic Jurkat cells.
Extended Data Figure 5.
Extended Data Figure 5.. The role of SLC2A1 for efferocytosis.
(a) Slc2a1fl/fl BMDM were treated with or without Tat-Cre to delete Slc2a1. The cells were then incubated with IgG-coated Jurkat cells and engulfment was assessed by CypHer5E signal within the BMDM. The uptake by the control BMDM (not treated with Tat-Cre, and denoted WT) were set to 1. (b) siRNAs targeting of Slc2a1 down-modulates SLC2A1 protein expression. Shown are representative western blots of siRNA knockdown of Slc2a1 in LR73 cells versus scrambled siRNA. Also shown are LR73 cells expressing siRNA-resistant SLC2A1. (c) Slc2a1 deletion efficiency in Cas9-LR73 cells. Slc2a1 guide was introduced into Cas9-EGFP+ LR73 cell clones. The efficiency of Slc2a1 deletion was quantified using qPCR. (d) Introduction of TAT-Cre into Slc2a1flfl bone marrow-derived macrophages efficiently knocks down SLC2A1 protein expression. Slc2a1fl/fl bone marrow cells were treated with recombinant TAT-Cre during macrophage differentiation after isolation from the bone marrow. (e) STF-31 did not affect antibody-mediated phagocytosis by peritoneal macrophages. C57BL/6 mice were intraperitoneally injected with 10mg/kg of either STF-31 in X-VIVO media 1h prior to IgG-coated Jurkat cell injection. CypHer5E labeled Jurkat cells were injected intraperitoneally along with the drug. Mice were euthanized 1h later, peritoneal cells collected, and apoptotic cell engulfment by CD11b+ F4/80hi macrophages was analyzed by FACS. (f) Slc2a1-deficient LR73 cells or BMDMs were treated with STF-31, and the engulfment assay was conducted using CypHer5E-labeled apoptotic Jurkat cells. The CypHer5E+ phagocytic cells after 2h of incubation was determined by flow cytometry. n.s., not significant. Data are representative of at least two independent experiments with 3–4 replicates per condition. (g) The SLC2A1 inhibitor STF-31 does not increase 7AAD+ thymocytes in vitro. Isolated thymocytes were incubated with dexamethasone (10μM) with or without STF-31 (2mM). 4h later, the thymocytes cell death were addressed by Annexin+ 7-AAD+. Data are representative of two independent experiments.
Extended Data Figure 6.
Extended Data Figure 6.. The role of glycolytic genes for efferocytosis.
(a) The effect of physiological (1 mg/ml) or high (5mg/ml) glucose on apoptotic cell engulfment (2 h) in control and Slc2a1 siRNA-treated LR73 cells. Note that the enhanced engulfment due to higher glucose levels is lost in siRNA treated conditions. ***p < .001. Data are representative of at least three independent experiments with 3–4 replicates per condition. (b) Apoptotic cell engulfment by LR73 cells in the presence of the glucose analog 2-DG (10mM). ***p < .001. Data are representative of two independent experiments with 2–3 replicates per condition. (c) Bone marrow-derived macrophages undergo glycolytic flux during apoptotic cell clearance. Glycolytic flux and oxidative phosphorylation were measured during engulfment assays using Seahorse XF to assess extracellular acidification (ECAR, left panel) and oxygen consumption rates (OCR, right), respectively. Data are shown as mean +/− SD for ECAR (mpH/min) and OCR (pmol/min) over the course of standard glycolytic flux tests and cellular respiration tests. Data are representative of four replicates per condition. **p < .01, ***p < .001. (d) Genes within the glycolytic pathway that are significantly upregulated during apoptotic cell clearance. Shown is schematic of the glycolytic pathway and subsequent steps, with the enzymes that are significantly upregulated (determined via RNAseq) indicated in red.
Extended Data Figure 7.
Extended Data Figure 7.. Testing SGK1 and glycolysis in efferocytosis.
(a) Differential metabolic requirements by macrophages for efferocytosis versus antibody-mediated phagocytosis. Bone marrow-derived macrophages were co-cultured with apoptotic or antibody coated Jurkat cells. Mitochondrial respiration was inhibited by addition of the mitochondrial complex I inhibitor Rotenone (200nM), the mitochondrial complex III inhibitor Antimycin A1 (1μM), or both (R+A). Aerobic glycolysis was inhibited by the addition of the Pan-PDK inhibitor dichloroacetate (1mM). ***p < .001. Data are representative of three independent experiments. (b) SGK1 inhibition blocks efferocytosis in vitro. LR73 cells were treated with SGK1 inhibitor and uptake of CypHer5E labeled apoptotic Jurkat cells assessed. ***p < .001. (c) Bone marrow-derived macrophages (BMDM) from Glut1myc knock-in mice were co-cultured with apoptotic thymocytes with or without SGK1 inhibitor, GSK650394 (5μM), for 2 h, unbound apoptotic cells were washed, and the cell surface expression of SLC2A1 was measured by flow cytometry after staining for surface Myc-tag. Data are representative of at least two independent experiments. (d) Continued uptake of apoptotic thymocytes was determined by the mean fluorescent intensity (MFI, indicating of corpse-derived signal per phagocyte) of LR73 phagocytes over a time course of engulfment. SLC2A1 or SGK1 inhibitors were added at the beginning of engulfment (left) or 1h post apoptotic cell addition (right). ***p < .001. Data are representative of at least three independent experiments with 3–4 replicates per condition.
Extended Data Figure 8.
Extended Data Figure 8.. Tetsting SLC16A1 in efferocytosis.
(a) qPCR determination of Sgk1 expression phagocytes treated with ATP. LR73 cells were treated with indicated amount of ATP for 4h. Expression of Sgk1 was determined by qPCR using hamster-specific primers. **p < .01. Data are representative of at least two independent experiments with 3–4 replicates per condition. (b) qPCR determination of Slc2a1, Slc16a1, and Sgk1 expression in phagocytes after addition of the PtdSer masking peptide (GST-TSR) during efferocytosis. Apoptotic cells (AC) were added with or without TSR peptide (10ng/μl) for 4hr. Expressions of indicated genes were determined by qPCR using hamster-specific primers. ***p < .001. Data are representative of at least two independent experiments with 3–4 replicates per condition. (c) SLC16A1 inhibition blocks efferocytosis in vitro. LR73 cells were treated with Slc16a1 siRNA and uptake of CypHer5E labeled apoptotic Jurkat cells assessed. ***p < .001. (d) SLC16A1 inhibitor SR13800 dampens efferocytosis by peritoneal macrophages. C57BL/6 mice were intraperitoneally injected with SR13800 (10mg/kg) in X-VIVO media for 1h prior to apoptotic cell injection. CypHer5E-labeled apoptotic Jurkat cells were injected intraperitoneally along with the drug. After 1hr, apoptotic cell engulfment by CD11b+ F4/80hi peritoneal macrophages was analyzed by flow cytometry. *p < .05. Data are representative of two independent experiments with at least 6 mice in each group per experiment. (e and f) Supernatants from control LR73 or Slc16a1 siRNA-treated LR73 cells engulfing apoptotic cells was prepared, and added to BMDMs, and incubated for 12 h. Expression of inflammatory markers are determined by qPCR. ***p < .001. After 24 h, with supernatant incubation, CD206 and F4/80 expressions were determined by flow cytometry in BMDMs. Data are representative of two independent experiments with 2–3 replicates per condition.
Figure 1.
Figure 1.. Transcriptional programs initiated during efferocytosis.
(a) Phagocytes regulate distinct transcriptional modules during efferocytosis. LR73 hamster fibroblasts were incubated with apoptotic human Jurkat cells and RNAseq performed. Focusing on hamster-derived mRNA, the 1450 total genes modulated were categorized per primary function and sequence similarity. Significance was assigned if multiple-comparisons and adjusted p value per DESeq2 algorithm was < 0.1. Data are from four independent experimental replicates. (b) Differentially regulated SLC genes are represented using network analysis to determine family clusters (shaded areas) and connectedness between individual SLCs.
Figure 2.
Figure 2.. Specific SLC signatures induced during different contexts of efferocytosis.
(a) SLC signature during efferocytosis is distinct from antibody-mediated phagocytosis. Peritoneal macrophages were incubated with apoptotic or anti-CD3 (IgG)-coated Jurkat cells, and qPCR of mouse SLC genes performed. Upregulated (green), downregulated (red), and unchanged (grey) are shown. (right) CypHer5E fluorescence within macrophages engulfing the targets. **p < .01, ***p < .001. Two independent experiments with 3–4 replicates per condition. (b) SLC modulation in efferocytic peritoneal macrophages in vivo. (left) Flow cytometric profiles of CD11bhighF4/80high and CD11blowF4/80low macrophages, and engulfing peritoneal macrophages (CypHer5e+). (right) qPCR using mouse-specific primers. **p < .01, ***p < .001. Data represent two replicates with 6 mice per group/experiment. (c) Specific SLC signature during different stages of efferocytosis. RNAseq was performed using mRNA from LR73 cells treated (4hr) with supernatants of apoptotic cells, or CytoD-treated LR73 cells incubated with apoptotic cells. SLC genes altered by supernatant alone (Smell), and CytoD-sensitive SLCs (Ingestion) were used to identify ligand:receptor responding SLCs (Taste) (red, upregulated; blue, downregulated). For clarity, SLCs in more than one stage are not shown.
Figure 3.
Figure 3.. SLC2A1 promotes glucose uptake and efferocytosis.
(a-d) SLC2A1 function during efferocytosis addressed by five approaches. In b, ‘rescue’ used siRNA-resistant Slc2a1 cDNA. In c, deletion in BMDM from Slc2a1fl/fl mice was achieved via TAT-Cre. Phagocytosis index, % experimental / % control engulfment. ***p < .001. Data from >2 independent experiments with 3–4 replicates per condition. (e) The SLC2A1 inhibitor STF-31 reduces efferocytosis in vivo. (f) STF-31 promotes accumulation of necrotic thymocytes after dexamethasone-induced apoptosis in vivo. *p < .05. Data represent two independent experiments with 3–4 mice per group. (g) Targeting slc2a1 reduces efferocytosis in zebrafish. Tg(mpeg1:GFP) embryos were injected with control or slc2a1 morpholino. Neutral Red was used to preferentially stain acidic organelles. slc2al-targeted morphants (50hpf) displayed less apoptotic cell engulfment (Neutral Red-positive GFP-macrophages) in the trunk region, 3 areas and 3 fishes per group, mean±SD. **p < .01. (h) Increased necrotic atherosclerotic area and TUNEL+ cells after myeloid-specific deletion of Slc2a1. (top) Schematic of BM chimera using Slc2a1fl/fl and LysM-Cre Slc2a1fl/fl mice. (middle) Serial interrupted 5μm sections stained with Masson’s Trichrome. Representative photomicrographs and quantification of necrotic core area normalized to total area. (bottom) TUNEL staining and quantitation of TUNEL+ cells per necrotic core. 7–8 mice per group, mean±SEM. *p < .05, *p < .001. (Scale Bar = 200μm).
Figure 4.
Figure 4.. Glycolytic pathway intermediates facilitate efferocytosis.
(a) Efferocytosis is affected by media glucose concentration. Physiological glucose (1mg/ml, black), no glucose (grey), or high glucose (5mg/ml, orange). Glucose was supplemented when apoptotic cells were added. ***p < .001. Data from ≥3 independent experiments with 2–3 replicates per condition. (note: this differs from long-term glucose-free pretreatment of phagocytes). (b) Increased glucose uptake via SLC2A1 during efferocytosis. LR73s were co-cultured with apoptotic Jurkat cells (2hr), washed, and 2-DG uptake measured. ***p < .001. Data from two independent experiments with 3 replicates each. (c) Phagocytes increase glycolysis during apoptotic cell clearance. Glycolysis and oxidative phosphorylation were measured during efferocytosis (with Seahorse XF) via extracellular acidification (ECAR, mpH/min) and oxygen consumption (OCR, pmol/min) rates. Mean+/−SD is shown. Two replicates per condition in two independent experiments. *p < .05, **p < .01. (d) Heatmap showing upregulation of glycolysis-associated genes during efferocytosis. (e-h) Effect of siRNA targeting of Pdk1, Pdk4 or Sgk1 in LR73 cells (e, f, h) or pan-PDK inhibitor (g) on efferocytosis. ***p< .001. Data represent three independent experiments with 3–4 replicates per condition. (i) F-actin formation during efferocytosis. LR73 phagocytes were mixed with CFSE-labeled apoptotic thymocytes (30min), stained with phalloidin (F-actin), and assessed by flow cytometry (MFI shown). PDK1 inhibitor data were performed separately. *p < .05, **p < .01, ***p < .001. Data represent ≥3 independent experiments with 3–4 replicates.
Figure 5.
Figure 5.. SLC16A1-mediated lactate release promotes an anti-inflammatory environment.
(a-c) qPCR of Slc2a1, Slc16a1, and Sgk1 during distinct steps of efferocytosis. Supernatants from apoptotic cells, PtdSer-containing liposomes, or apoptotic cells (AC) were added to LR73 cells with or without cytochalasin D (1μM) for 4h, and qPCR performed. ***p < .001. (d) Lactate release from efferocytic phagocytes. LR73 cells (control or Slc16a1 siRNA) were incubated with apoptotic cells, washed, incubated an additional 4h, and lactate measured. ***p < .001. *p < .05. Data in a-d represent two independent experiments with 3–4 replicates per condition. (e) Schematic of supernatant preparation from LR73 phagocytes, adding supernatants to BMDMs, and analysis. (f) Determination of anti-inflammatory genes by qPCR. ***p < .001. Data represent two independent experiments with 2–3 replicates per condition. (g) Schematic of the upregulation and function of the SLC2A1-SGK1-SLC16A1 axis during efferocytosis.

Comment in

References

    1. Arandjelovic S & Ravichandran KS Phagocytosis of apoptotic cells in homeostasis. Nat Immunol 16, 907–917, doi:10.1038/ni.3253 (2015). - DOI - PMC - PubMed
    1. Elliott MR & Ravichandran KS The Dynamics of Apoptotic Cell Clearance. Dev Cell 38, 147–160, doi:10.1016/j.devcel.2016.06.029 (2016). - DOI - PMC - PubMed
    1. Colegio OR et al. Functional polarization of tumour-associated macrophages by tumour-derived lactic acid. Nature 513, 559–563, doi:10.1038/nature13490 (2014). - DOI - PMC - PubMed
    1. A-Gonzalez N et al. Phagocytosis imprints heterogeneity in tissue-resident macrophages. J Exp Med 214, 1281–1296, doi:10.1084/jem.20161375 (2017). - DOI - PMC - PubMed
    1. Cummings RJ et al. Different tissue phagocytes sample apoptotic cells to direct distinct homeostasis programs. Nature 539, 565–569, doi:10.1038/nature20138 (2016). - DOI - PMC - PubMed

Publication types

MeSH terms