. 2018 Nov;563(7733):696-700.
doi: 10.1038/s41586-018-0728-4. Epub 2018 Nov 21.

Helios is a key transcriptional regulator of outer hair cell maturation

Affiliations

Helios is a key transcriptional regulator of outer hair cell maturation

Lauren Chessum et al. Nature. 2018 Nov.

Abstract

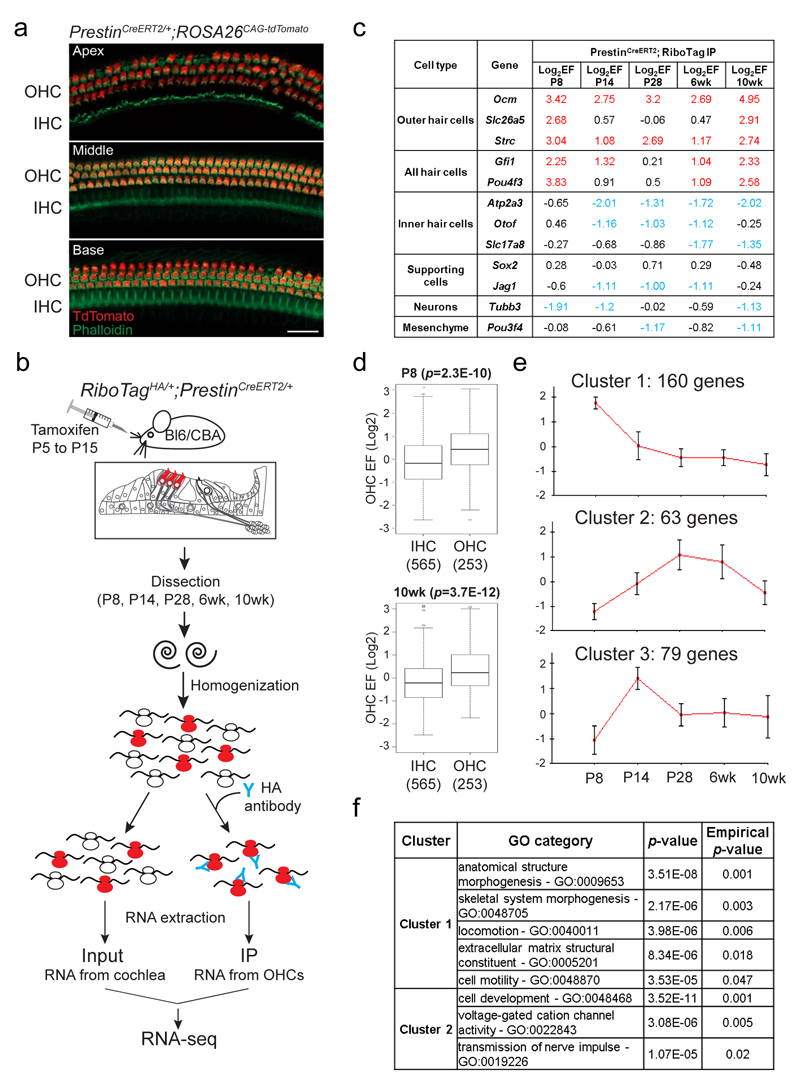
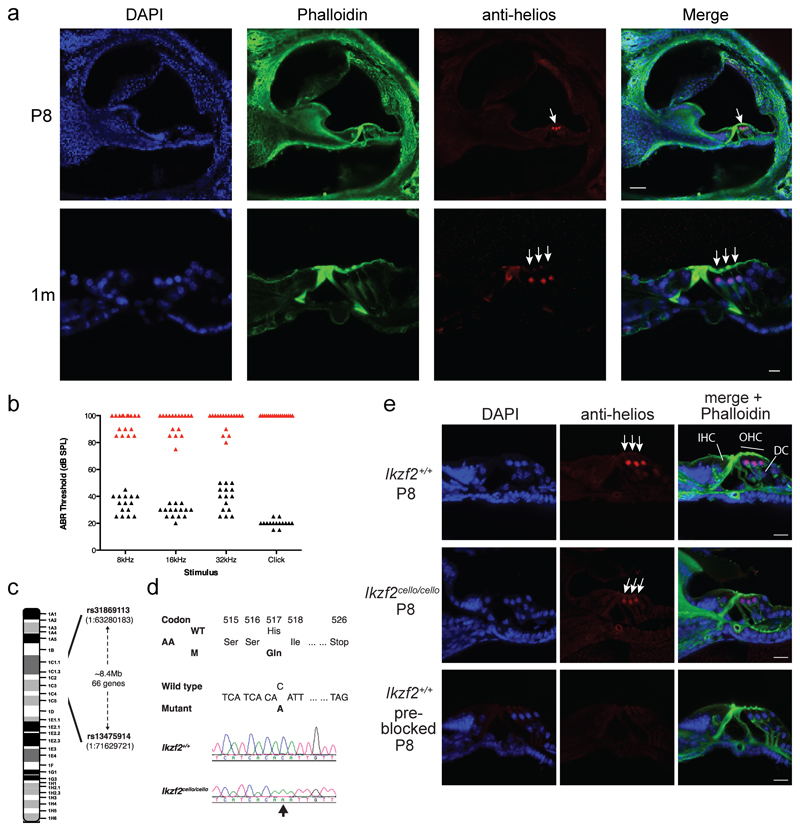
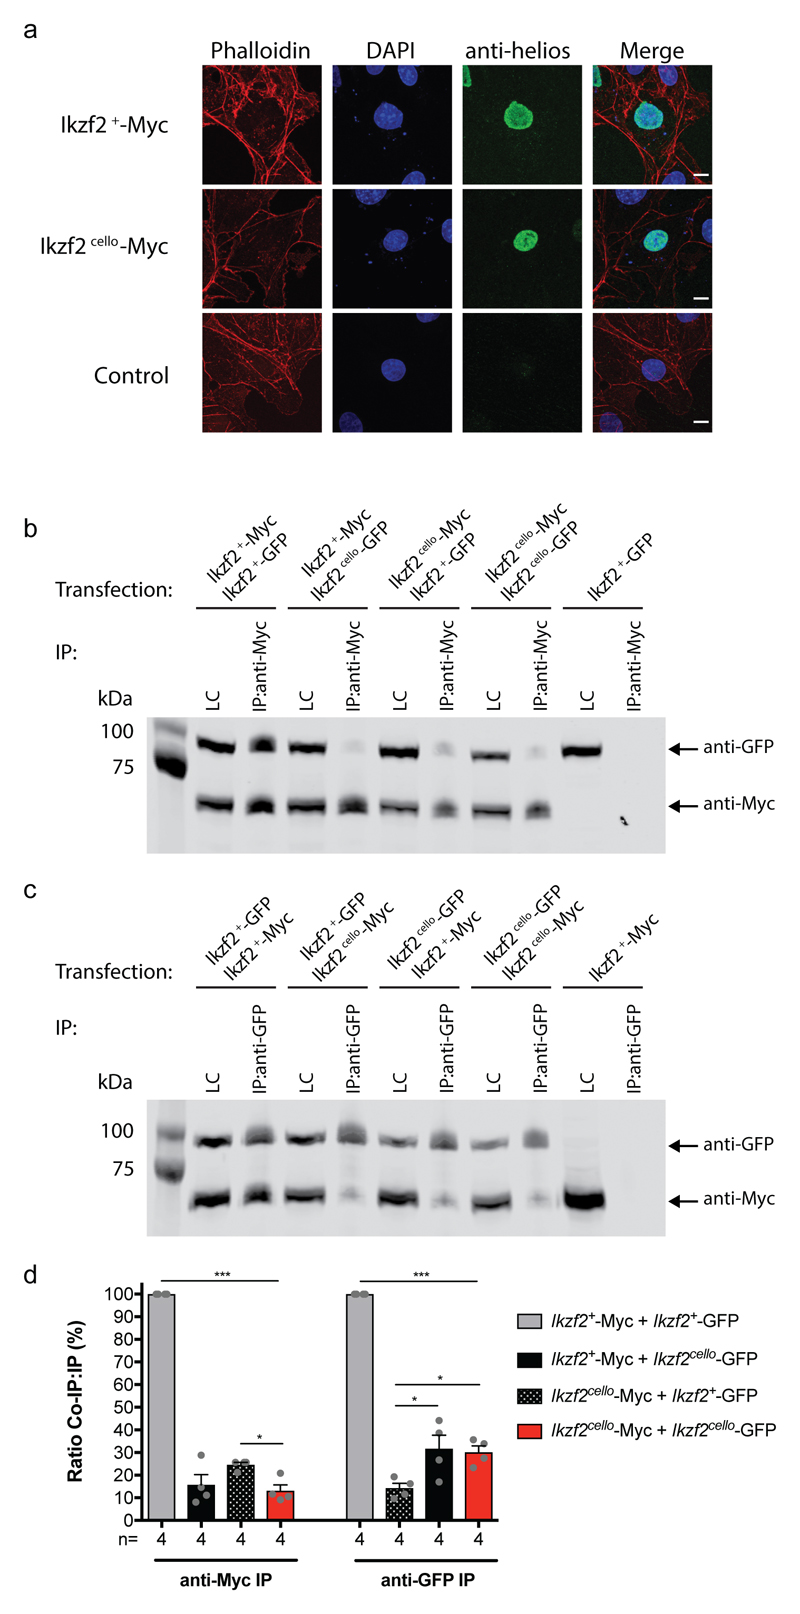
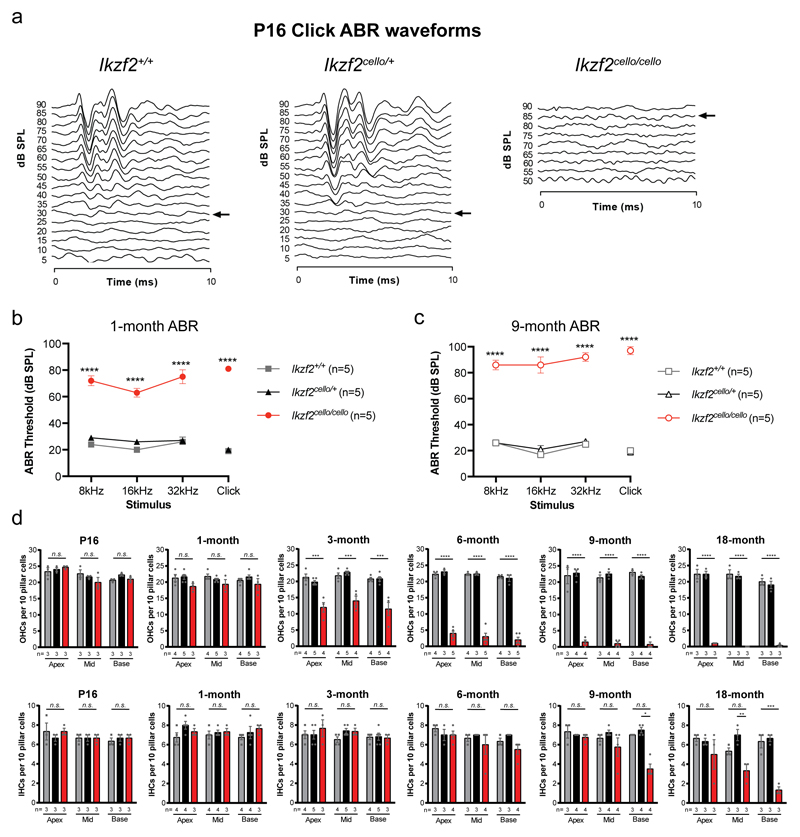
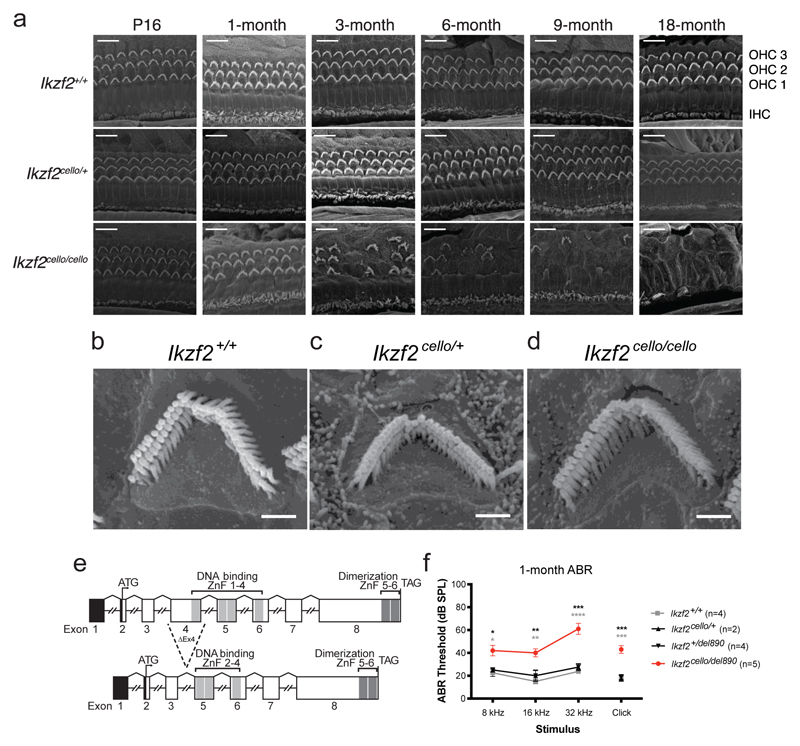
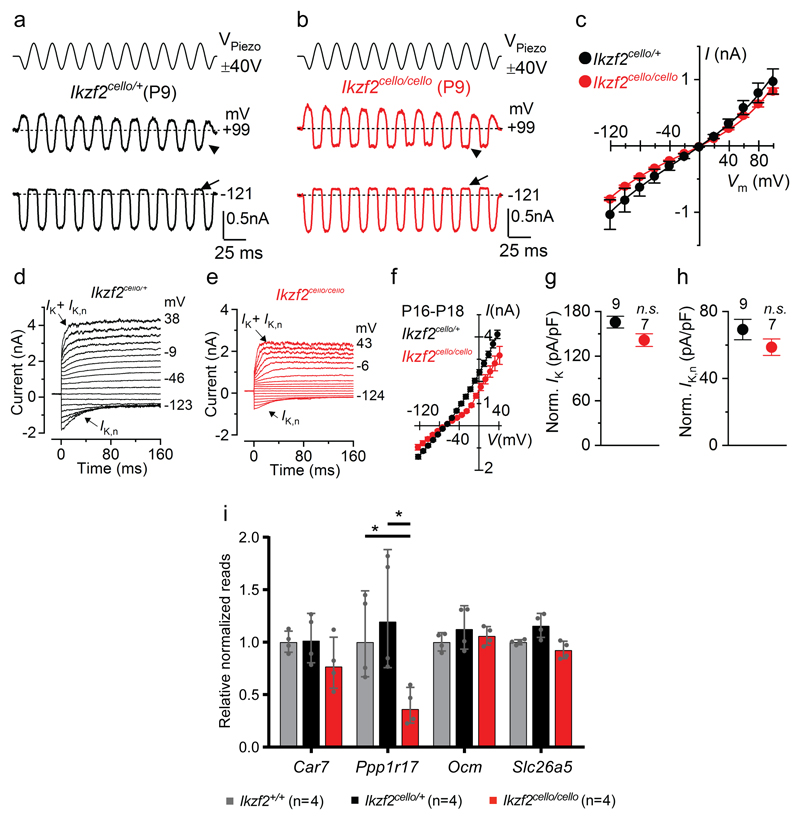
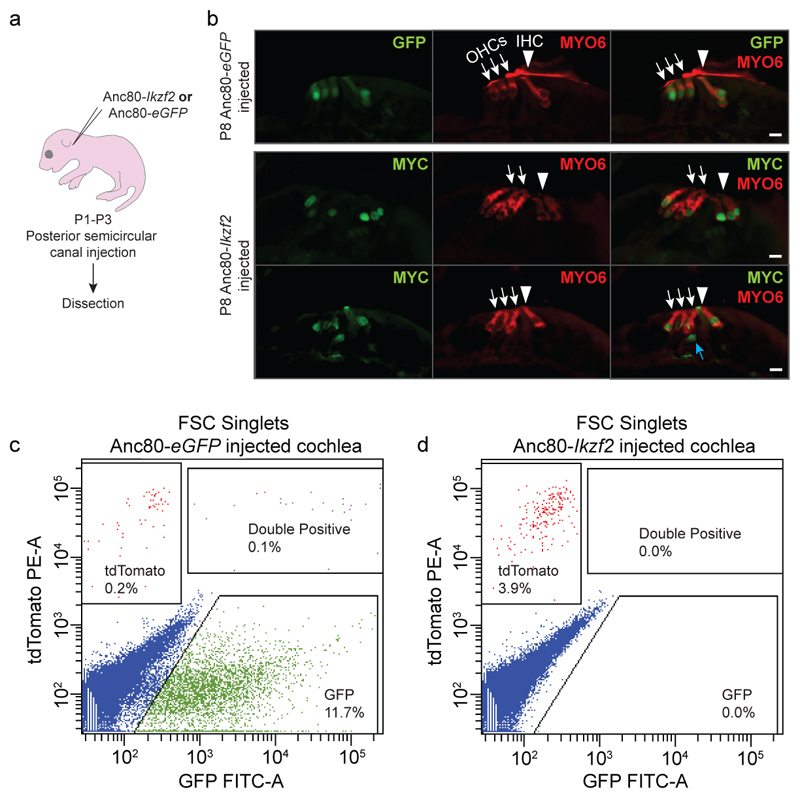
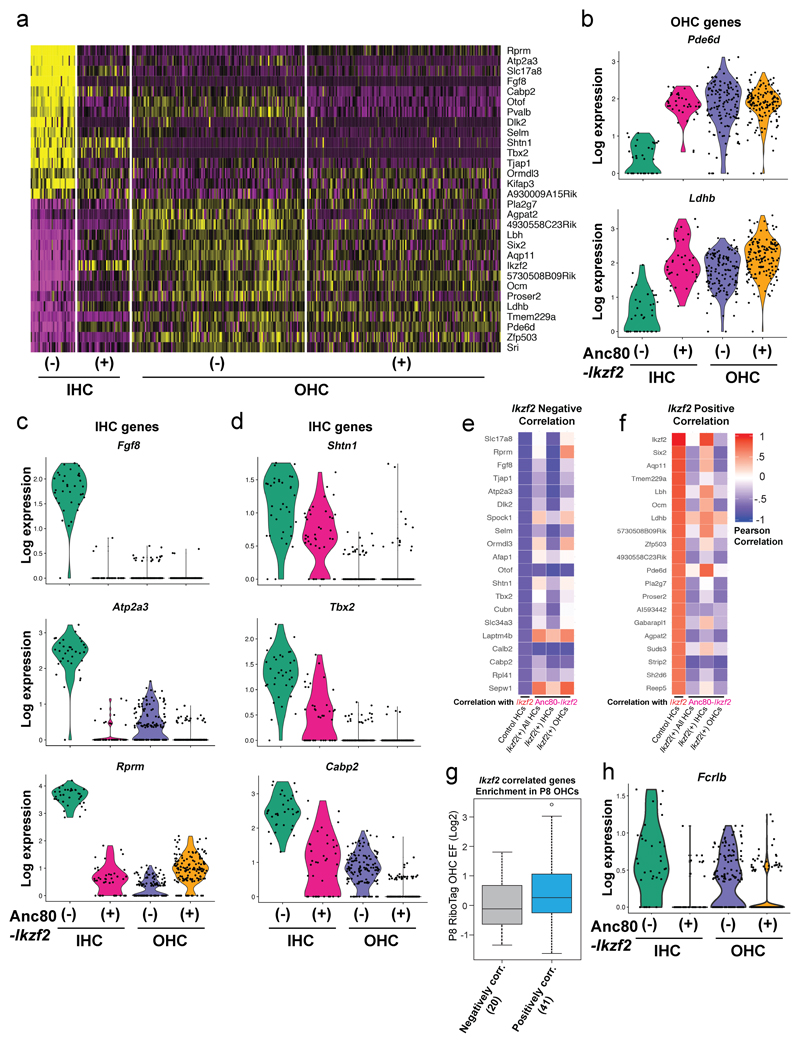
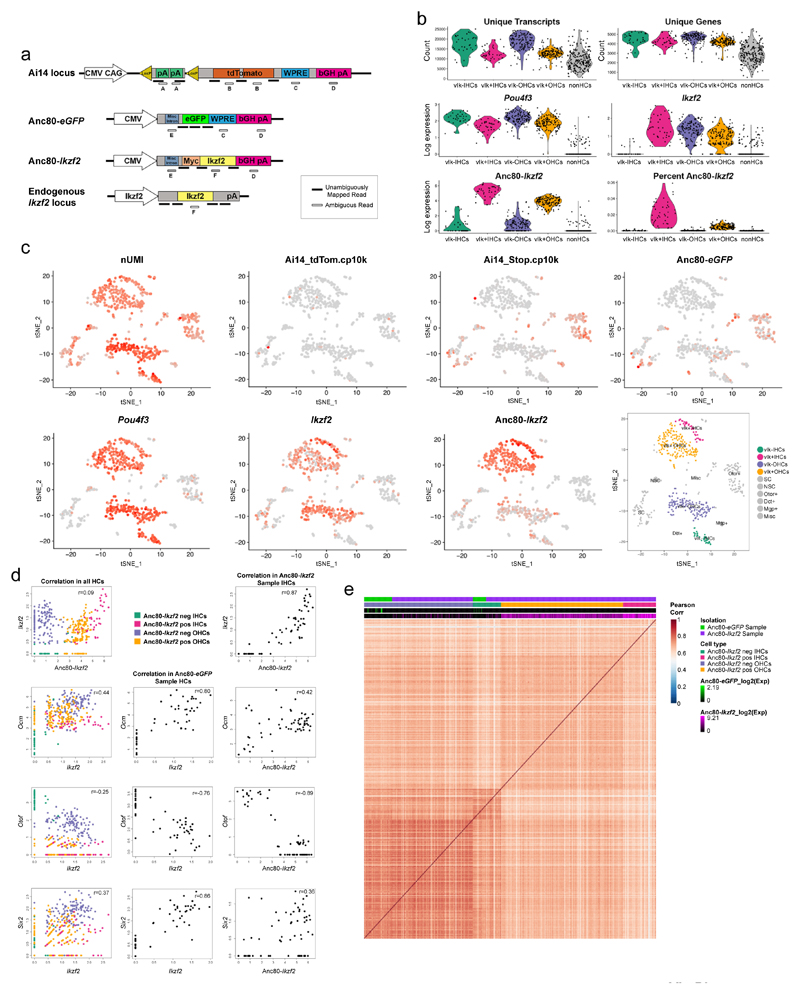
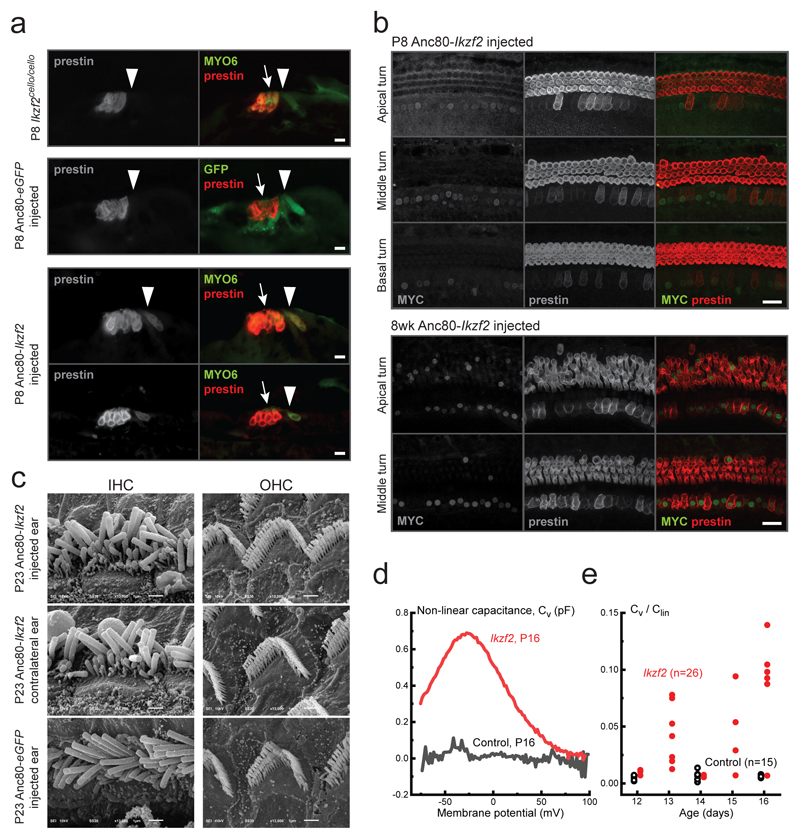
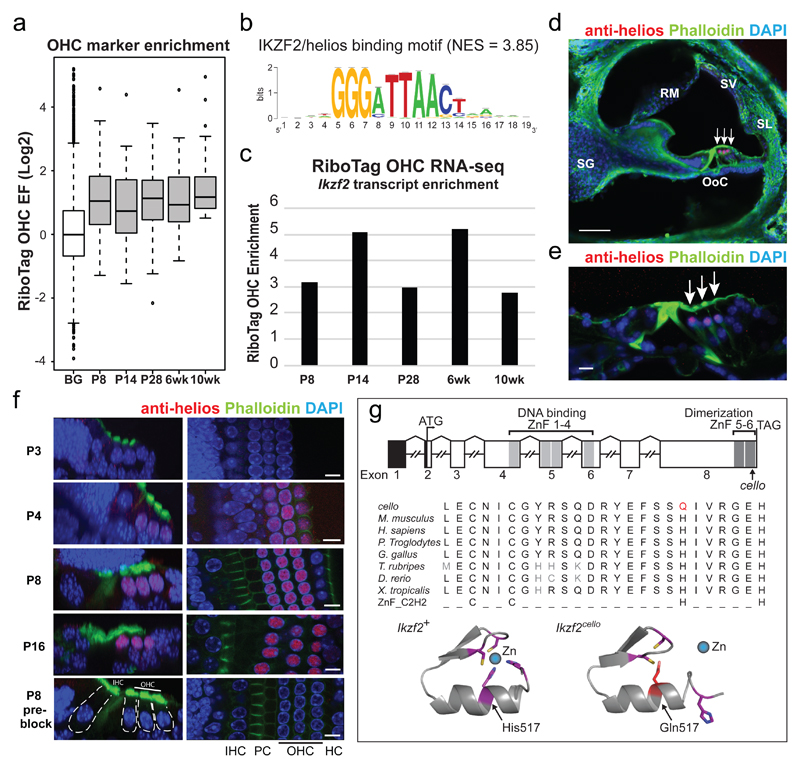
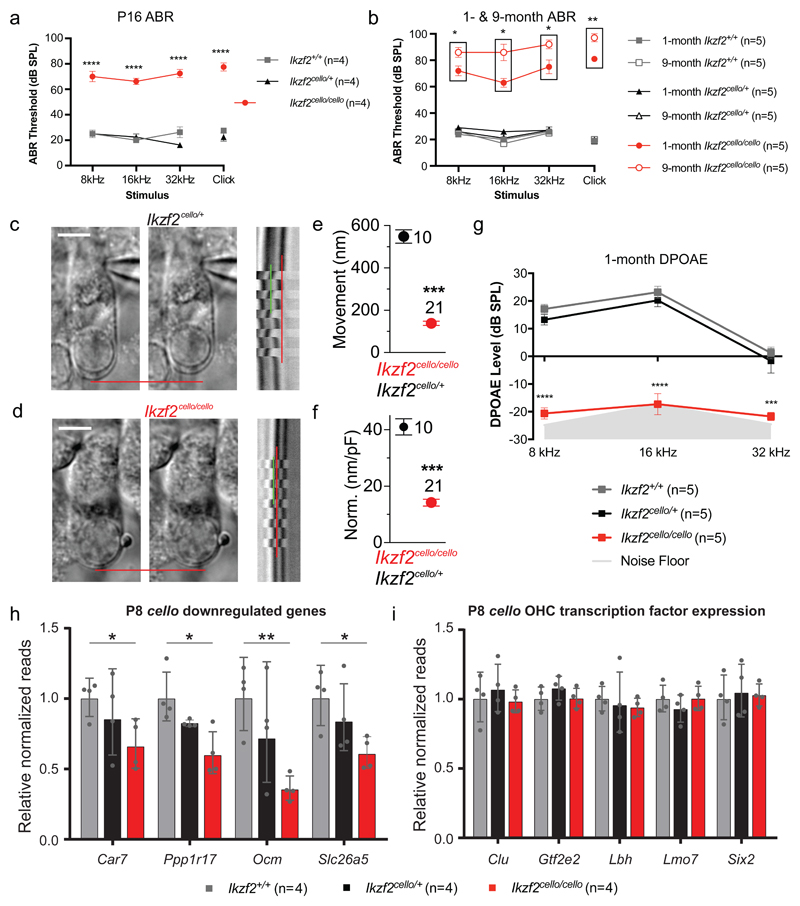
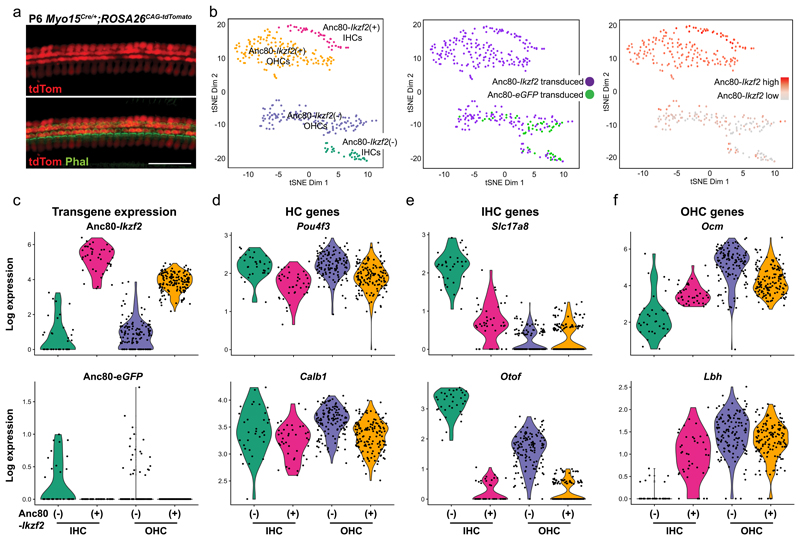
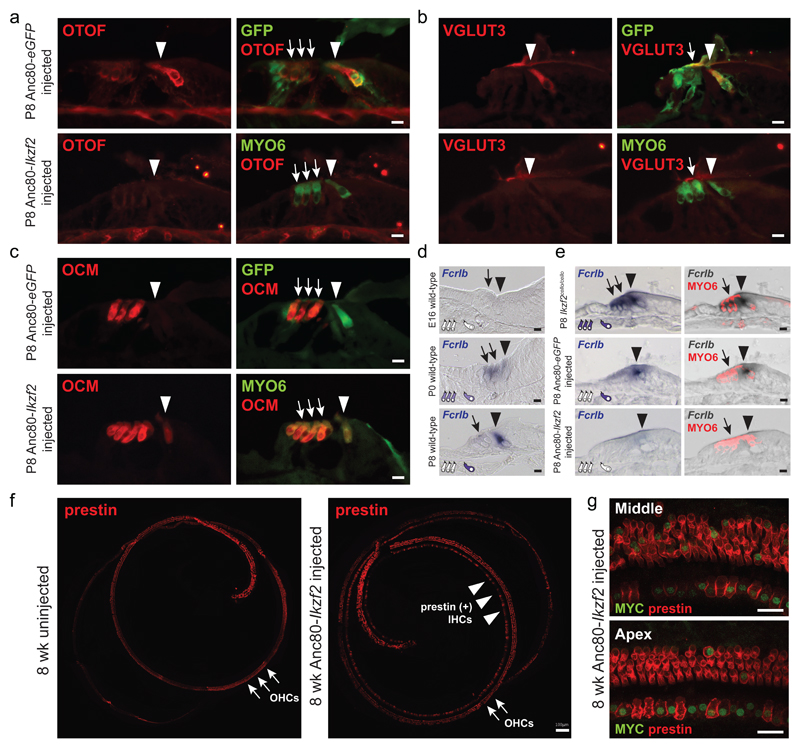
The sensory cells that are responsible for hearing include the cochlear inner hair cells (IHCs) and outer hair cells (OHCs), with the OHCs being necessary for sound sensitivity and tuning1. Both cell types are thought to arise from common progenitors; however, our understanding of the factors that control the fate of IHCs and OHCs remains limited. Here we identify Ikzf2 (which encodes Helios) as an essential transcription factor in mice that is required for OHC functional maturation and hearing. Helios is expressed in postnatal mouse OHCs, and in the cello mouse model a point mutation in Ikzf2 causes early-onset sensorineural hearing loss. Ikzf2cello/cello OHCs have greatly reduced prestin-dependent electromotile activity, a hallmark of OHC functional maturation, and show reduced levels of crucial OHC-expressed genes such as Slc26a5 (which encodes prestin) and Ocm. Moreover, we show that ectopic expression of Ikzf2 in IHCs: induces the expression of OHC-specific genes; reduces the expression of canonical IHC genes; and confers electromotility to IHCs, demonstrating that Ikzf2 can partially shift the IHC transcriptome towards an OHC-like identity.


Conflict of interest statement

The authors declare no competing financial interests.

Figures

Extended Data Figure 1
Extended Data Figure 1. RiboTag immunoprecipitation enriches for known OHC-expressed transcripts.
(a) Representative prestinCreERT2/+;ROSA26CAG-tdTomato cochlear whole-mount. Prestin-CreERT2-driven tdTomato expression is OHC-specific at P21 (n=1). Scale=20 μm. (b) Schematic of the RiboTag immunoprecipitation protocol. Red OHCs represent Cre/HA-tagged ribosome expression. (c) RiboTag RNA-seq log2 enrichment and depletion of transcripts for known inner ear cell type markers (enrichment factor (EF) = log2(IP/input)). (d) Genes at least 2-fold enriched in IHCs (n = 565 genes) or OHCs (n = 253 genes) in the dataset of Liu et al. are significantly depleted and enriched, respectively, by the RiboTag OHC immunoprecipitation (two-sided Wilcoxon's test). This was true for all time points examined. Black line represents median EF, box demarcates 1st and 3rd quartiles, whiskers demarcate 1st and 3rd quartiles ± 1.5×IQR values, dots represent single outliers. (e) Clustering of genes differentially expressed across OHC postnatal development (error bars = SD). Prior to clustering, expression levels were standardized to mean=0 and SD=1. (f) Enriched gene ontology (GO) functional categories identified for the gene clusters in (e) (cluster 1 n=160 genes, cluster 2 n=63 genes). No significantly enriched GO categories were found for cluster 3 (n=79 genes). Enrichment and statistical analyses were performed using the EXPANDER implemented tool TANGO.
Extended Data Figure 2
Extended Data Figure 2. Auditory phenotyping, SNP mapping and whole-genome sequencing of mouse pedigree MPC173, subsequently named cello.
(a) Specific expression of helios can be seen in the nuclei of wild-type P8 OHCs (white arrow, n=3 biologically independent samples, scale=50 μm), and is maintained in wild-type OHCs at 1-month (white arrows, n=3 biologically independent samples, scale=10 μm). (b) Auditory brainstem response phenotyping of pedigree MPC173 at 9-months of age identified 17 biologically independent animals with elevated hearing thresholds (red triangles) compared to their normal hearing colony mates (n=15 biologically independent animals, black triangles). (c) The mutation mapped to an 8.4 Mb region on Chromosome 1 between SNPs rs31869113 and rs13475914 (Chr1:63280183-71629721), containing 66 genes. (d) Detection of a non-synonymous mutation in cello. DNA sequencing identified a nucleotide transversion (c.1551C>A) in the Ikzf2 gene at codon 517, thus altering the wild-type (WT) sequence CAC, encoding a histidine (His), to the mutant (M) sequence CAA, encoding a glutamine (Gln). Electropherograms derived from a cello mutant mouse (Ikzf2cello/cello) and a wild-type colony mate (Ikzf2+/+) control showing the sequence surrounding Ikzf2 nucleotide 1551 (indicated by an arrow). (e) Helios is expressed in the OHC nuclei of both Ikzf2+/+ and Ikzf2cello/cello mice at P8 (n=3 biologically independent samples per genotype). Loss of labelling when the anti-helios antibody is ‘pre-blocked’ confirms specificity (n=1 biologically independent sample). Scale=20 μm.
Extended Data Figure 3
Extended Data Figure 3. The Ikzf2cello mutation disrupts helios homodimerization.
(a) Cos-7 cells transfected with Ikzf2+- or Ikzf2cello-Myc. Nuclear localization is unaffected by the Ikzf2cello mutation (n=2 biologically independent experiments). Scale=10 μm. (b) Co-immunoprecipitation (IP) of Myc-tagged (~62 kDa) and GFP-tagged (~88 kDa) Ikzf2+ and Ikzf2cello constructs. Transfected cell lysates were immunoprecipitated using an anti-Myc antibody and analysed by western blotting with both anti-Myc and anti-GFP antibodies. Results show that wild-type Ikzf2+ helios can dimerize, but that dimerization is impaired by the cello mutation. kDa = kilodaltons, LC = cell lysate loading control. (c) Reciprocal immunoprecipitation reactions using an anti-GFP antibody confirm dimerization of wild-type Ikzf2+helios and reduced dimerization of mutant Ikzf2cello helios. kDa = kilodaltons, LC = cell lysate loading control. (d) Quantification of Co-IP western blots. Band intensities were determined and used to calculate the relative ratio of Co-IP to IP signal. Data shown are averaged percentages ± s.e.m. (n=4 biologically independent experiments). Myc IP p-values: Ikzf2+ -Myc + Ikzf2+-GFP vs Ikzf2+ -Myc + Ikzf2cello-GFP <0.0001, Ikzf2+ -Myc + Ikzf2+-GFP vs Ikzf2cello -Myc + Ikzf2+-GFP <0.0001, Ikzf2+ -Myc + Ikzf2+-GFP vs Ikzf2cello -Myc + Ikzf2cello-GFP <0.0001, Ikzf2+ -Myc + Ikzf2cello-GFP vs Ikzf2cello -Myc + Ikzf2+-GFP = 0.1488, Ikzf2+ -Myc + Ikzf2cello-GFP vsIkzf2cello -Myc + Ikzf2cello-GFP = 0.9020, Ikzf2cello -Myc + Ikzf2+-GFP vs Ikzf2cello -Myc + Ikzf2cello-GFP = 0.0476. GFP IP p-values: Ikzf2+ -GFP + Ikzf2+-Myc vs Ikzf2+ -GFP + Ikzf2cello-Myc <0.0001, Ikzf2+ -GFP + Ikzf2+-Myc vsIkzf2cello -GFP + Ikzf2+-Myc <0.0001, Ikzf2+ -GFP + Ikzf2+-Myc vs Ikzf2cello -GFP + Ikzf2cello-Myc <0.0001, Ikzf2+ -GFP + Ikzf2cello-Myc vs Ikzf2cello -GFP + Ikzf2+-Myc = 0.0202, Ikzf2+ -GFP + Ikzf2cello-Myc vsIkzf2cello -GFP + Ikzf2cello-Myc = 0.0346, Ikzf2cello -GFP + Ikzf2+-Myc vs Ikzf2cello -GFP + Ikzf2cello-Myc = 0.9894. Significance was assessed by one-way ANOVA with Tukey post-hoc test. See Supplementary Fig.1 for source images.
Extended Data Figure 4
Extended Data Figure 4. Auditory function and HC bundle survival in cello mice.
(a) Representative click ABR waveforms for Ikzf2+/+, Ikzf2cello/+ and Ikzf2cello/cello littermates at P16 (n=4 biologically independent animals per genotype). (b-c) Averaged ABR thresholds for cello mice at 1-month of age (b, n=5 biologically independent animals per genotype) and 9-months of age (c, n=5 biologically independent animals per genotype). Age-matched Ikzf2+/+ and Ikzf2cello/+ controls display thresholds within the expected range (15 – 30 dB SPL) at all time-points tested. Data shown are averaged thresholds ± s.e.m. 1-month Ikzf2cello/cello vs 1-month Ikzf2+/+ (b) p-values: 8 kHz<0.0001, 16 kHz <0.0001, 32 kHz <0.0001, Click <0.0001. 1-month Ikzf2cello/cello vs 1-month Ikzf2cello/+ (b) p-values: 8 kHz <0.0001, 16 kHz <0.0001, 32 kHz <0.0001, Click <0.0001. 9-month Ikzf2cello/cello vs 9-month Ikzf2+/+ (b) p-values: 8 kHz <0.0001, 16 kHz <0.0001, 32 kHz <0.0001, Click <0.0001. 9-month Ikzf2cello/cello vs 9-month Ikzf2cello/+ (b) p-values: 8 kHz <0.0001, 16 kHz<0.0001, 32 kHz <0.0001, Click <0.0001. Significance was assessed by one-way ANOVA with Tukey post-hoc test. (d) OHC and IHC bundle counts for cello mice from P16 to 18-months of age. Data shown are averaged number of HC bundles adjacent to ten pillar cells ± s.e.m. n.s. non-significant, *p<0.05, **p<0.01, ***p<0.001, ****p<0.0001, one-way ANOVA with Tukey post-hoc test. Number of biologically independent samples for OHC bundle counts: P16 Ikzf2+/+ n=3, P16 Ikzf2cello/+ n=3, P16 Ikzf2cello/cello n=3; 1-month Ikzf2+/+ n=4, 1-month Ikzf2cello/+ n=5, 1-month Ikzf2cello/cello n=3; 3-month Ikzf2+/+ n=4, 3-month Ikzf2cello/+ n=5, 3-month Ikzf2cello/cello n=4; 6-month Ikzf2+/+ n=4, 6-month Ikzf2cello/+ n=3, 6-month Ikzf2cello/cello n=5; 9-month Ikzf2+/+ n=3, 9-month Ikzf2cello/+ n=4, 9-month Ikzf2cello/cello n=4; 18-month Ikzf2+/+ n=3, 18-month Ikzf2cello/+ n=3, 18-month Ikzf2cello/cello n=3. Number of biologically independent samples for IHC bundle counts: P16 Ikzf2+/+ n=3, P16 Ikzf2cello/+ n=3, P16 Ikzf2cello/cello n=3; 1-month Ikzf2+/+ n=4, 1-month Ikzf2cello/+ n=4, 1-month Ikzf2cello/cello n=3; 3-month Ikzf2+/+ n=4, 3-month Ikzf2cello/+ n=5, 3-month Ikzf2cello/cello n=3; 6-month Ikzf2+/+ n=3, 6-month Ikzf2cello/+ n=3, 6-month Ikzf2cello/cello n=4; 9-month Ikzf2+/+ n=3, 9-month Ikzf2cello/+ n=4, 9-month Ikzf2cello/cello n=4; 18-month Ikzf2+/+ n=3, 18-month Ikzf2cello/+ n=3, 18-month Ikzf2cello/cello n=3. See also Supplementary Table 5 and 6.
Extended Data Figure 5
Extended Data Figure 5. Scanning electron microscopy of cello mice and auditory function of Ikzf2cello/del890 compound heterozygotes.
(a) Scanning electron micrographs of the organ of Corti of cello mice from P16 to 18-months of age. Representative images from the mid region of the cochlear spiral are shown. Scale = 10 μm. Number of biologically independent samples: P16 Ikzf2+/+ n=4, P16 Ikzf2cello/+ n=3, P16 Ikzf2cello/cello n=3; 1-month Ikzf2+/+ n=4, 1-month Ikzf2cello/+ n=5, 1-month Ikzf2cello/cello n=3; 3-month Ikzf2+/+ n=4, 3-month Ikzf2cello/+ n=5, 3-month Ikzf2cello/cello n=4; 6-month Ikzf2+/+ n=4, 6-month Ikzf2cello/+ n=5, 6-month Ikzf2cello/cello n=4; 9-month Ikzf2+/+ n=3, 9-month Ikzf2cello/+ n=4, 9-month Ikzf2cello/cello n=4; 18-month Ikzf2+/+ n=3, 18-month Ikzf2cello/+ n=3, 18-month Ikzf2cello/cello n=3. (b-d) Scanning electron micrographs of OHC stereocilia bundles of cello mice at P16, showing that wild-type Ikzf2+/+ (b), Ikzf2cello+ (c) and mutant Ikzf2cello/cello (d) mice display overall expected bundle patterning. Images are from the mid region of the cochlear spiral. Scale = 1 μm. Number of biologically independent samples: Ikzf2+/+ n=3, Ikzf2cello/+ n=3, Ikzf2cello/cello n=3. (e) The genomic/domain structure of the Ikzf2del890 allele/protein. Black = 5’ untranslated region, light grey = N-terminal DNA-binding domain, dark grey = C-terminal dimerization domain. The Ikzf2cello mutation lies in ZnF6. The del890 mutation deletes exon 4 and surrounding intronic sequence. (f) Averaged ABR thresholds for Ikzf2cello/del890 compound heterozygotes at 1-month of age, showing significantly elevated thresholds (≥40 dB SPL) at all frequencies tested compared to Ikzf2+/+, Ikzf2cello/+ and Ikzf2del890/+ control colony mates. Data shown are averaged thresholds ± s.e.m. Number of biologically independent samples: Ikzf2+/+ n=4, Ikzf2cello/+ n=2, Ikzf2+/del890 n=4, Ikzf2cello/del890 n=5. Ikzf2cello/del890 vs Ikzf2+/+ p-values: 8 kHz = 0.011, 16 kHz = 0.002, 32 kHz <0.0001, Click = 0.0001; Ikzf2cello/del890 vs Ikzf2cello/+ p-values: 8 kHz = 0.078, 16 kHz = 0.034, 32 kHz = 0.001, Click = 0.001; Ikzf2cello/del890 vs Ikzf2+/del890 p-values: 8 kHz = 0.025, 16 kHz = 0.009, 32 kHz = 0.0002, Click = 0.0002. Significance was assessed by one-way ANOVA with Tukey post-hoc test.
Extended Data Figure 6
Extended Data Figure 6. The MET current is normal in Ikzf2cello mice.
(a-b) MET currents were recorded from OHCs of P9 Ikzf2cello/cello and Ikzf2cello/+ (control) littermates. During voltage steps, hair bundles were displaced by applying a 50 Hz sinusoidal force stimuli (the driver voltage to the fluid jet is shown above the traces). At hyperpolarised membrane potentials (−121 mv), saturating excitatory bundle stimulation (i.e., towards the taller stereocilia) elicited a large inward MET current from both Ikzf2cello/+ and Ikzf2cello/cello OHCs, while inhibitory bundle stimulation (i.e. away from the taller stereocilia) closed the MET channels and reduced the resting current. Because the MET current reverses near 0 mV, it became outward when excitatory bundle stimulation was applied during voltage steps positive to its reversal potential. At positive membrane potentials (+99 mV), excitatory bundle stimulation now elicited similar outward MET currents with larger resting amplitudes. Arrows indicate closure of the MET channels (i.e., disappearance of the resting current) during inhibitory bundle displacements, arrowheads indicate the larger resting MET current at +99 mV compared to -121 mV. (c) Peak-to-peak current-voltage curves obtained from Ikzf2cello/+ (n=10 biologically independent samples) and Ikzf2cello/cello (n=8 biologically independent samples) OHCs at P9. The maximal MET current and the resting open probability of the MET channel were found to be similar between the two genotypes. Data shown are mean values ± s.e.m. (d-e) Total K+ currents recorded from P18 Ikzf2cello/+ control (d) and Ikzf2cello/cello mutant (e) OHCs. The size of the K+ current, which is mainly due to the negatively-activated IK,n (in addition to a small delayed rectifier IK : Marcotti and Kros, 1999), was smaller in Ikzf2cello/cello OHCs. (f) Average peak current-voltage relationship for the total K+ current recorded from the OHCs of Ikzf2cello/+ (n = 9 OHCs from 6 biologically independent animals) and Ikzf2cello/cello (n = 7 OHCs from 5 biologically independent animals) mice at P16–P18. Data shown are mean values ± s.e.m. (g-h) After normalization to the significantly reduced surface area of Ikzf2cello/cello OHCs (for this set of experiments: Ikzf2cello/+: 14.2 ± 0.4 pF; Ikzf2cello/cello: 11.2 ± 0.5 pF; p<0.0005), both the total IK (g) and isolated IK,n (h) were not significantly different between the two genotypes at P16–P18. Data shown are mean values ± s.e.m. n.s. non-significant, two-sided Welch’s t-test. (i) NanoString validations of genes downregulated in P8 Ikzf2cello/cello cochleae at P16. Data shown are mean normalized reads relative to wild-type ± SD (n = 4 biologically independent samples per genotype). Ppp17r1 in Ikzf2cello/cello vs Ikzf2+/+ p-value = 0.038, Ppp17r1 in Ikzf2cello/cello vs Ikzf2cello/+ p-value = 0.037. Significance was assessed by two-sided Welch’s t-test.
Extended Data Figure 7
Extended Data Figure 7. Transduction of cochlear HCs using Anc80L65 and HC enrichment by flow cytometry.
(a) Schematic representation of inner ear viral gene delivery via the posterior semicircular canal of CD-1 mice for HC marker immunolabeling. (b) Immunolabeling for GFP in the Anc80-eGFP injected, and MYC in the Anc80-Ikzf2 injected ears, showed mainly HC transduction, although some MYC staining could also be observed in supporting cells (blue arrow) (n=3 biologically independent samples per condition). Nuclear MYC staining suggests proper trafficking of the MYC-tagged helios protein in transduced cells. White arrows indicate OHCs and white arrowheads indicate IHCs. Scale = 10 μm. (c-d) Fluorescence activated cell sorting (FACS) of dissociated cochlear GFP positive and tdTomato positive cells from P8 Myo15Cre/+;ROSA26CAG-tdTomato mice injected with either Anc80-eGFP (c, 2 mice) or Anc80-Ikzf2 (d, 4 mice). Cells were first gated by forward and side scatter to exclude doublets. For the Anc80-eGFP transduced cochlear sample, transduced cells were identified based on GFP expression, and hair cells were further identified by tdTomato expression. tdTomato single positive, GFP single positive and tdTomato+GFP double positive cells were collected. For the Anc80-Ikzf2 transduced cochlear sample, HCs were gated based on tdTomato single positive expression and collected.
Extended Data Figure 8
Extended Data Figure 8. Transcriptional conversion of Anc80-Ikzf2 transduced IHCs.
(a) Heatmap for the top 30 differently expressed genes between all HCs profiled. Scaled expression values shown as z-scores, with yellow indicating higher and purple indicating lower expression than the mean. (b) OHC enriched genes that are induced in Anc80-Ikzf2(+) IHCs. Anc80-Ikzf2(-) IHC (n=34) vs. Anc80-Ikzf2(+) IHC (n=40) FDR: Pde6d = 2.03E-12, Ldhb = 3.74E-11. Dots represent the expression values of individual cells, with width of violins summarizing overall relative distribution of expression. (c) IHC enriched genes that are highly expressed in control IHCs vs control OHCs, but are significantly reduced in Anc80-Ikzf2(+) IHCs. Anc80-Ikzf2(-) IHC (n=34) vs. Anc80-Ikzf2(+) IHC (n=40) FDR: Fgf8 = 3.30E-14, Atp2a3 = 2.46E-13, Rprm = 2.27E-13 (Kruskal-Wallis test followed by post-hoc pairwise Wilcoxon Ranked Sum test adjusted for multiple comparisons). (d) IHC enriched genes that show only moderately reduced expression in Anc80-Ikzf2(+) IHCs. Anc80-Ikzf2(-) IHC (n=34) vs. Anc80-Ikzf2(+) IHC (n=40) FDR: Shtn1 = 8.59E-05, Tbx2 = 3.88E-08, Cabp2 = 1.40E-10 (Kruskal-Wallis test followed by post-hoc pairwise Wilcoxon Ranked Sum test adjusted for multiple comparisons). (e-f) Top 20 genes negatively (e) or positively (f) correlated with Ikzf2 expression in control HCs, shown alongside corresponding correlations of gene expression within all Anc80-Ikzf2 transduced HCs, Anc80-Ikzf2 transduced IHCs, or Anc80-Ikzf2 transduced OHCs. See also Extended Data Figure 9. (g) Genes that are negatively correlated with Ikzf2 (n=20, Pearson correlation < -0.6) are not enriched in OHCs at P8 compared to all other genes detected in the RiboTag OHC dataset (background genes, BG, n=13,124). Genes that are positively correlated with Ikzf2 (n=41, Pearson correlation > 0.6) are significantly enriched in OHCs at P8 compared to BG (n=13,103) (p = 0.025, two-sided Wilcoxon's test). Black line represents median enrichment factor (EF, log2 fold change), box demarcates 1st and 3rd quartiles, whiskers demarcate 1st and 3rd quartile ± 1.5×IQR values, dots represent single outliers. (h) One of the most differentially expressed genes we observed in our scRNA-seq experiment was Fcrlb, a gene which encodes an Fc receptor like protein, and whose expression in the ear has not been previously described. Fcrlb is significantly downregulated in Anc80-Ikzf2(+) HCs. Anc80-Ikzf2(-) IHC (n=34) vs. Anc80-Ikzf2(+) IHC (n=40) FDR= 4.89E-06. Anc80-Ikzf2(-) OHC (n=132) vs. Anc80-Ikzf2(+) OHC (n=148) FDR= 6.88E-08 (Kruskal-Wallis test followed by post-hoc pairwise Wilcoxon Ranked Sum test adjusted for multiple comparisons). See also Supplementary Tables 8-11.
Extended Data Figure 9
Extended Data Figure 9. Single cell RNA-seq allows for high-resolution discrimination of cell types and their transcriptional changes due to overexpression of Ikzf2/helios.
(a) Custom annotation strategy with theoretical reads mapping to unambiguous regions of the various custom viral loci, as well as those regions that get discarded because of endogenous sequence similarity (i.e. ambiguous reads). (b) Violin plots of the overall scRNA-seq detection metrics, including number of unique molecules detected in each of the major cell type cluster identified (low Anc80-Ikzf2 expressing IHCs: vIk- IHCs n=34; low Anc80-Ikzf2 expressing OHCs: vIk- OHCs n=132; high Anc80-Ikzf2 expressing IHCs: vIk+ IHCs n=40; high Anc80-Ikzf2 expressing OHCs: vIk+ OHCs n=140; and non-HCs: NonHCs n=219). (c) FeaturePlots with red showing higher expression across all profiled cells, including cells identified as non-HCs. Expression from loci captured with custom annotation shown to support cluster identification. A final labeled tSNE plot shows all cells profiled clustered by predicted cell type. (Misc: Cells from all miscellaneous clusters with fewer than 5 cells, NSC: Non-Sensory Epithelial Cell, SC: Organ of Corti Supporting Cell, and other clusters defined by the highest differentially expressed marker gene). (d) Pearson correlation scatter plots for selected genes within all profiled HCs, HCs from the Anc80-eGFP sample, or IHCs from the Anc80-Ikzf2 sample. (e) A Pearson correlation heatmap of all HCs detected showing overall transcriptional similarities between the non-transduced IHCs and OHCs, along with the Anc80-Ikzf2 transduced IHCs and OHCs.
Extended Data Figure 10
Extended Data Figure 10. Helios overexpression induces prestin expression and electromotility in IHCs but does not affect hair bundle morphology.
(a) The OHC electromotility protein prestin is expressed in the OHCs of Ikzf2cello/cello mutants (n=6 biologically independent samples). Additionally, the pattern of prestin expression is not affected by Anc80-eGFP transduction, but is induced in Anc80-Ikzf2 transduced IHCs (n=3 biologically independent samples per condition). Scale=10 μm (b) Expression of prestin can be seen in Anc80-Ikzf2 transduced IHCs as early as P8, and up to 8-weeks of age and overlaps with MYC staining (n=6 biologically independent samples at P8, n=3 biologically independent samples at 6-8 weeks). Scale = 20 μm. (c) Scanning electron micrographs of IHC and OHC stereocilia bundles of Anc80-Ikzf2 and Anc80-eGFP injected mice at P23 showing expected bundle patterning. Images are from the mid – basal region of the cochlear spiral. Scale=1 μm. Number of biologically independent samples (P16-P23): Anc80-Ikzf2 injected cochlea n=8, Anc80-Ikzf2 contralateral cochlea n=6, Anc80-GFP injected cochlea n=3. (d) Representative traces of the voltage-dependent (non-linear) component of the membrane capacitance (an electrical “signature” of electromotility) in the IHCs of Anc80-Ikzf2 injected mouse (red) and its non-injected littermate (black). Mice were injected with Anc80-Ikzf2 at P2 and recorded at P16. (e) Normalized maximal non-linear capacitance in all recorded IHCs of mice injected with Anc80-Ikzf2 at P2 (red) at different ages after injection and their non-injected littermates (black). Each symbol represents one biologically independent cell, the total number of cells is indicated in parentheses. Since Anc80-Ikzf2 transduction is not 100% efficient in the apical turn of the cochlea at the time points tested, some IHCs of Anc80-Ikzf2 injected mice do not show prominent non-linear capacitance while the other IHCs do. In the IHCs with maximal non-linear capacitance of more than 0.25 pF (due to presumable Ikzf2 expression), the parameters of the Boltzmann fit were as following (Mean±SEM): Qmax = 0.10±0.02 pC; Vpk = -31±1 mV; z=0.91±0.02; Clin = 11.7±1.2 pF; ΔCsa = 0.14±0.07 pF (n=12). For information on the fitting procedure, see methods.
Figure 1
Figure 1. Helios is a candidate regulator of OHC genes.
(a) The 100 OHC marker genes (n=100) are enriched in OHCs at all RiboTag OHC dataset time points compared to expression of all other genes detected (background, BG) (n=13,044). p-values: P8 = 1.73E-17, P14 = 6.55E-12, P28 = 1.60E-18, 6wk = 7.79E-18, 10wk = 1.43E-33 (two-sided Wilcoxon's test). Black center line represents median enrichment factor (EF, log2 fold change), box demarcates 1st and 3rd quartiles, whiskers demarcate 1st and 3rd quartile ± 1.5×IQR values, dots represent single outliers. (b) Transcription factor binding motif analysis using the 100 highly confident OHC marker genes identifies the binding signature for IKZF2/helios as significantly overrepresented. NES = normalized enrichment score. NES≥3.0 corresponds to a false discovery rate of 3-9% (see Janky et al., 2014). (c) Ikzf2 transcript enrichment in OHCs as measured by the RiboTag OHC RNA-seq. (d) Specific expression of helios in the nuclei of wild-type P8 OHCs (white arrows, n=3 biologically independent samples). Scale=50 μm. (e) Helios expression is maintained in wild-type OHCs at 1-month (white arrows, n=3 biologically independent samples). Scale=10 μm. (f) Helios is detected in wild-type OHCs from P4 and is maintained in mature P16 OHCs (P3 n=2, P4 n=4, P8 n=4, P16 n=4 biologically independent samples). Loss of labelling when the anti-helios antibody is ‘pre-blocked’ with its immunizing peptide confirms specificity (n=5 biologically independent samples). Scale=10 μm. (g) The genomic/domain structure of Ikzf2/helios. Black = 5’ untranslated region, light grey = N-terminal DNA-binding domain, dark grey = C-terminal dimerization domain. The Ikzf2cello mutation lies in ZnF6. Further alignment of the helios ZnF6 sequence with its paralogues and the classical Cys2His2 ZnF motif shows that the H517Q cello mutation causes substitution of a highly conserved zinc-coordinating histidine residue. 3D modelling of wild-type Ikzf2+ ZnF6 and mutant Ikzf2cello ZnF6 illustrates the requirement of residue His517 for zinc-coordination, which is not possible when residue Gln517 is substituted. HC, Hensen’s cells; IHC, inner hair cells; OoC, organ of Corti; OHC, outer hair cells; PC, pillar cells; RM, Reissner’s membrane; SG, spiral ganglion; SL, spiral ligament; SV, stria vascularis.
Figure 2
Figure 2. Ikzf2/helios is required for hearing and OHC electromotility.
(a-b) Averaged ABR thresholds for cello mice at P16 (a, n=4 biologically independent animals per genotype) and 1- and 9-months of age (b, n=5 biologically independent animals per genotype for each time point). Age-matched Ikzf2+/+ and Ikzf2cello/+ controls display thresholds within the expected range (15 – 30 dB SPL) at all time-points tested. Data shown are averaged thresholds ± s.e.m. P16 Ikzf2cello/cello vs Ikzf2+/+ (a) p-values: 8 kHz <0.0001, 16 kHz <0.0001, 32 kHz <0.0001, Click <0.0001. P16 Ikzf2cello/cello vs Ikzf2cello/+ (a) p-values: 8 kHz <0.0001, 16 kHz <0.0001, 32 kHz <0.0001, Click<0.0001. 1-month Ikzf2cello/cello vs 9-month Ikzf2cello/cello (b) p-values: 8 kHz = 0.0284, 16 kHz = 0.0166, 32 kHz = 0.0303, Click = 0.0042. Significance was assessed by one-way ANOVA with Tukey post-hoc test (a) or two-sided Welch’s t-test (b). See also Extended Data Figure 4. (c-d) Images showing a patch pipette attached to an OHC from control Ikzf2cello/+ (c) and mutant Ikzf2cello/cello (d) cochleae at P16–P18. Red lines indicate the position of the OHC basal membrane before (left) and during (right) a depolarizing voltage from step from –64 mV to +56 mV, highlighting the shorting of the cells. Scale=5 μm. Also shown are time-based z-stack projections (right), where red lines indicate the resting position of the basal membrane and the green lines indicate the movement. Ikzf2cello/+ n = 10 and Ikzf2cello/cello n = 21 z-stack projections (one set per OHC) from 5 biologically independent animals per genotype. (e-f) Average movement was significantly reduced in Ikzf2cello/cello OHCs compared to Ikzf2cello/+ at P16–P18 (e), even after normalization to respective membrane capacitance (f) (for this set of recordings, Ikzf2cello/+: 13.6 ± 0.4 pF; Ikzf2cello/cello: 10.0 ± 0.3 pF). Data shown are averaged movement ± s.e.m. Ikzf2cello/+ n = 10 and Ikzf2cello/cello n = 21 OHCs from 5 biologically independent animals per genotype. p-value <0.0001, two-sided Welch’s t-test. (g) Averaged DPOAE responses for cello mice at 1-month of age (n=5 biologically independent animals per genotype). Data shown are averaged thresholds ± s.e.m. Ikzf2cello/cello vs Ikzf2+/+ p-values: 8 kHz <0.0001, 16 kHz <0.0001, 32 kHz = 0.0004. P16 Ikzf2cello/cello vs Ikzf2cello/+ p-values: 8 kHz <0.0001, 16 kHz <0.0001, 32 kHz = 0.0012. Significance was assessed by one-way ANOVA with Tukey post-hoc test. (h-i) NanoString validations of genes downregulated in Ikzf2cello/cello cochleae at P8 (h) and results showing no change in expression of other OHC TFs (i). Data shown are mean normalized reads relative to wild-type ± SD (n=4 biologically independent samples per genotype). Ikzf2cello/cello vs Ikzf2+/+ p-values: Car7 = 0.028, Ppp17r1 = 0.006, Ocm = 0.017, Slc26a5 = 0.017 (two-sided Welch’s t-test).
Figure 3
Figure 3. Partial transcriptional conversion of Anc80-Ikzf2 transduced IHCs identified by scRNA-seq.
(a) Representative Myo15Cre/+;ROSA26CAG-tdTomato cochlear whole-mount. Myo15-Cre-driven tdTomato expression is HC specific at P6 (n=3 biologically independent samples with similar results). Scale=50 μm. (b) tSNE plots of all cochlear HCs profiled by scRNA-seq, including the cluster to which each cell was assigned, the experimental origin of each cell (Anc80-Ikzf2 or Anc80-eGFP injected cochlea), and the relative transcript abundance of Anc80-Ikzf2 measured in each cell. (c) Anc80-Ikzf2 is highly expressed in the Anc80-Ikzf2(+) IHCs and OHCs, whereas Anc80-eGFP expression is only seen in the cells assigned to the Anc80-Ikzf2(-) IHC and OHC clusters. Dots represent the expression values of individual cells, with width of violins summarizing overall relative distribution of expression. (d) Canonical HC markers are highly expressed in all HC clusters, and not notably changed as a result of Anc80-Ikzf2 expression. (e) IHC-enriched genes that are highly expressed in control IHCs vs control OHCs, but are significantly reduced in Anc80-Ikzf2(+) IHCs. Anc80-Ikzf2(-) IHC (n=34) vs. Anc80-Ikzf2(+) IHC (n=40) FDR: Slc17a8 = 2.25E-12, Otof = 6.76E-14. Significance was assessed by Kruskal-Wallis test followed by post-hoc pairwise Wilcoxon Ranked Sum test adjusted for multiple comparisons. (f) OHC-enriched genes that are induced in Anc80-Ikzf2(+) IHCs. Anc80-Ikzf2(-) IHC (n=34) vs. Anc80-Ikzf2(+) IHC (n=40) FDR: Ocm = 3.65E-08, Lbh = 1.81E-10. Significance was assessed by Kruskal-Wallis test followed by post-hoc pairwise Wilcoxon Ranked Sum test adjusted for multiple comparisons. See also Extended Data Figures 8 and 9.
Figure 4
Figure 4. Helios overexpression modulates expression of HC markers.
(a-b) IHC markers OTOF and VGLUT3 are downregulated in Anc80-Ikzf2 transduced IHCs (n=3 biologically independent samples). Arrows = OHCs, arrowheads = IHCs. Scale=10μM. (c) The OHC marker OCM is expressed in Anc80-Ikzf2 transduced IHCs (n=3 biologically independent samples per condition). Arrows = OHCs, arrowheads = IHCs. Scale=10 μm. (d) Fcrlb expression during wild-type mouse inner ear development as detected by in situ hybridization. While at E16, Fcrlb expression is not detected in the inner ear, by P0 it is detected in both IHCs and OHCs and by P8, Fcrlb expression is largely restricted to the IHCs (n=3 biologically independent samples per time point). Scale=10 μm. (e) In the absence of functional helios (Ikzf2cello/cello mouse), Fcrlb is robustly expressed in IHCs and OHCs at P8. IHC expression of Fcrlb is not affected by Anc80-eGFP transduction, whereas Fcrlb expression is lost in Anc80-Ikzf2 transduced HCs (n=3 biologically independent samples per condition). Scale=10 μm. (f-g) Expression of prestin can be seen in Anc80-Ikzf2 transduced IHCs up to 8-weeks of age (n=3 biologically independent samples at 6-8 weeks) (f, scale=100 μm), and overlaps with Myc staining (g, scale=20 μm). See also Extended Data Figure 10.

References

    1. Ehret G. Development of absolute auditory thresholds in the house mouse (Mus musculus) J Am Audiol Soc. 1976;1:179–84. - PubMed
    1. Bielefeld EC, Tanaka C, Chen G, Henderson D. Age-related hearing loss: is it a preventable condition? Hear Res. 2010;264:98–107. - PMC - PubMed
    1. World Health Organization. Deafness and hearing loss fact sheet. WHO Media centre. 2018 Available at: http://www.who.int/mediacentre/factsheets/fs300/en/
    1. Mittal R, et al. Recent Advancements in the Regeneration of Auditory Hair Cells and Hearing Restoration. Front Mol Neurosci. 2017;10:236. - PMC - PubMed
    1. Fang J, et al. Outer hair cell–specific prestin-CreER T2 knockin mouse lines. Genesis. 2012;50:124–131. - PMC - PubMed

Publication types