. 2018 Dec;564(7734):64-70.
doi: 10.1038/s41586-018-0734-6. Epub 2018 Nov 21.

Amphioxus functional genomics and the origins of vertebrate gene regulation

Ferdinand Marlétaz  1   2 Panos N Firbas  3 Ignacio Maeso  4 Juan J Tena  3 Ozren Bogdanovic  5   6   7 Malcolm Perry  8   9 Christopher D R Wyatt  10   11 Elisa de la Calle-Mustienes  3 Stephanie Bertrand  12 Demian Burguera  10   13 Rafael D Acemel  3 Simon J van Heeringen  14 Silvia Naranjo  3 Carlos Herrera-Ubeda  13 Ksenia Skvortsova  5 Sandra Jimenez-Gancedo  3 Daniel Aldea  12 Yamile Marquez  10 Lorena Buono  3 Iryna Kozmikova  15 Jon Permanyer  10 Alexandra Louis  16   17   18 Beatriz Albuixech-Crespo  13 Yann Le Petillon  12 Anthony Leon  12 Lucie Subirana  12 Piotr J Balwierz  8   9 Paul Edward Duckett  5 Ensieh Farahani  3 Jean-Marc Aury  19 Sophie Mangenot  19 Patrick Wincker  20 Ricard Albalat  21 Èlia Benito-Gutiérrez  22 Cristian Cañestro  21 Filipe Castro  23 Salvatore D'Aniello  24 David E K Ferrier  25 Shengfeng Huang  26 Vincent Laudet  12 Gabriel A B Marais  27 Pierre Pontarotti  28 Michael Schubert  29 Hervé Seitz  30 Ildiko Somorjai  31 Tokiharu Takahashi  32 Olivier Mirabeau  33 Anlong Xu  26   34 Jr-Kai Yu  35 Piero Carninci  36   37 Juan Ramon Martinez-Morales  3 Hugues Roest Crollius  16   17   18 Zbynek Kozmik  15 Matthew T Weirauch  38   39 Jordi Garcia-Fernàndez  13 Ryan Lister  7   40 Boris Lenhard  8   9   41 Peter W H Holland  1 Hector Escriva  42 Jose Luis Gómez-Skarmeta  43 Manuel Irimia  44   45
Affiliations

Amphioxus functional genomics and the origins of vertebrate gene regulation

Ferdinand Marlétaz et al. Nature. 2018 Dec.

Abstract

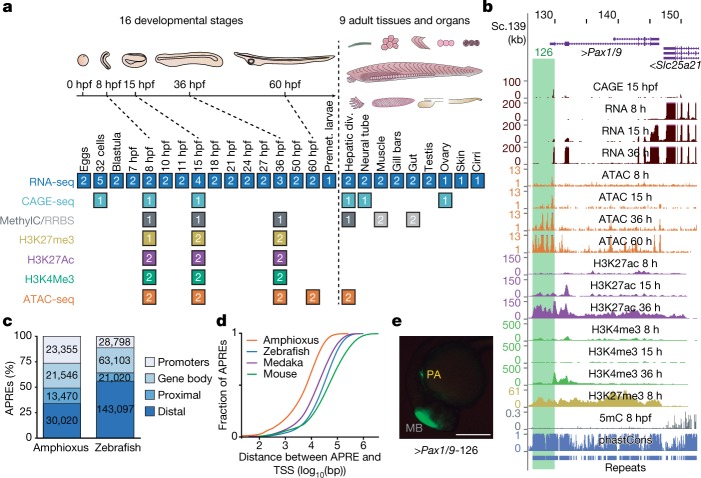
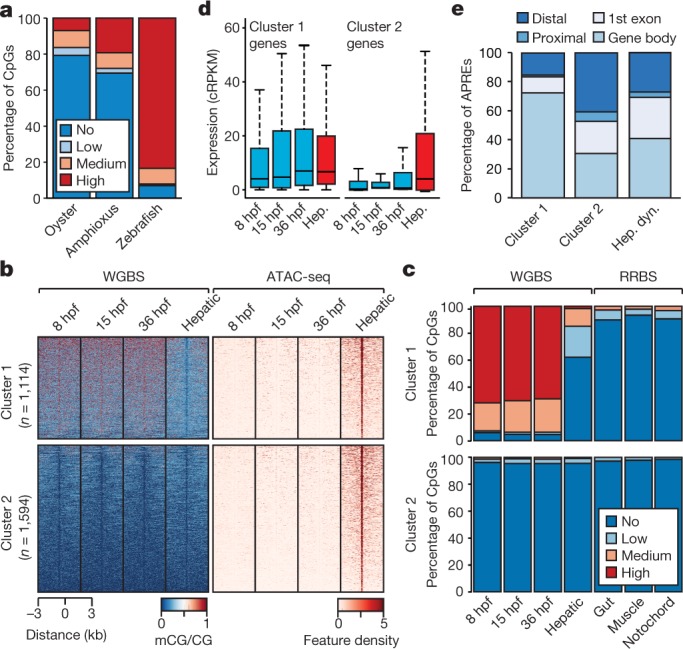
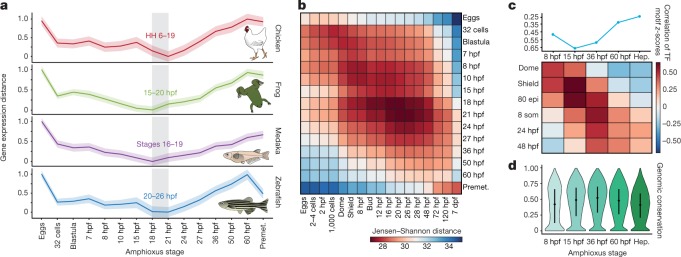
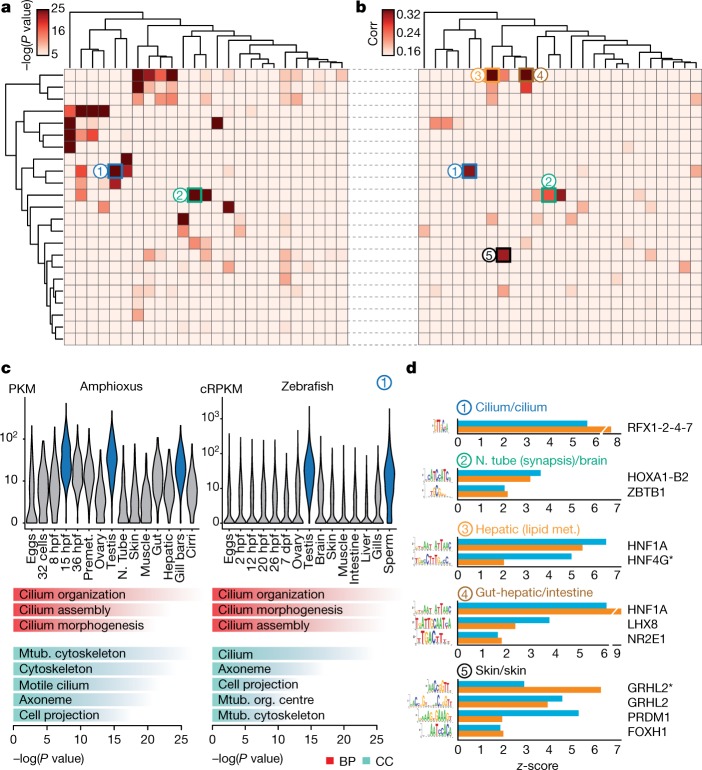
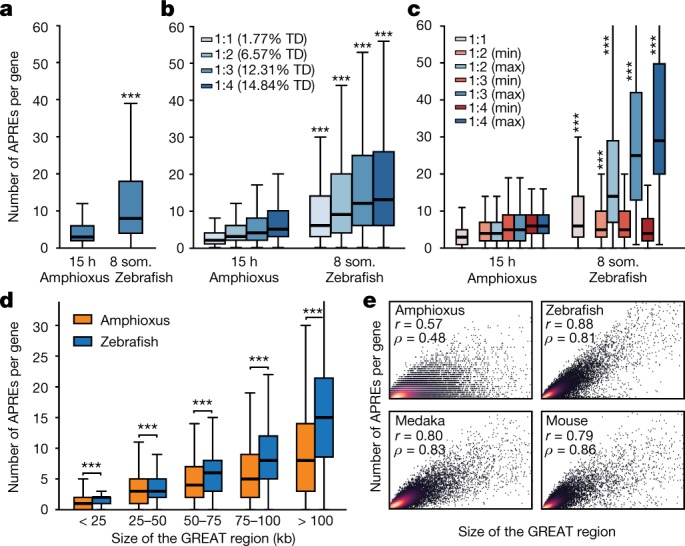
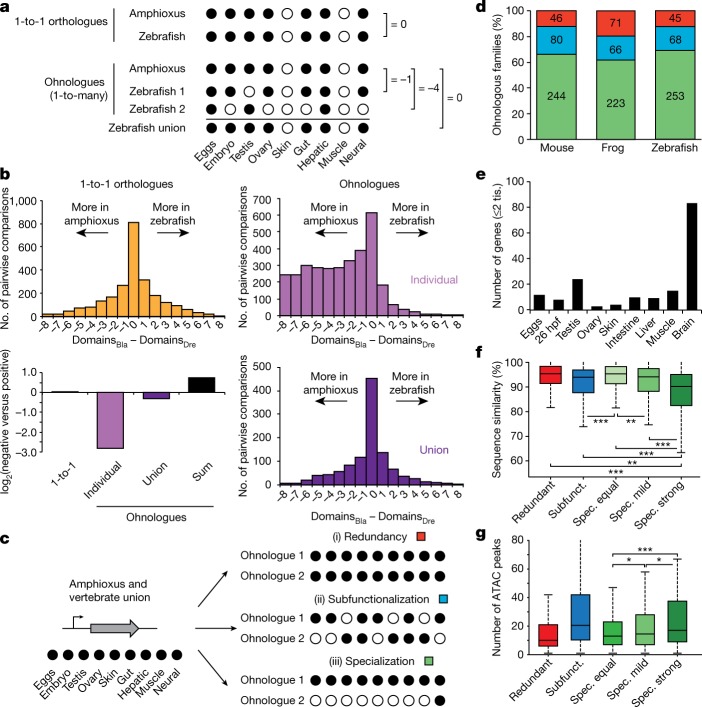
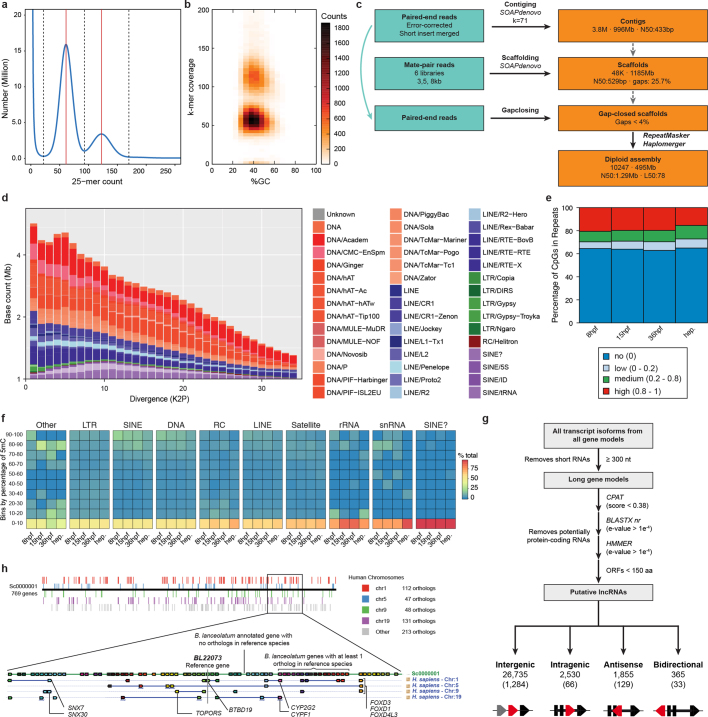
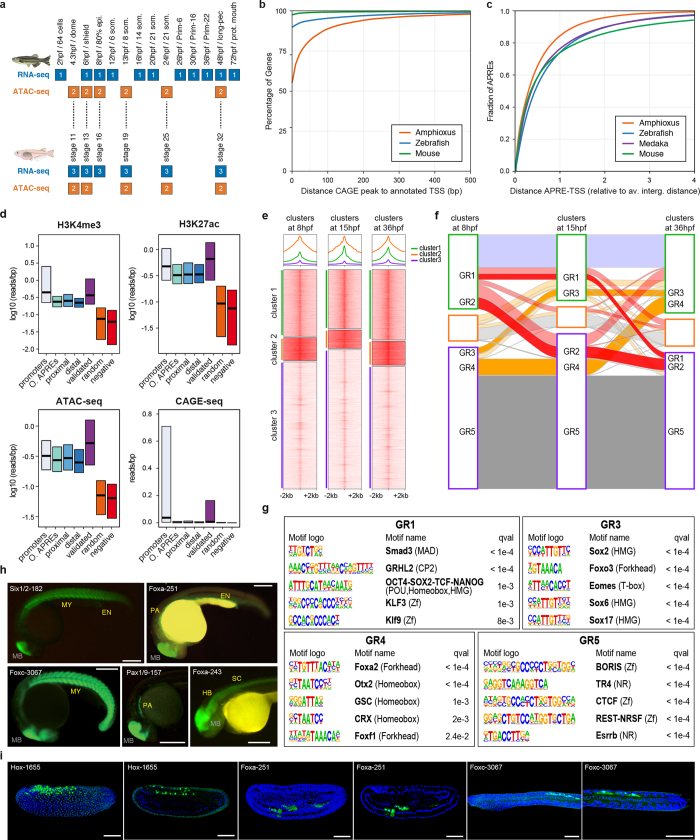
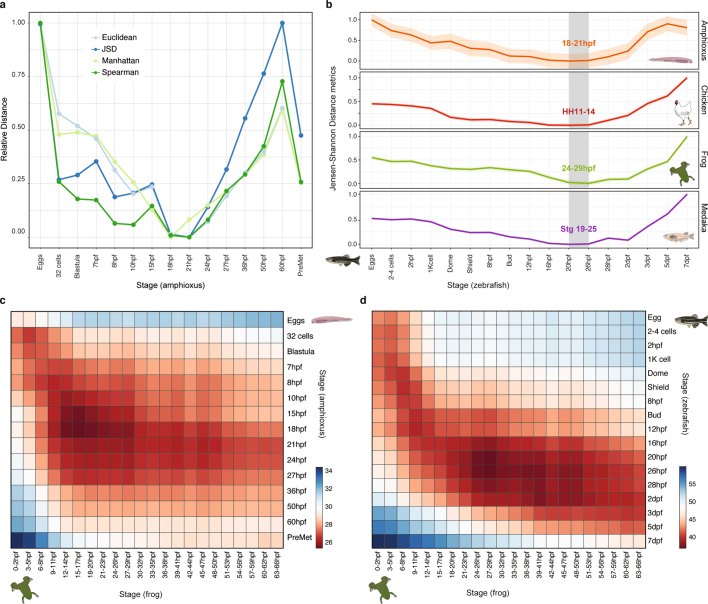
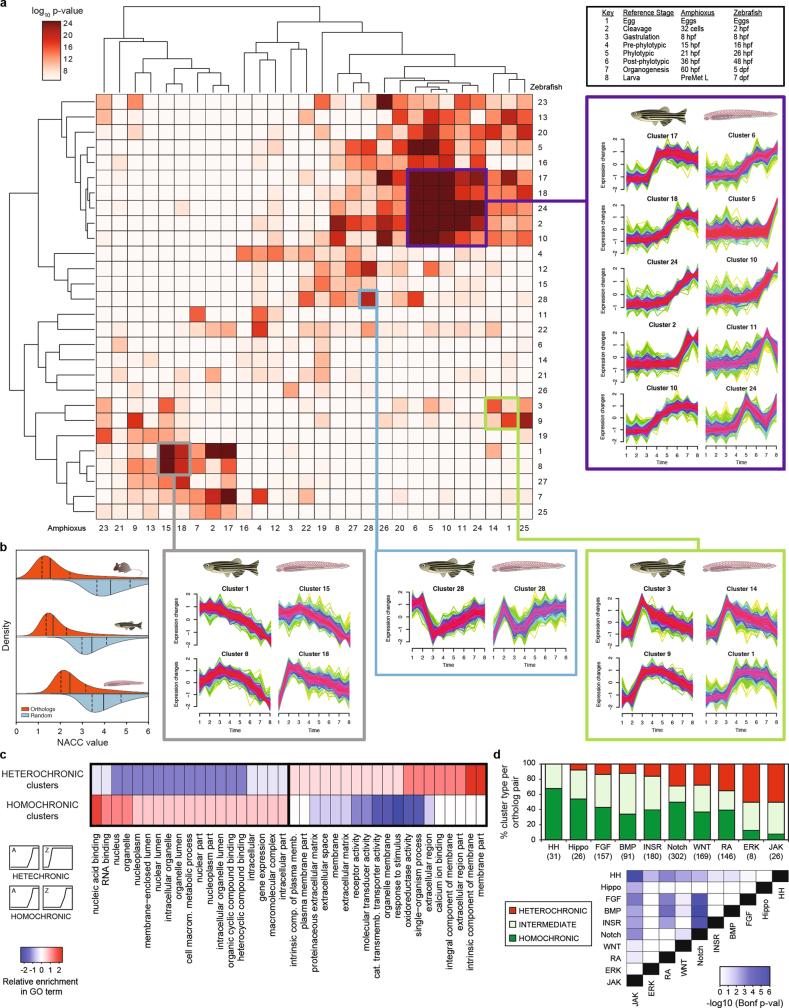
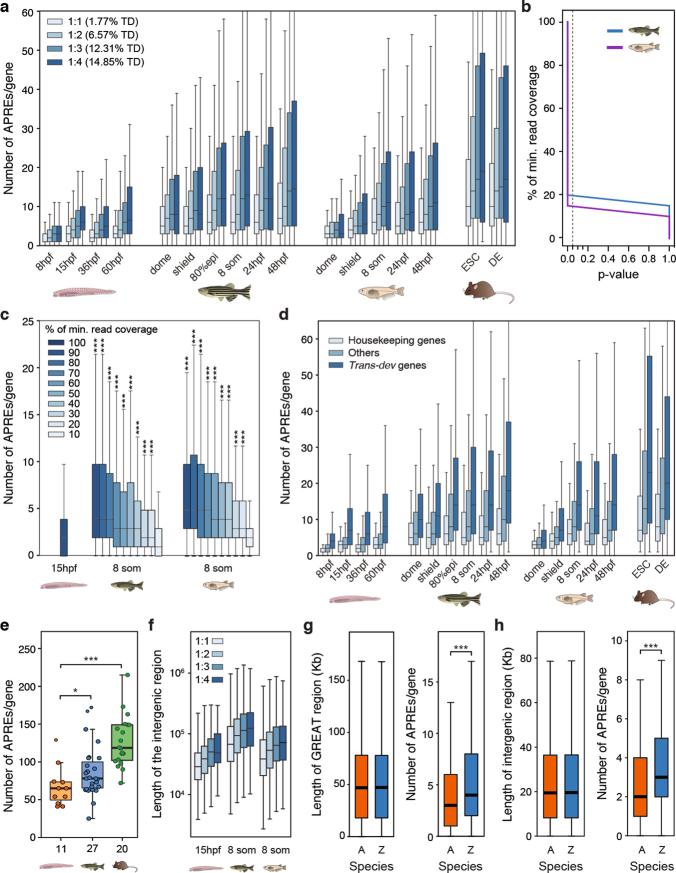
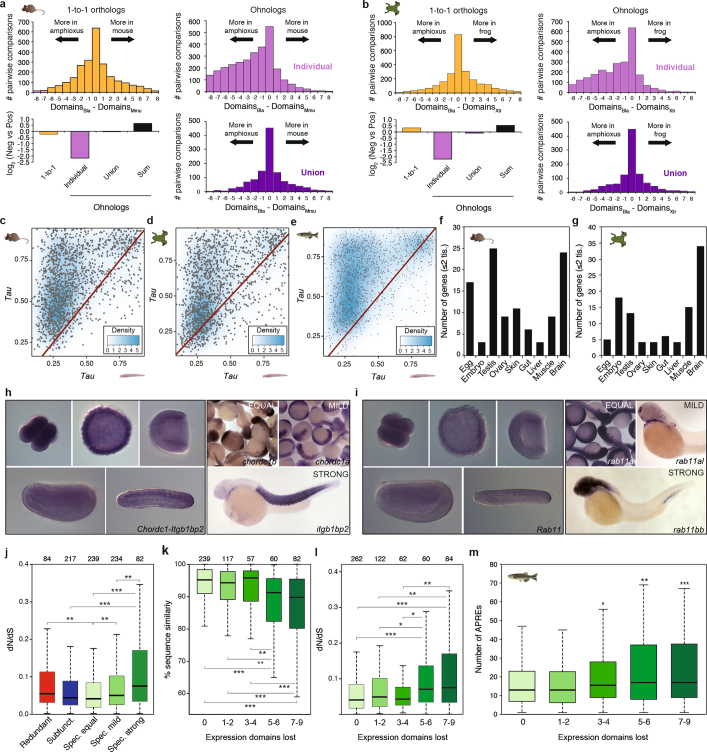
Vertebrates have greatly elaborated the basic chordate body plan and evolved highly distinctive genomes that have been sculpted by two whole-genome duplications. Here we sequence the genome of the Mediterranean amphioxus (Branchiostoma lanceolatum) and characterize DNA methylation, chromatin accessibility, histone modifications and transcriptomes across multiple developmental stages and adult tissues to investigate the evolution of the regulation of the chordate genome. Comparisons with vertebrates identify an intermediate stage in the evolution of differentially methylated enhancers, and a high conservation of gene expression and its cis-regulatory logic between amphioxus and vertebrates that occurs maximally at an earlier mid-embryonic phylotypic period. We analyse regulatory evolution after whole-genome duplications, and find that-in vertebrates-over 80% of broadly expressed gene families with multiple paralogues derived from whole-genome duplications have members that restricted their ancestral expression, and underwent specialization rather than subfunctionalization. Counter-intuitively, paralogues that restricted their expression increased the complexity of their regulatory landscapes. These data pave the way for a better understanding of the regulatory principles that underlie key vertebrate innovations.


Conflict of interest statement

The authors declare no competing interests.

Figures

Fig. 1
Fig. 1. Functional genome annotation of amphioxus.
a, Summary of the 94 amphioxus samples generated in this study, comprising eight functional-genomic datasets. The number of biological replicates is indicated for each sample type. div., diverticulum; MethylC/RRBS, methylC sequencing and reduced representation bisulfite sequencing; Premet., premetamorphic. b, Genome browser excerpt showing a selection of available tracks, including gene annotation, sequence conservation (using phastCons), repeats and several epigenomic and transcriptomic datasets. Green rectangle highlights the APRE tested in e. c, Numbers and proportions of amphioxus and zebrafish APREs according to their genomic location. Promoters, within 1-kbp upstream and 0.5-kbp downstream of an annotated TSS; gene body, within an orthology-supported gene; proximal, within 5-kbp upstream of (but not overlapping with) a TSS; distal, not in the aforementioned categories. d, Cumulative distributions of the distance between each APRE and the closest annotated TSS in each species. e, Lateral view of a representative transgenic zebrafish 26-hpf embryo showing GFP expression driven by an amphioxus APRE associated with Pax1/9 (‘Pax1/9-126’, highlighted in b) in pharyngeal arches (PA; n = 4/4). Positive-control enhancer was expressed in the midbrain (MB). Scale bar, 250 μm.
Fig. 2
Fig. 2. 5mC patterns and dynamics in the amphioxus genome.
a, Percentage of methylated CpG dinucleotides in oyster (mantle, n = 14,779,123), amphioxus (8 hpf, n = 19,657,388) and zebrafish (1,000-cell stage, n = 38,989,847) samples. Low, >0–20%; medium, 20–80%; high, >80%. b, k-means clustering (n = 2) of 5mC signal over hepatic-specific APREs. c, Percentage of methylated CpG dinucleotides as assessed by whole-genome bisulfite sequencing (WGBS) and reduced representation bisulfite sequencing (RRBS) in embryos and adult tissues in APREs from b. d, Distribution of expression levels for genes associated with APREs displaying distinct 5mC patterns in b. Cluster 1: 1,114 genes; cluster 2: 1,594 genes. cRPKM, corrected (per mappability) reads per kb of mappable positions and million reads. Hep, hepatic diverticulum. e, Genomic distribution of regions with distinct 5mC patterns from b. Hep. dyn., dynamic APREs active in the hepatic diverticulum.
Fig. 3
Fig. 3. The hourglass model and chordate embryogenesis.
a, Stages of minimal transcriptomic divergence (using the Jensen–Shannon distance metric) from four vertebrate species to each amphioxus stage. The grey box outlines the period of minimal divergence, with the corresponding vertebrate periods indicated (the range is given by the two less divergent stages). Dispersions correspond to the standard deviation computed on 100 bootstrap re-samplings of the orthologue sets (amphioxus–chicken: 5,720; amphioxus–zebrafish: 5,673; amphioxus–frog: 5,883; and amphioxus–medaka: 5,288). HH, Hamburger–Hamilton stage. b, Heat map of pairwise transcriptomic Jensen–Shannon distances between amphioxus (vertical) and zebrafish (horizontal) stages. A smaller distance (red) indicates higher similarity. dpf, days post-fertilization. c, Zebrafish and amphioxus pairwise Pearson correlation of relative enrichment z-scores for transcription-factor (TF) motifs in dynamic APREs, active at different developmental stages. Top, maximal correlation for each amphioxus stage against the zebrafish stages. Bottom, heat map with all pairwise correlations. 80 epi, 80% epiboly stage; 8 som, 8-somite stage. d, Sequence conservation levels within the cephalochordates of active APREs at each developmental stage, visualized as the distribution of average phastCons scores. The number of APREs at 8 hpf = 5,282; at 15 hpf = 17,387; at 36 hpf = 21,089; at 60 hpf = 22,674; and in hepatic diverticulum (hep) = 16,551. Dots correspond to the mean values and lines represent the interquartile range.
Fig. 4
Fig. 4. Transcriptomic and cis-regulatory conservation of adult chordate tissues.
a, Heat map showing the level of raw statistical significance of orthologous gene overlap between modules produced by weighted correlation network analysis (WGCNA), from amphioxus (vertical) and zebrafish (horizontal) as derived from upper-tail hypergeometric tests. b, Heat map of all pairwise Pearson correlations (corr) between the modules of the two species, based on the relative z-scores of transcription-factor motifs for each module (242 super-families of motifs). Modules are clustered as in a. c, Distribution of expression values (cRPKMs) for all genes within the cilium modules across each sample (top), and enriched Gene Ontology terms within each module (bottom) for a pair of modules (labelled ‘1’ in b, c; 1,681 and 261 genes in zebrafish and amphioxus, respectively). BP, biological process; CC, cellular component. P values correspond to uncorrected two-sided Fisher’s exact tests as provided by topGO. Mtub., microtubule; N. tube, neural tube; org., organizing. d, Transcription-factor binding-site motifs with high z-scores from highly correlated pairs of modules between zebrafish (blue) and amphioxus (orange). Numbers correspond to those circles in b. RFX1-2-4-7 denotes RFX1, RFX2, RFX4 and RFX7; HOXA1-B2 denotes HOXA1 and HOXB2; asterisk denotes an alternative motif.
Fig. 5
Fig. 5. Higher regulatory complexity in vertebrate regulatory landscapes.
a, Distribution of the number of APREs within the regulatory landscape of each gene (as estimated by GREAT), at comparable pre-phylotypic developmental stages (15 hpf for amphioxus and 8 somites for zebrafish). n = 6,047 and 9,239 genes for amphioxus and zebrafish, respectively. b, As in a, but with gene families separated according to the number of retained ohnologues per family in vertebrates (from 1 to 4, using mouse as a reference). The percentage of developmental regulatory genes (TD, trans-dev) in each category is indicated. c, As in b, but only the genes with the lowest (‘min’, in red) and the highest (‘max’, in blue) number of APREs are plotted for each ohnologue family. d, Distributions of the number of APREs per gene among subsets of amphioxus and zebrafish genes matched by GREAT-region size (± 500 bp) and binned by size as indicated. e, Density scatter plot of the number of APREs (y axis) versus the size of the GREAT region (x axis) per gene and species. Pearson (r) and Spearman (ρ) correlation coefficients are indicated. Sample sizes: amphioxus, 20,053; zebrafish, 20,569; medaka, 15,978; mouse, 18,838. ad, *** P < 0.001; one-sided Mann–Whitney tests of the zebrafish distribution versus the equivalent amphioxus distribution. Exact P values and sample sizes are provided in Supplementary Data 2, dataset 8.
Fig. 6
Fig. 6. Expression specialization is the main fate after WGD.
a, Schematic of the analysis shown in b. Expression is binarized for each gene across the nine homologous samples (‘on’, black dots; normalized cRPKM > 5). b, Distribution of the difference in positive domains between zebrafish (domainsDre) and amphioxus (domainsBla) for 1-to-1 orthologues (2,478 gene pairs; yellow), individual ohnologues (3,427 gene pairs in 1,135 families; lilac) and the union of all vertebrate ohnologues in a family (purple). Bottom left, log2 of the ratio between zebrafish genes with negative and positive score for each category. ‘Sum’ (black), binarization of family expression after summing the raw expression values for all ohnologues. c, Schematic of the analyses shown in d, representing the three possible fates after WGD. d, Distribution of fates after WGD for families of ohnologues. e, Number of ohnologues with strong specialization in zebrafish expressed in each domain. Tis., tissue. f, Distribution of the percentage of nucleotide sequence similarity between human and mouse by family type. Ohnologues from specialized families are divided into ‘spec. equal’ (which maintain all expression domains), ‘spec. mild’ (which have lost some but maintained more than two expression domains) and ‘spec. strong’ (≤2 expression domains remain). Subfunct., subfunctionalized. g, Distribution of the number of APREs within GREAT regions for zebrafish ohnologues for each category. Only statistical comparisons within specialized families are shown. P values in f and g correspond to two- and one-sided Wilcoxon sum-rank tests between the indicated groups, respectively. *0.05 > P value ≥ 0.01, ** 0.01 > P value ≥ 0.001, ***P value < 0.001. Exact P values and sample sizes are provided in Supplementary Data 2, dataset 8.
Extended Data Fig. 1
Extended Data Fig. 1. Summary of genomic assembly and repeat annotation.
a, Spectrum of 25-mers in Illumina sequencing data that shows the bimodal distribution that is characteristic of highly polymorphic species. b, Heat map showing k-mer decomposition (y axis) across GC content (x axis). Both peaks show comparable GC content, which is consistent with them representing haploid versus diploid k-mers. c, Flow chart of the steps followed to obtain the B. lanceolatum assembly. d, Repeat landscape and its evolutionary history, shown by the proportion of repetitive elements with a given divergence (K2P) to their consensus in the repeat library (repeatScout). e, Percentage of methylated CpG dinucleotides within repetitive elements, at three developmental stages and in the adult hepatic diverticulum. f, Distribution of average levels of 5mC of different repeat families. Colour key indicates the percentage of repeats in each family with corresponding levels of average methylation. g, Computational pipeline to identify long non-coding RNAs (lncRNAs). Categories: antisense, lncRNA overlaps with a protein-coding gene in the reverse strand; intragenic, lncRNA overlaps with a protein-coding gene in the same strand; bidirectional, within 1 kbp of a TSS of a protein-coding gene in the antisense strand, probably a product of a bidirectional promoter; intergenic, lncRNA does not overlap with any protein-coding gene. The total number in each category is indicated, with the number of those that are multi-exonic in parentheses. h, Quadruple conserved synteny between amphioxus and human. Top, amphioxus scaffold Sc0000001 aligned against the four human chromosomes with which it shares the highest number of orthologues (chr1, chr5, chr9 and chr19). In this scaffold, 277 out of 551 genes have clear orthologues in human, and 203 of these have orthologues on at least one of the four mentioned chromosomes. The black horizontal line represents the amphioxus scaffold, and each vertical coloured box an orthologous gene on the corresponding human chromosome. Bottom, modified view from Genomicus that is centred on the BL22073 gene and spans Sc0000001: 7,736,434–8,850,041. On the top line, each amphioxus gene with at least one orthologue in the nine reference species is represented with an oriented coloured box. Human genes located in the four ohnologous chromosomes are aligned underneath, in boxes of colours that correspond to those of their amphioxus pro-orthologues. The Genomicus server dedicated to amphioxus can be accessed at http://genomicus.biologie.ens.fr/genomicus-amphioxus.
Extended Data Fig. 2
Extended Data Fig. 2. Dynamics of chromatin marks on APREs and reporter assays.
a, Summary of the zebrafish and medaka RNA-seq and ATAC-seq datasets generated for this study. Dashed lines indicate equivalent developmental stages in the two species, based on aprevious study. The number of biological replicates is indicated for each experiment. Zebrafish 24-hpf ATAC-seq data are from a previous study. b, Cumulative distribution of the distance between CAGE-seq peaks and the closest annotated TSSs for genes with expression cRPKM > 5 in any of the samples covered by CAGE-seq (see Fig. 1a). Only CAGE-seq peaks within 1 kbp of an annotated TSS were tested (amphioxus: 10,435 peaks; zebrafish, 23,326 peaks; and mouse, 23,443 peaks). c, Cumulative distribution of distances between each APRE and the closest annotated TSS normalized by the average intergenic distance of the species (amphioxus, 83,471; zebrafish, 252,774; medaka, 174,139; and mouse, 216,857 APREs, as per Fig. 1c). d, Signal distribution of different marks within functional-genomic regions in amphioxus. log10 of read counts of H3K4me3, H3K27ac and ATAC-seq, and raw read counts of CAGE-seq in promoters of homology-supported, protein-coding genes (n = 26,501), other APREs (‘O. APREs’, all APREs that do not overlap a TSS from any gene model; n = 48,341), proximal APREs (n = 24,622), distal APREs (n = 11,881), previously validated enhancers (n = 43; Supplementary Table 9), random regions (n = 88,413) and negative regions (excluding ATAC-seq peaks, n = 88,413). For region designation, see Fig. 1c. For clarity, whiskers and outliers are not displayed. e, k-means clustering of APREs based on H3K27ac signal in three developmental stages. Cluster 1 and 3 APREs were considered as active and inactive, respectively. Average H3K27ac profiles are represented in the top panels. The number of APREs per cluster and stage are provided in Supplementary Data 2, dataset 8. f, Alluvial plot that shows the dynamics of each APRE among the clusters described in e. APREs that remained active (cluster 1 in all stages) along the three developmental stages are represented in blue, constitutively inactive APREs (cluster 3 in all stages) in dark grey and dynamic APREs in red or orange (if inactivated or activated, respectively, during development). Five groups of APREs of special interest are highlighted with stronger colours and named GR1–GR5. g, Representative enriched DNA motifs found in each of the groups described in f. GR1 APREs were enriched in early motifs (for example, Smad3 and Oct4, Sox2 and Nanog); GR3 APREs in motifs of transcription factors involved in the generation of the three germ layers (for example, Foxo3, Sox6 and Sox17); GR4 APREs in tissue-specific transcription factors (for example, Foxa2, Otx2 and Crx); and GR5 APREs in CTCF and CTCF-like (BORIS) motifs. q values as provided by Homer. h, Lateral views of embryos from stable transgenic zebrafish lines at 24 hpf (except for Foxa-243, at 48 hpf) showing GFP expression driven by the amphioxus APREs listed in Supplementary Table 8 and highlighted in Supplementary Fig. 1. The number of independent founders with the same expression were as follows: Six1/2-182 (5/5), Foxa-243 (3/3), Foxa-251 (4/4), FoxC-3067 (6/6) and Pax1/9-157 (3/3). Midbrain expression corresponds to the positive-control enhancer included in the reporter constructs. EN, endoderm; HB, hindbrain; MY, myotomes; PA, pharyngeal arch; SC, spinal cord. Scale bar, 250 μm. i, Lateral views of transient transgenic amphioxus embryos, showing GFP expression driven by the APREs highlighted in Supplementary Fig. 1a, b (Foxa-251 (n = 46 out of 52) and Foxc-3067 (n = 27 out of 35), respectively) and in a previous study (Hox-1655, n = 72 out of 80). For each element, left panels correspond to 3D rendering from sub-stacks and right panels to z-stack sagittal sections. Scale bar, 50 μm. Anterior is to the left and dorsal to the top.
Extended Data Fig. 3
Extended Data Fig. 3. Features of amphioxus promoters derived from CAGE-seq.
ac, Heat maps showing AT and CG signal, nucleosome positioning (derived from the NucleoATAC signal), promoter width (interquantile (IQ) range), first exon length and YY1 (a) or TATA box (b, c) motifs around ubiquitous (a, n = 3,710), embryonic-specific (b, n = 1,451) and tissue-specific (c, n = 4,154) promoters, sorted by promoter width. Position 0 corresponds to the main TSS. d, Ubiquitous promoters show strong evidence for a nucleosome positioned downstream of the CAGE TSS, as judged from the 12-bp periodicity of W and S nucleotide density. e, Per cent of promoters of each category that have associated TATA box or YY1 motifs. Number of promoters: embryo, 1,451; female gonads, 1,494; hepatic, 2,420; neural tube, 1,734; and ubiquitous, 3,710. f, IQ width distribution of ubiquitous promoters (n = 3,710) with and without an associated YY1 motif. P value corresponds to two-sided Wilcoxon sum-rank tests.
Extended Data Fig. 4
Extended Data Fig. 4. Characteristics and evolution of bidirectional promoters.
a, Number of bidirectional and non-bidirectional promoters identified for each regulatory category. P values correspond to two-sided Fisher’s exact tests against ubiquitous promoters. b, Distribution of distance between bidirectional promoters in each species (amphioxus, 1,975; zebrafish, 549; and mouse, 876 pairs of promoters). The distance between amphioxus peaks closely corresponds to integral nucleosome spacing. c, Heat maps of TA, CG and nucleosome occupancy (derived from the NucleoATAC signal) around bidirectional promoter pairs in amphioxus (n = 1,975), mouse (n = 876) and zebrafish (n = 549), arranged by the distance between the two CAGE TSSs. In amphioxus, both TA and NucleoATAC signals indicate regions in which 0, 1 or 2 nucleosomes separate promoters. d, Enriched GO terms for genes associated with bidirectional promoters in amphioxus. Uncorrected P values correspond to two-sided Fisher’s exact tests as provided by topGO. e, Inferred evolutionary dynamics of 372 putatively ancestral bidirectional promoters among chordate groups. Red, number of inferred losses and disentanglements; black, number of detected bidirectional promoters by CAGE-seq (in brackets) or microsynteny (neighbouring genes in a 5′ to 5′ orientation) for each species. In parentheses, number of lost and disentangled (red) or retained (black) bidirectional promoters when considering only the cases supported by CAGE-seq. f, In vertebrates, disentanglement was not accompanied by a general increase in the fraction of bidirectional promoters with antisense non-coding transcription, as shown by the relative number of CAGE clusters identified as bidirectional promoters that are composed of two protein-coding genes (‘Prot-Prot’) or of one protein-coding and one non-coding or non-annotated locus (‘Prot-NC’). The total number of uniquely annotated, protein-coding-associated CAGE promoters was amphioxus, 11,789; mouse, 13,654; and zebrafish, 14,014.
Extended Data Fig. 5
Extended Data Fig. 5. 5mC dynamics in amphioxus.
a, 5mC levels across gene bodies (n = 20,569) from different expression deciles (0th, not expressed; 10th, highest expression). TTS, transcription termination site. b, Scatter plots of levels of 5mC and CpG density, H3K4me3, H3K27me3 and H3K27ac in 1-kbp genomic bins sorted on the basis of feature rank. The red line tracks anti-correlation between feature density and rank number (a low rank number implies high feature density). The golden line represents a smoothing spline of 5mC signal versus feature rank number. Pearson correlation coefficients (R) are displayed in the top right corner of each panel. c, UCSC browser excerpt of 5mC patterns for selected regions. d, Percentage of methylated CpG dinucleotides in 8-hpf (n = 19,657,388), 15-hpf (n = 21,247,615), 36-hpf (n = 21,702,000) and hepatic (adult, n = 19,240,245) amphioxus samples. Black line indicates the fraction between methylated and non-methylated CpGs at each stage. e, Box plots of average 5mC levels in different types of differentially methylated regions (DMRs) at each stage. ΔmCG denotes the change in the fraction of methylated CpGs between the two stages used for identification of DMRs (red (hyper) and blue (hypo) boxes). The number of DMRs were as follows: 8 hpf(+)–15 hpf(−), 768; 8 hpf(−)–15 hpf(+), 701; 15 hpf(+)–36 hpf(−),1,066; 15 hpf(−)–36 hpf(+), 1,025; 36 hpf(+)–liver(−), 22,333; and 36 hpf(−)–liver(+), 4,154. The coordinates for all DMRs are provided in Supplementary Data 2, dataset 11. f, Distribution of DMR sizes (in bp). g, Genomic distribution of DMRs identified for each sample. ‘Other trans.’, DMRs that overlap with gene models that were not defined as being supported by orthology. h, Expression (cRPKMs) of the amphioxus Tet orthologue in embryos and adult tissues. Error bars represent standard error of the mean (the number of replicates for each RNA-seq dataset is provided in Fig. 1a).
Extended Data Fig. 6
Extended Data Fig. 6. Developmental 5mC dynamics at APREs in amphioxus.
a, k-means clustering (n = 2) of 5mC signal over embryo-specific open-chromatin regions (that is, APREs), assessed by ATAC-seq (Supplementary Table 10). b, The most significantly enriched transcription-factor binding-site motifs in APREs that display different developmental 5mC patterns in Fig. 2b. Uncorrected P values as provided by MEME. All plotted motifs had Benjamini-corrected q values of 0. c, GO enrichment for genes associated with cluster 1 (top) or cluster 2 (bottom) APREs from Fig. 2b. Uncorrected P values correspond to two-sided Fisher’s exact tests as calculated by topGO. d, Distribution of expression values (cRPKMs) across all samples for genes associated with cluster 1 (top, n = 1,114) or cluster 2 (bottom, n = 1,594) APREs from Fig. 2b. e, Distribution of the coefficients of variation for genes associated with cluster 1 or cluster 2 APREs from Fig. 2b, as well as all (n = 19,710), trans-dev (n = 357) and house-keeping (n = 862) amphioxus genes. f, Example of a potentially conserved (zebrafish to amphioxus) DMR associated with yap1, a major transcription factor of the Hippo pathway. The inset corresponds to the region highlighted in green. The two ohnologous genomic regions in zebrafish are shown in Supplementary Fig. 2. Additional cases included genes that contained APREs that are likely to regulate neighbouring liver-specific genes (‘bystander’ genes) (Supplementary Table 11). The number of replicates for each experiment displayed in each track is provided in Fig. 1a.
Extended Data Fig. 7
Extended Data Fig. 7. Periods of maximal transcriptomic similarity across chordate development.
a, Stages of minimal transcriptomic distance obtained in the comparison between amphioxus and zebrafish for four alternative distance methods (Euclidean, Manhattan and Jensen–Shannon distances, and Spearman correlation). Values are normalized to minimal (0) and maximal (1) for each metric. b, Stages of minimal transcriptomic divergence shown as the smallest Jensen–Shannon distance between zebrafish stages and four chordate species. The shaded area surrounding the line that connects the stages is the standard deviation, derived from 100 bootstrap replicates of the orthologous gene set. The grey box outlines the ‘phylotypic’ period of minimal divergence; the corresponding periods are indicated for each species as the range provided by the two closest stages. c, d, Heat maps of pairwise transcriptomic distances (Jensen–Shannon distance metric) between pairs of chordate species, amphioxus and frog (c), and zebrafish and frog (d). In both heat maps, the smallest distance (red) indicates maximal similarity of the transcriptome. The periods of minimal divergence of the transcriptome are earlier for the amphioxus–frog comparison than for the zebrafish–frog comparison.
Extended Data Fig. 8
Extended Data Fig. 8. Comparison of temporal gene expression profiles in amphioxus and zebrafish.
a, Heat map showing the significance of orthologous gene overlap between Mfuzz clusters across eight matched developmental stages in amphioxus and zebrafish as derived from an upper-tail hypergeometric test. Some clusters with highly significant overlap are highlighted, and their corresponding temporal expression profiles are shown. The profiles of all clusters for the two species are included in Supplementary Figs. 3, 4. Exact P values and sample sizes are provided in Supplementary Data 2, dataset 8. b, Distributions of NACC values for orthologous genes (in red) or random orthology assignments (blue) for each species against human. Lower NACC values imply higher conservation of relative expression. Solid lines show the median, and the dashed lines mark the interquartile range. The number of orthologue pairs were as follows: mouse, 15,109; zebrafish, 16,480; and amphioxus, 8,633. c, Differentially enriched GO terms among pairs of zebrafish and amphioxus Mfuzz clusters with significant orthologue overlap (P < 10−10 upper-tail hypergeometric test) with homochronic (48 pairs) and heterochronic (35 pairs) patterns. The GO enrichment of a group was calculated as the number of cluster pairs with significant enrichment for that given term (Supplementary Data 2, dataset 12). d, Top, per cent of zebrafish genes from each developmental pathway we studied, based on the temporal similarity of their corresponding Mfuzz cluster (homochronic, heterochronic or intermediate). Only genes belonging to clusters with significant orthologue overlap were analysed; the number of genes is provided in parenthesis below the pathway name. Bottom, pairwise comparisons between developmental pathway distributions. P values correspond to Bonferroni-corrected, two-sided, three-way Fisher’s exact tests.
Extended Data Fig. 9
Extended Data Fig. 9. Higher regulatory content in vertebrate genomes.
a, Distribution of the number of APREs per the regulatory landscape of a gene (as determined by GREAT), at different developmental stages or cell lines of four chordate species (amphioxus, zebrafish, medaka and mouse). Orthologous gene families are split according to the number of ohnologues that are retained per family (from 1 to 4, using mouse as a reference species for the ohnologue counts). The percentage of developmental regulatory genes (trans-dev, TD) in each category is indicated. b, P values of one-sided Mann–Whitney U tests against the amphioxus peak-number distribution using 100% of the minimum read coverage for different levels of down-sampling of the zebrafish and medaka samples. c, Distribution of the number of APREs in the GREAT region of the gene, called after down-sampling the reads of the two vertebrate samples to different fractions of the sample with the minimum effective coverage in our study (~21 reads per kbp for the 36-hpf sample in amphioxus). Asterisks correspond to the significance of the P values of Mann–Whitney U tests against the amphioxus peak-number distribution using 100% of the minimum-read coverage. The number of genes per box was as follows: amphioxus, 20,569; zebrafish, 20,053; and medaka, 15,978. d, As in a, but with gene families separated according to functional categories (housekeeping, trans-dev and others). e, Number of APREs per regulatory landscape determined using 4C-seq, for 58 members of 11 trans-dev families. The number of genes probed in each species is indicated on the x axis. f, Distribution of the length of the intergenic regions from the genes plotted in a for the indicated stages. g, Distributions of GREAT-region sizes (left) and number of APREs per gene (right) for a subset of 10,186 pairs of genes with matched GREAT-region size distributions (±500 bp) in amphioxus and zebrafish. h, Distributions of intergenic-region sizes (left) and number of APREs per gene (right) for a subset of 13,941 pairs of genes with matched intergenic-region size distributions (±500 bp) in amphioxus and zebrafish. P values correspond to Mann–Whitney U tests: *0.05 > P value ≥ 0.01, **0.01 > P value ≥ 0.001, ***P value < 0.001. In a and d, all comparisons between each distribution of a vertebrate species and the equivalent distribution in amphioxus produced significant P values (P value < 0.001); for simplicity, in these panels asterisks are not shown. Exact P values and sample sizes are provided in Supplementary Data 2, dataset 8.
Extended Data Fig. 10
Extended Data Fig. 10. Regulatory evolution after vertebrate WGD.
a, b, For each mouse (a) or frog (b) gene, the number of positive-expression domains across nine equivalent samples is subtracted from the number of domains in which the single amphioxus orthologue is expressed. The distribution of the difference in domains between the amphioxus and the vertebrate species is plotted for 1-to-1 orthologues (2,450 and 2,484 gene pairs for mouse and frog, respectively; yellow), individual ohnologues (3,011 and 2,637 gene pairs in 1,212 and 1,094 families for mouse and frog, respectively; lilac) and the union of all vertebrate ohnologues in a family (purple). Bottom left, log2 of the ratio between the sum of all mouse (a) or frog (b) genes with negative versus positive score for each orthology group. ‘Sum’ (black), binarization of family expression is performed after summing the raw expression values for all ohnologues. ce, Density scattered plot of the τ values for pairs of mouse (c, n = 1,502), frog (d, n = 1,495) and zebrafish (e, n = 1,498) and amphioxus orthologues from multi-gene families in vertebrates. f, g, Number of ohnologues with strong specialization (≤2 remaining expression domains) in mouse (f) or frog (g) expressed in each tissue or developmental stage. h, i, Representative in situ hybridization assays in zebrafish embryos for different members of specialized families (right) and for the single amphioxus orthologue (left) (Chordc1 and Itgb1bp2 (h) and Rab11 (i)). Zebrafish image data for this paper were retrieved from the Zebrafish Information Network (ZFIN), University of Oregon, Eugene, OR 97403-5274; (http://zfin.org/, accessed May 2018) and are used with the permission of B. Thisse. Amphioxus in situ hybridization was performed once using 10 embryos per probe, all of which showed the same expression pattern. j, Distribution of the dN/dS ratio between human and mouse for different classes of ohnologues based on their fate after WGD. k, l, Distribution of the percentage of nucleotide sequence similarity (k) or dN/dS ratio (l) between human and mouse for ohnologues grouped by the number of expression domains lost. m, Distribution of the number of APREs within GREAT regions for zebrafish ohnologues grouped by the number of expression domains lost. P values in jm correspond to Wilcoxon sum-rank tests. *0.5 > P value ≥ 0.01; **0.01 > P value ≥ 0.001; ***P value < 0.001.

References

    1. Bertrand S, Escriva H. Evolutionary crossroads in developmental biology: amphioxus. Development. 2011;138:4819–4830. doi: 10.1242/dev.066720. - DOI - PubMed
    1. Dehal P, Boore JL. Two rounds of whole genome duplication in the ancestral vertebrate. PLoS Biol. 2005;3:e314. doi: 10.1371/journal.pbio.0030314. - DOI - PMC - PubMed
    1. Putnam NH, et al. The amphioxus genome and the evolution of the chordate karyotype. Nature. 2008;453:1064–1071. doi: 10.1038/nature06967. - DOI - PubMed
    1. Holland LZ, et al. The amphioxus genome illuminates vertebrate origins and cephalochordate biology. Genome Res. 2008;18:1100–1111. doi: 10.1101/gr.073676.107. - DOI - PMC - PubMed
    1. International Human Genome Sequencing Consortium Initial sequencing and analysis of the human genome. Nature. 2001;409:860–921. doi: 10.1038/35057062. - DOI - PubMed

Publication types