

Potential targets of TMEM176A in the growth of glioblastoma cells
- PMID: 30464524
- PMCID: PMC6223399
- DOI: 10.2147/OTT.S179725
Potential targets of TMEM176A in the growth of glioblastoma cells
Abstract
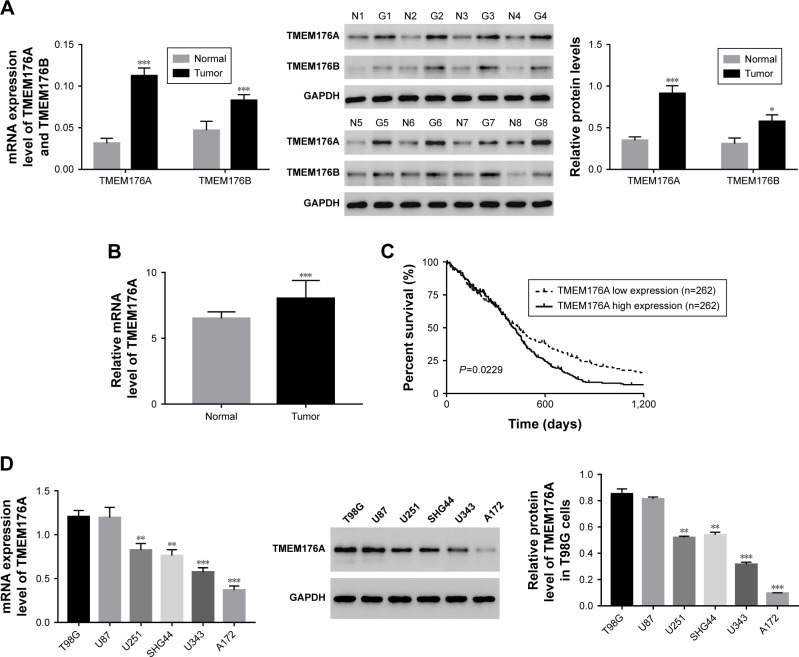
Background: Human transmembrane protein 176A (TMEM176A) is upregulated in several tumors. Growing evidence has suggested the high clinical value of TMEM176A as a biomarker for early tumor diagnosis. However, less is known about the function of TMEM176A in glioblastomas (GBMs).
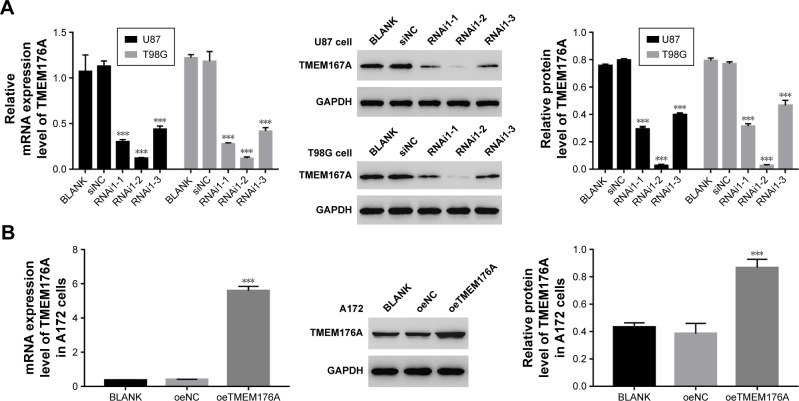
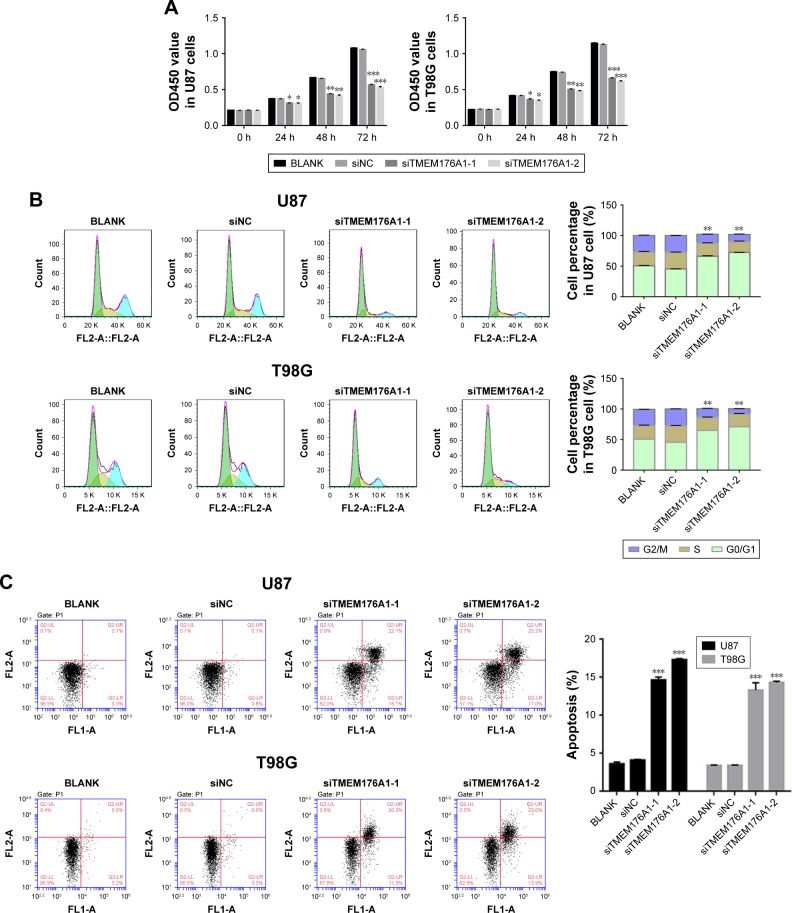
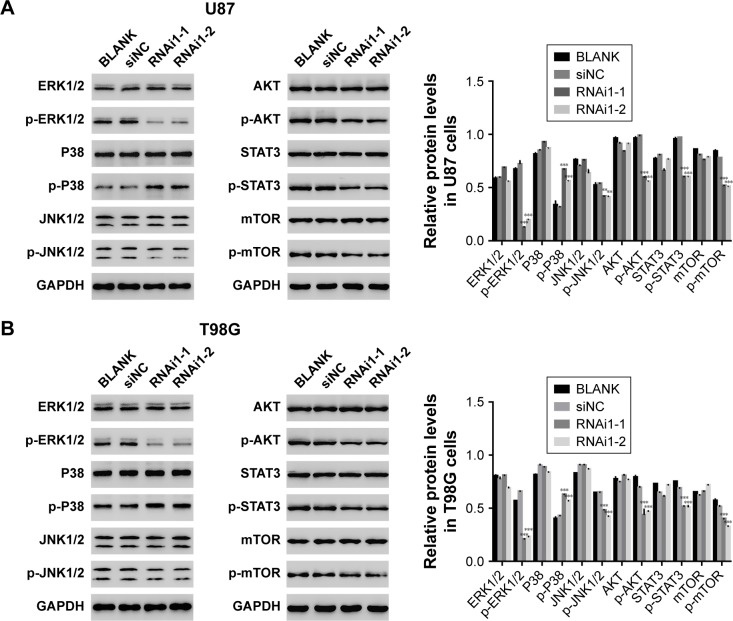
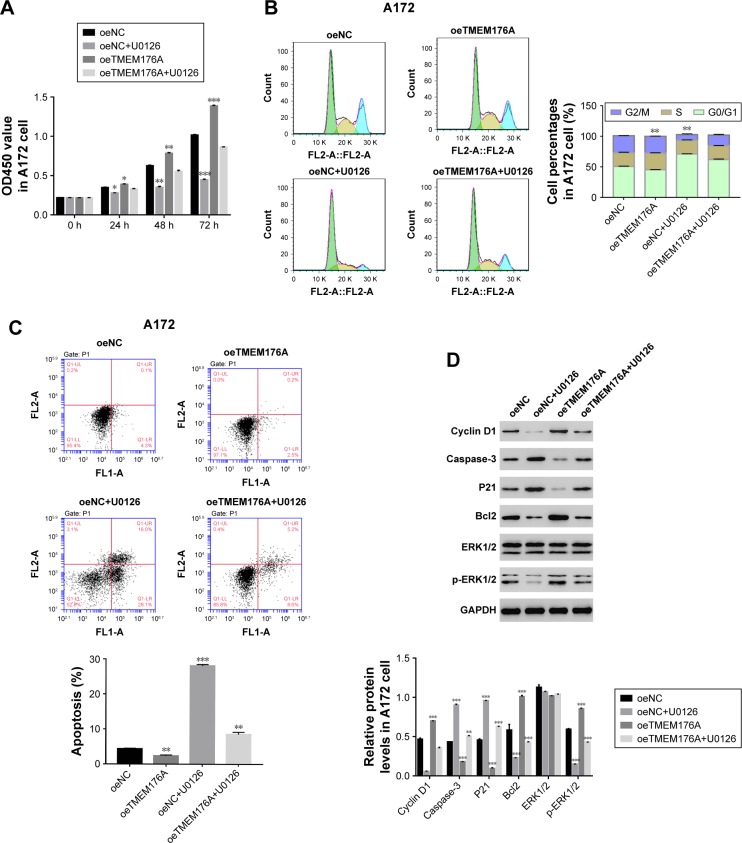
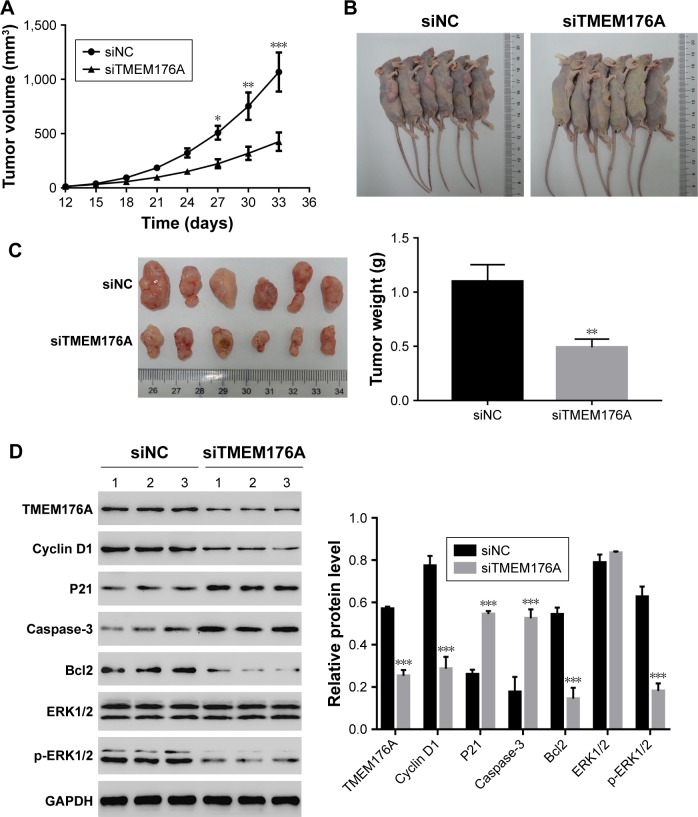
Methods: In this study, we systematically analyzed the effect of TMEM176A knockdown and overexpression in GBM cells (U87, T98G and A172) on cell proliferation, cell cycle and cell apoptosis.
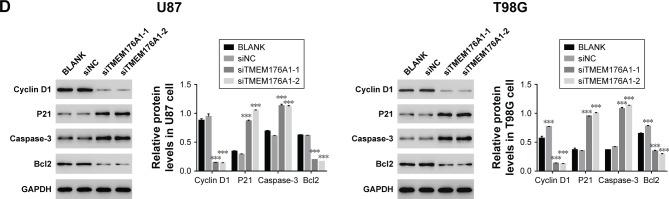
Results: Our results indicated that TMEM176A acted as a tumor-promoting factor in GBM cells. Moreover, a specific ERK1/2 inhibitor, U0126, suppressed the function of TMEM176A in GBM cells. Therefore, we proposed that TMEM176A may be involved in a pathway including ERK1/2 in the regulation of the cell cycle. Moreover, we also found that TMEM176A affected the expression of Bcl2 and played a central role in apoptosis of GBM cells.
Conclusion: Taken together, our results not only elucidated the multiple functions of TMEM176A in GBM cells but also provided a deep insight into the potential targets of TMEM176A in the growth of GBM cells.
Keywords: ERK1/2; TMEM176A; cell apoptosis; cell cycle; glioblastomas.
Conflict of interest statement
Disclosure The authors report no conflicts of interest in this work.
Figures
Similar articles
-
TMEM176A acts as a tumor suppressor gene in pancreatic cancer by inhibiting ERK signaling.Discov Med. 2020 Nov-Dec;30(161):145-153. Discov Med. 2020. PMID: 33593482
-
Multi-omics approaches establishing histone modification based prognostic model in glioma patients and further verification of the carcinogenesis mechanism.Funct Integr Genomics. 2023 Sep 21;23(4):307. doi: 10.1007/s10142-023-01229-3. Funct Integr Genomics. 2023. PMID: 37730879
-
Overexpression of Tripartite Motif-Containing 48 (TRIM48) Inhibits Growth of Human Glioblastoma Cells by Suppressing Extracellular Signal Regulated Kinase 1/2 (ERK1/2) Pathway.Med Sci Monit. 2019 Nov 8;25:8422-8429. doi: 10.12659/MSM.916024. Med Sci Monit. 2019. PMID: 31703057 Free PMC article.
-
Epigenetic silencing of TMEM176A activates ERK signaling in human hepatocellular carcinoma.Clin Epigenetics. 2018 Nov 6;10(1):137. doi: 10.1186/s13148-018-0570-4. Clin Epigenetics. 2018. PMID: 30400968 Free PMC article.
-
Epigenetic silencing of TMEM176A promotes esophageal squamous cell cancer development.Oncotarget. 2017 Jul 25;8(41):70035-70048. doi: 10.18632/oncotarget.19550. eCollection 2017 Sep 19. Oncotarget. 2017. PMID: 29050260 Free PMC article.
Cited by
-
Formulating a TMEM176B blocker in chitosan nanoparticles uncouples its paradoxical roles in innate and adaptive antitumoral immunity.Int J Biol Macromol. 2024 Nov;279(Pt 3):135327. doi: 10.1016/j.ijbiomac.2024.135327. Epub 2024 Sep 3. Int J Biol Macromol. 2024. PMID: 39236955
-
TMEM176B Promotes EMT via FGFR/JNK Signalling in Development and Tumourigenesis of Lung Adenocarcinoma.Cancers (Basel). 2024 Jul 3;16(13):2447. doi: 10.3390/cancers16132447. Cancers (Basel). 2024. PMID: 39001509 Free PMC article.
-
IP-Se-06, a Selenylated Imidazo[1,2-a]pyridine, Modulates Intracellular Redox State and Causes Akt/mTOR/HIF-1α and MAPK Signaling Inhibition, Promoting Antiproliferative Effect and Apoptosis in Glioblastoma Cells.Oxid Med Cell Longev. 2022 Mar 22;2022:3710449. doi: 10.1155/2022/3710449. eCollection 2022. Oxid Med Cell Longev. 2022. PMID: 35360199 Free PMC article.
-
An in silico comparative transcriptome analysis identifying hub lncRNAs and mRNAs in brain metastatic small cell lung cancer (SCLC).Sci Rep. 2022 Oct 27;12(1):18063. doi: 10.1038/s41598-022-22252-7. Sci Rep. 2022. PMID: 36302939 Free PMC article.
-
TMEM106A transcriptionally regulated by promoter methylation is involved in invasion and metastasis of hepatocellular carcinoma.Acta Biochim Biophys Sin (Shanghai). 2022 Jul 25;54(7):1008-1020. doi: 10.3724/abbs.2022069. Acta Biochim Biophys Sin (Shanghai). 2022. PMID: 35713314 Free PMC article.
References
LinkOut - more resources
Full Text Sources
Miscellaneous
