. 2018 Aug 24;7(1):19-31.
doi: 10.1016/j.jcmgh.2018.08.005. eCollection 2019.

NHE8 Deficiency Promotes Colitis-Associated Cancer in Mice via Expansion of Lgr5-Expressing Cells

Affiliations

NHE8 Deficiency Promotes Colitis-Associated Cancer in Mice via Expansion of Lgr5-Expressing Cells

Hua Xu et al. Cell Mol Gastroenterol Hepatol. .

Abstract

Background & aims: Lgr5 overexpression has been detected in colorectal cancers (CRCs), including some cases of colitis-associated CRCs. In colitis-associated CRCs, chronic inflammation is a contributing factor in carcinogenesis. We recently reported that intestinal Na+/H+ exchanger isoform 8 (NHE8) plays an important role in intestinal mucosal protection and that loss of NHE8 expression results in an ulcerative colitis-like condition. Therefore, we hypothesized that NHE8 may be involved in the development of intestinal tumors.

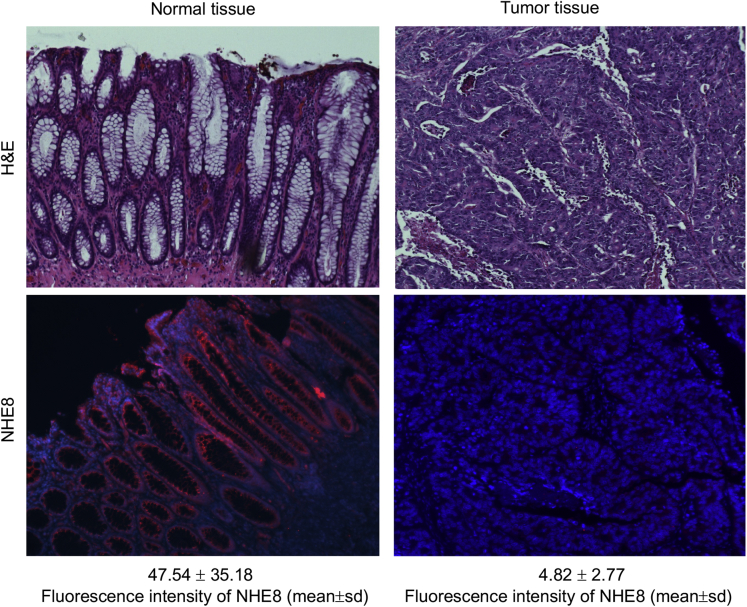
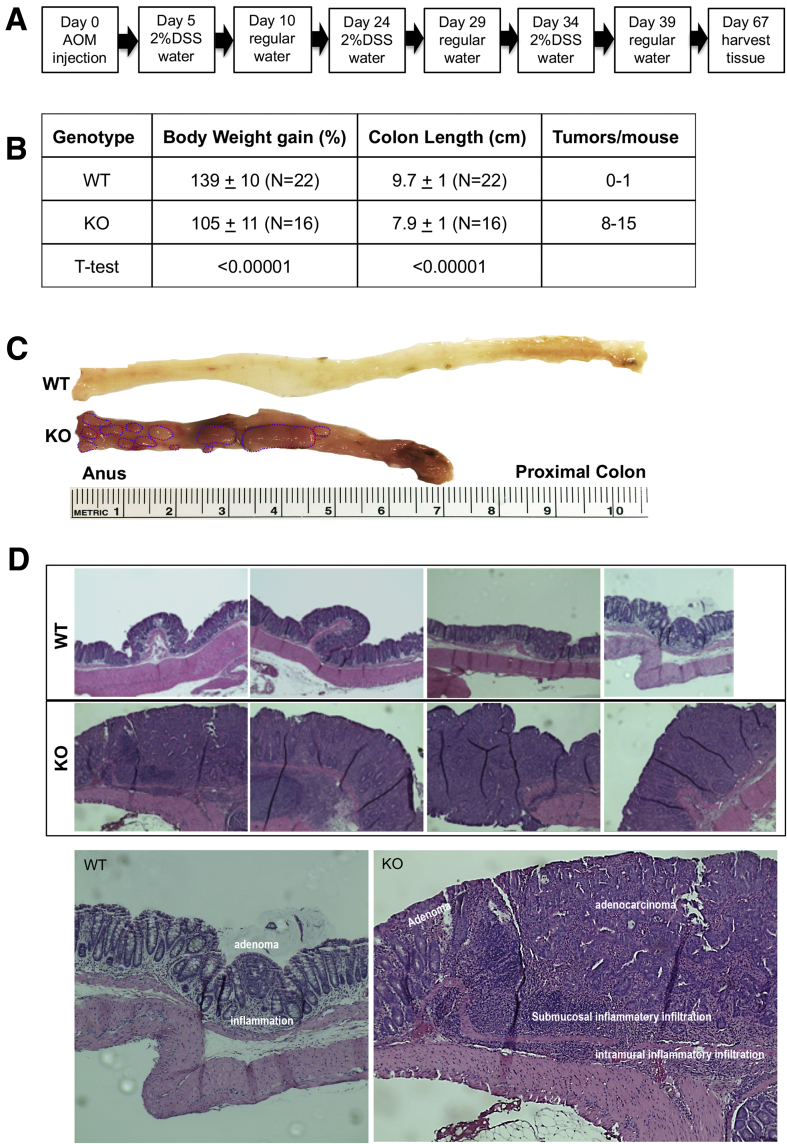
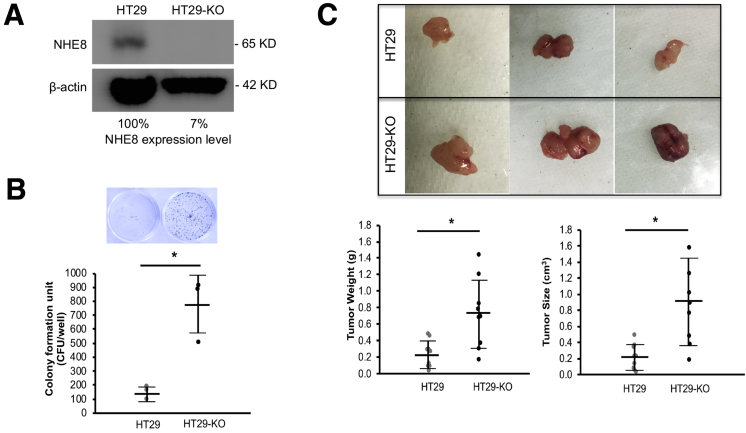
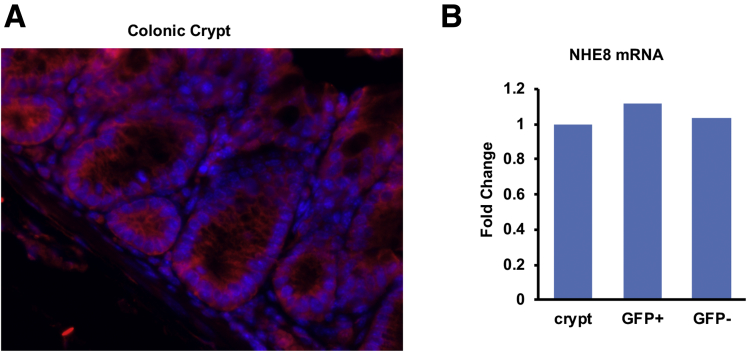
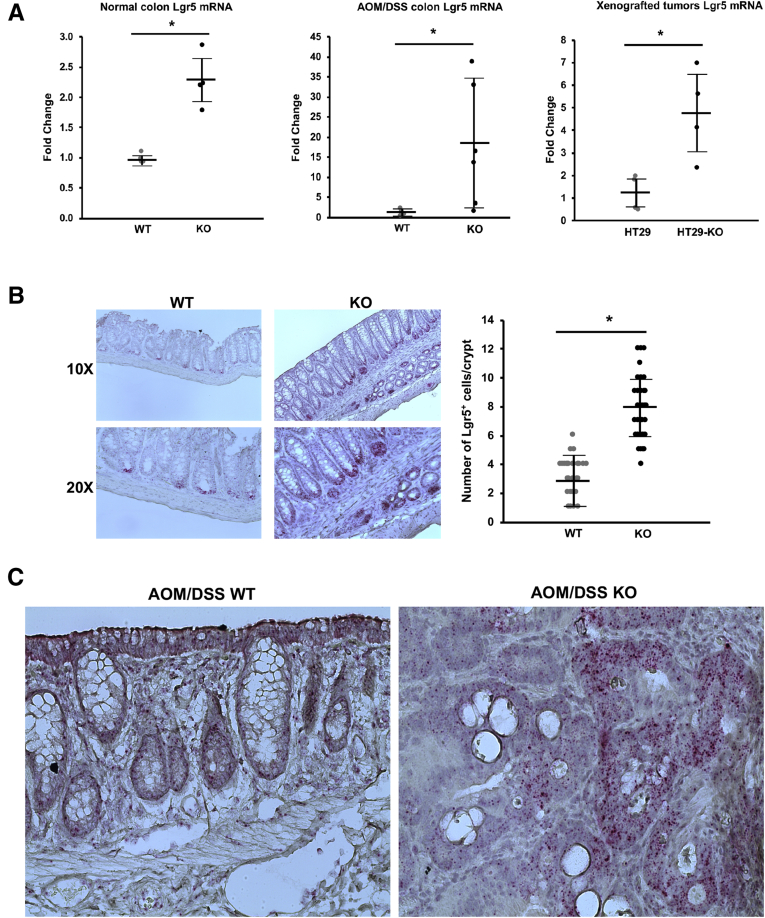
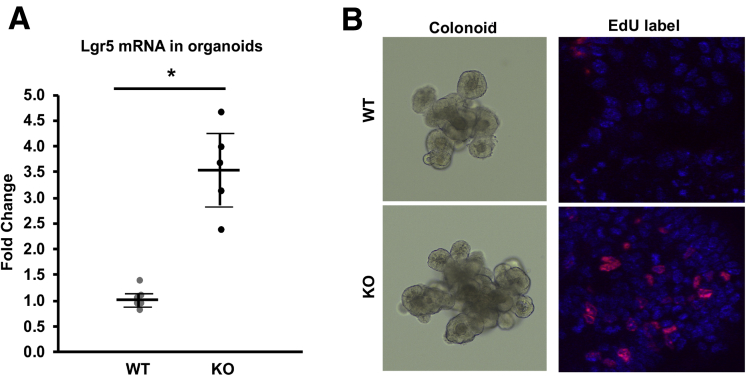
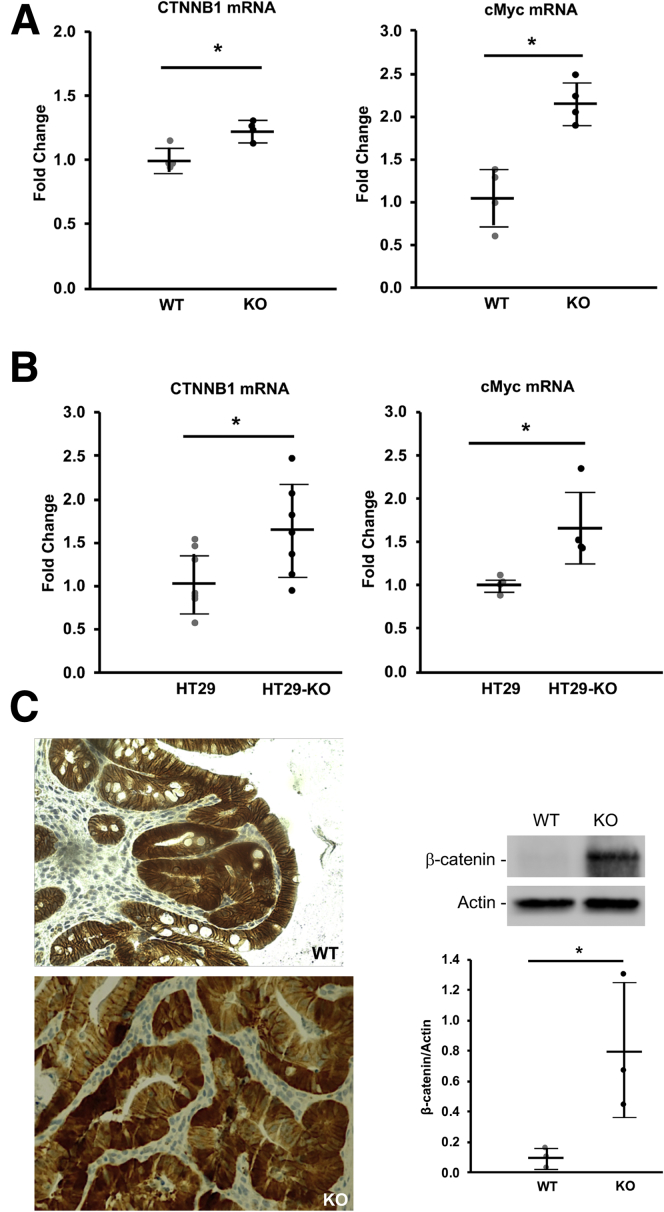
Methods: We assessed NHE8 expression in human CRCs by immunohistochemistry and studied tumor burden in NHE8 knockout (KO) mice using an azoxymethane/dextran sodium sulfate colon cancer model. We also evaluated cell proliferation in HT29NHE8KO cells and assessed tumor growth in NOD scid gamma (NSG) mice xenografted with HT29NHE8KO cells. To verify if a relationship exists between Lgr5 and NHE8 expression, we analyzed Lgr5 expression in NHE8KO mice by polymerase chain reaction and in situ hybridization. Lgr5 expression and cell proliferation in the absence of NHE8 were confirmed in colonic organoid cultures. The expression of β-catenin and c-Myc also were analyzed to evaluate Wnt/β-catenin activation.

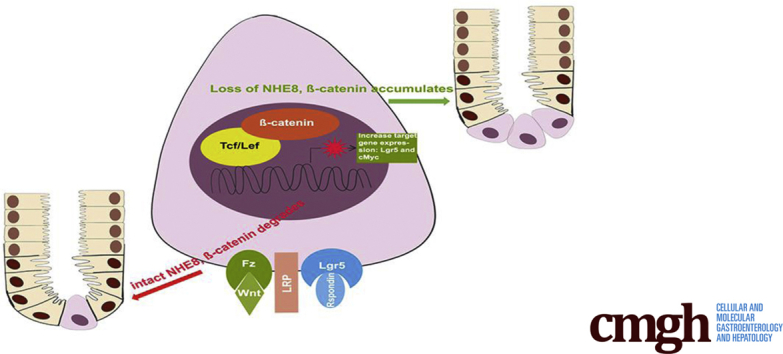
Results: NHE8 was undetectable in human CRC tissues. Although only 9% of NHE8 wild-type mice showed tumorigenesis in the azoxymethane/dextran sodium sulfate colon cancer model, almost 10 times more NHE8KO mice (89%) developed tumors. In the absence of NHE8, a higher colony formation unit was discovered in HT29NHE8KO cells. In NSG mice, larger tumors developed at the site where HT29NHE8KO cells were injected compared with HT29NHE8 wild type cells. Furthermore, NHE8 deficiency resulted in increased Lgr5 expression in the colon, in HT29-derived tumors, and in colonoids. The absence of NHE8 also increased Wnt/β-catenin activation.

Conclusions: NHE8 might be an intrinsic factor that regulates Wnt/β-catenin in the intestine.

Keywords: AOM, azoxymethane; CRC, colorectal cancer; CRISPR/Cas9, clustered regularly interspaced short palindromic repeats and CRISPR-associated protein 9; Colorectal Tumor; DMEM, Dulbecco's modified Eagle medium; DSS, dextran sodium sulfate; EGFP, enhanced green fluorescent protein; EdU, 5-ethynyl-2’-deoxyuridine; FACS, fluorescence-activated cell sorter; KO, knockout; Lgr5; NHE, Na+/H+ exchanger; NHE8; NSG, NOD scid gamma; PCR, polymerase chain reaction; UC, ulcerative colitis; WT, wild type; mRNA, messenger RNA.


Figures

None
Graphical abstract
Figure 1
Figure 1
NHE8 expression in the normal colonic tissue and colorectal adenocarcinoma. Human colonic tissue sections obtained from the Pathology Laboratory at the University of Arizona were reacted with NHE8 antibody following the procedure described in the Materials and Methods section. Upper panels: H&E staining for normal colonic mucosa (left) and colorectal adenocarcinoma (right). Lower panels: NHE8 immunohistochemistry staining for normal colonic mucosa (left) and colorectal adenocarcinoma (right). Strong NHE8 expression in colonic epithelial lining and cancer cells lose NHE8 expression. NHE8 is labeled with red, and nuclei are labeled with blue. The number (means ± SD) below the NHE8 immunohistochemistry pictures shows the fluorescent intensity of NHE8 staining.
Figure 2
Figure 2
AOM/DSS-induced colonic tumors in NHE8WT and NHE8KO mice. NHE8KO and NHE8WT male mice (age, 7–8 wk) were administered intraperitoneal AOM at a dose of 7.4 mg/kg body weight. Five days after AOM administration, mice were given 2% DSS in drinking water for 5 days, followed by regular water for 14 days. The DSS/water treatment was repeated 3 times. Mice were fed with regular water for 28 days after the last DSS treatment and then killed for further analysis. WT, NHE8WT mice; KO, NHE8KO mice. (A) AOM/DSS treatment schedule. (B) Measurement of body weight, colon length, and tumors in AOM/DSS-treated mice. (C) Morphologic observation of colon surface in AOM/DSS-treated NHE8WT and NHE8KO mice. Colon tissues were collected from AOM/DSS-treated mice, and then cut open to expose the lumen inside the colon to observe tumors. The image is a representative picture from AOM/DSS-treated NHE8WT and NHE8KO mice. The circles in the picture indicate the tumors. (D) Histologic evaluation of tumors in AOM/DSS-treated NHE8WT and NHE8KO mice. Tissues from the distal colon were fixed and sectioned. H&E staining was used to show tissue morphology. Top panels: H&E stain images from 4 NHE8WT mice and 4 NHE8KO mice. Bottom panels: Representative images showing inflammation, infiltration, adenomas, and adenocarcinomas in tumor-bearing mice.
Figure 3
Figure 3
Colony formation assay in the absence of NHE8 in HT29 human colonic cells. (A) Western blot detection of NHE8 expression in HT29NHE8WT and HT29NHE8KO cells. HT29 cells were transfected with NHE8KO CRISP/Cas9 DNA. Total cell lysates were prepared 72 hours after transfection. NHE8 antibody was used to detect NHE8 protein expression in these cells. The number shows the relative expression levels of NHE8 in cells. HT29, cells without NHE8KO CRISP/Cas9 DNA transfection; HT29-KO, cells transfected with NHE8KO CRISP/Cas9 DNA. (B) Colony formation unit assay. HT29NHE8WT and HT29NHE8KO cells were seeded in a 24-well culture plate at a density of 1000 cells/well and cultured for 10 days. Cells were stained with crystal violet according to the procedure described in the Materials and Methods section. The wells then were examined and the colonies were counted. Top panel: Representative image from stained culture wells. Bottom panel: Summary data of colony counts. Results are means ± SD from 3 wells of cells. T-Test is used to examine the statistical significance. *P < .01 for HT29NHE8WT cells (HT29) vs HT29NHE8KO cells (HT29-KO). (C) Tumor derived from HT29NHE8WT and HT29NHE8KO cells. HT29NHE8WT and HT29NHE8KO cells (1000,000 cells in 100 μL/injection site) were injected into the left and right flanks of NSG mice, respectively. Four weeks after injection, mice were killed and tumors were examined. Top panels: Representative pictures of tumors taken from xenografted NSG mice. Bottom panel: Summary data of tumor weight and tumor size. Results are means ± SD from 9 mice. T-Test is used to examine the statistical significance. *P < .01 for HT29NHE8WT cells (HT29) vs HT29NHE8KO cells (HT29-KO).
Figure 4
Figure 4
NHE8 expression in the crypts and the colonic stem cell. (A) Immunohistochemical staining of NHE8 in the colonic crypt base in NHE8WT mice. Tissues from the distal colon were fixed and sectioned. The NHE8 antibody was used to detect NHE8 expression and localization. In the crypts, NHE8 was detected in almost all cells at the crypt base. NHE8 was labeled with red, and nuclei were labeled with blue. (B) PCR detection of NHE8 expression in stem cells (Lgr5+) and non–stem cells (Lgr5-). Colonic crypts were isolated from 4 Lgr5-EGFP male mice, and single-cell suspension was prepared for FACS. Total RNAs were purified from colon crypts, stem cells, and non–stem cells. Real-time PCR was performed to determine the expression of NHE8 in these samples. The bar chart shows the PCR result from isolated crypts and FACS sorted cells.
Figure 5
Figure 5
Lgr5 expression alteration in the absence of NHE8 function. (A) Total RNAs were purified from colonic tissues and used for real-time PCR to detect Lgr5 expression. Results are shown as means ± SD. T-Test used to examine the statistical significance. Left panel: Lgr5 expression in normal NHE8WT and NHE8KO colons from 8 mice (4 mice/group); *P < .015 for NHE8WT mice (WT) vs NHE8KO mice (KO). Middle panel: Lgr5 expression in AOM/DSS NHE8WT and NHE8KO colons from 12 mice (6 mice/group); *P < .01 for AOM/DSS-treated NHE8WT mice (WT) vs AOM/DSS-treated NHE8KO mice (KO). Right panel: Lgr5 expression in 8 tumors derived from HT29NHE8WT and HT29NHE8KO cells (4 tumors/group); *P < .01 for HT29NHE8WT cells (HT29) vs HT29NHE8KO cells (HT29-KO). (B) Lgr5 in situ hybridization using mouse colon tissue sections prepared from NHE8WT (WT) and NHE8KO (KO) mice. Left panels: Representative image from in situ hybridization experiments. Right panels: Summary data of Lgr5-positive cell counts (means ± SD) from 42 crypts observed in 2 mice. T-Test was used to examine the statistical significance. *P < .0001 for NHE8WT mice (WT) vs NHE8KO mice (KO). (C) Lgr5 in situ hybridization using mouse colon tissue sections prepared from AOM/DSS-treated NHE8WT (AOM/DSS WT) and NHE8KO (AOM/DSS KO) mice. According to the manufacturer’s instructions, the size and density of the reddots reflect the expression levels of Lgr5 in tissue sections. Strong Lgr5 signals were seen in tissue sections from AOM/DSS-treated NHE8KO mice (indicated by more and larger red dots).
Figure 6
Figure 6
Lgr5 expression and cell proliferation in colonoids. The entire colons from 3–4 mice (age, 7–8 wk) were collected and used for crypt isolation according to the procedure described in the Materials and Methods section. The final crypt pellets were mixed with Matrigel and seeded in 24-well culture plates. The colonoids were cultured in a conditioned medium containing Wnt3a–R-spondin–noggin. Culture medium was replaced every 3–4 days, and colonoids were passaged every 5–7 days. (A) Colonoids were cultured for 5 days and then collected for total RNA purification. Real-time PCR was performed to detect the expression of Lgr5. Results are means ± SD from 6 separate experiments. T-Test was used to examine statistical significance. *P < .01 for NHE8WT colonoids (WT) vs NHE8KO colonoids (KO). (B) Colonic organoids were cultured for 5 days, and then labeled with EdU according to the manufacturer’s instructions. The labeled cells were observed using a confocal microscope. Left panels: Representative images of live colonoids growing in Matrigel from NHE8WT (WT) and NHE8KO (KO) mice. Right panels: Organoids after EdU label. Red, EdU-labeled cells; blue, nuclei staining.
Figure 7
Figure 7
CTNNB1 and c-Myc expression detection. Total RNAs were purified from AOM/DSS colonic tissues and xenografted tumors. Real-time PCR was used to detect CTNNB1 and c-Myc expression. For ß-catenin immunohistochemical staining, tissue sections from AOM/DSS mice were used to react with ß-catenin antibody. (A) CTNNB1 and c-Myc expression in AOM/DSS-treated NHE8WT (WT) and NHE8KO (KO) mice. Results are means ± SD from 8 mice (4 mice/group). T-Test was used to examine the statistical significance. *P < .0004 for NHE8WT mice (WT) vs NHE8KO mice (KO). (B) CTNNB1 and c-Myc expression in xenografted tumors derived from HT29NHE8WT and HT29NHE8KO cells. Results are means ± SD from 4–7 tumors. T-Test was used to examine the statistical significance. *P < .02 for HT29NHE8WT cells (HT29) vs HT29NHE8KO cells (HT29-KO). (C) β-catenin detection in AOM/DSS-induced tumors. Tissues from distal colons were fixed and sectioned. An antibody specific against ß-catenin was used to detect ß-catenin expression and localization according to the procedure described in the Materials and Methods section. Left panels: Representative image from NHE8WT mice (top) and NHE8KO mice (bottom). In normal tissue, ß-catenin is located near the plasma membrane. In tumor tissue, ß-catenin is translocated inside the cells and/or in the nuclei. Right: Result of Western blot detection on β-catenin protein expression in AOM/DSS-treated mice. Results are means ± SD from 6 mice (3 mice/group). T-Test was used to examine the statistical significance. *P < .05 for AOM/DSS-treated NHE8WT mice (WT) vs AOM/DSS-treated NHE8KO mice (KO).

Comment in

  • Role of Membrane Transporters in Intestinal Cancers.
    Saksena S, Dudeja PK. Saksena S, et al. Cell Mol Gastroenterol Hepatol. 2019;7(1):241-242. doi: 10.1016/j.jcmgh.2018.09.016. Epub 2018 Oct 28. Cell Mol Gastroenterol Hepatol. 2019. PMID: 30585160 Free PMC article. No abstract available.

Similar articles

Cited by

References

    1. Ghishan F.K., Kiela P.R. Small intestinal ion transport. Curr Opin Gastroenterol. 2011;28:130–134. - PMC - PubMed
    1. Orlowski J., Grinstein S. Diversity of the mammalian sodium/proton exchanger SLC9 gene family. Pflugers Arch. 2004;447:549–565. - PubMed
    1. Zachos N.C., Tse M., Donowitz M. Molecular physiology of intestinal Na+/H+ exchange. Annu Rev Physiol. 2005;67:411–443. - PubMed
    1. Xu H., Chen H., Dong J., Lynch R., Ghishan F.K. Gastrointestinal distribution and kinetic characterization of the sodium-hydrogen exchanger isoform 8 (NHE8) Cell Physiol Biochem. 2008;21:109–116. - PubMed
    1. Xu H., Chen R., Ghishan F.K. Subcloning, localization, and expression of the rat intestinal sodium-hydrogen exchanger isoform 8. Am J Physiol Gastrointest Liver Physiol. 2005;289:G36–G41. - PubMed

Publication types

MeSH terms