. 2019 Feb;137(2):259-277.
doi: 10.1007/s00401-018-1937-5. Epub 2018 Nov 21.

TIA1 regulates the generation and response to toxic tau oligomers

Affiliations

TIA1 regulates the generation and response to toxic tau oligomers

Lulu Jiang et al. Acta Neuropathol. 2019 Feb.

Abstract

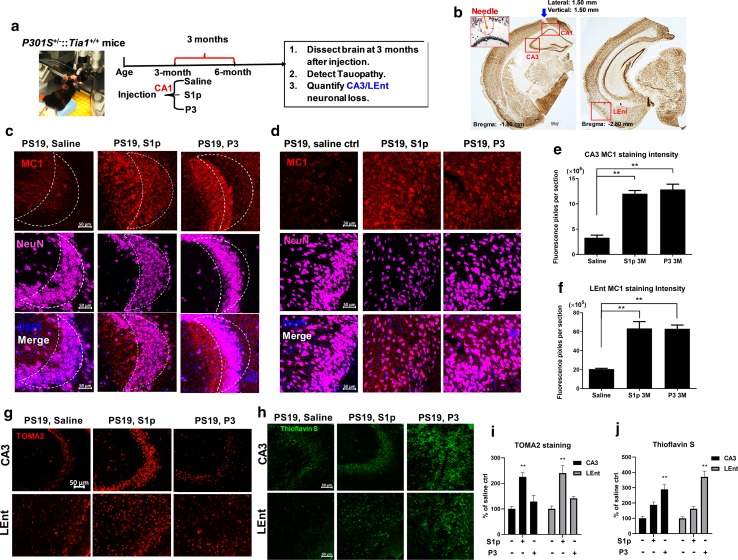
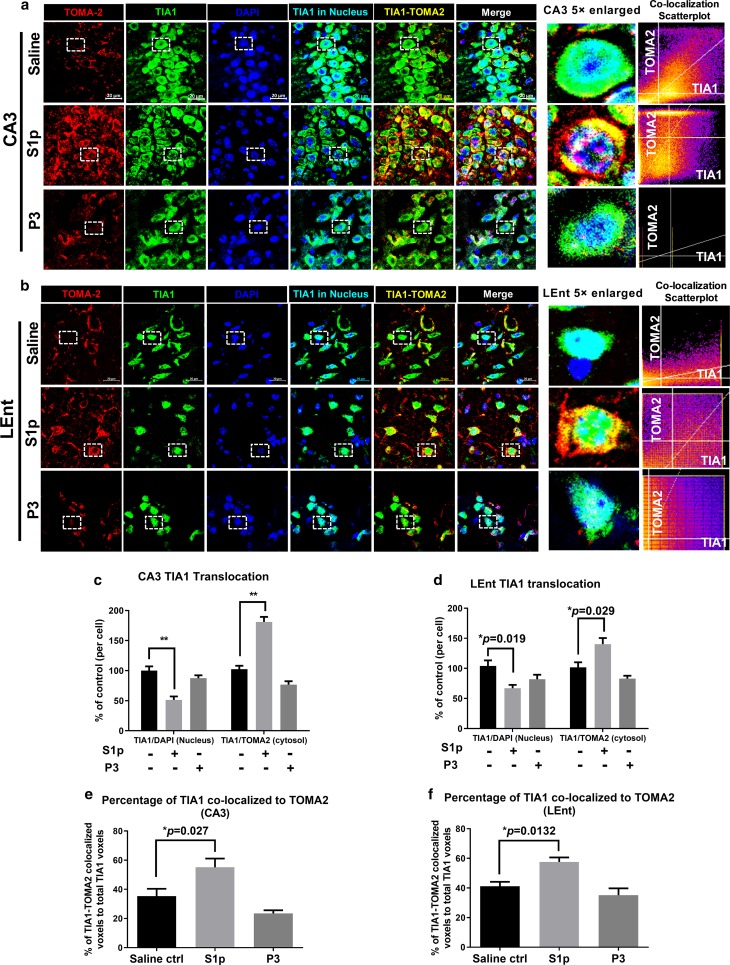
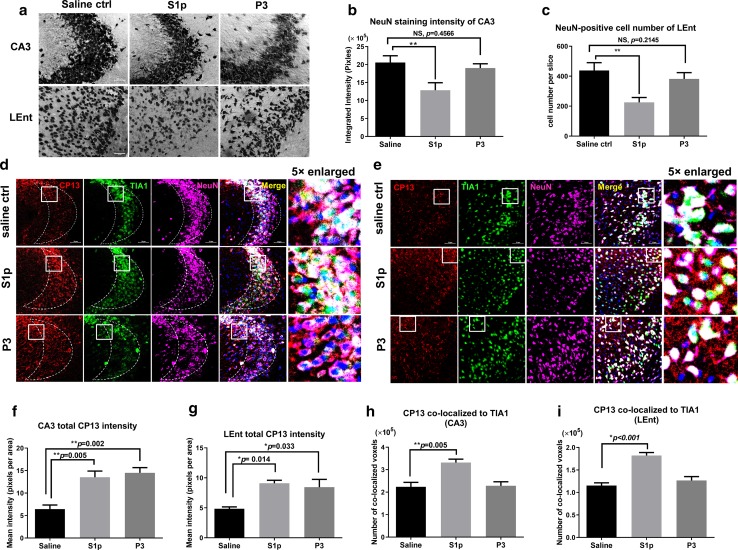
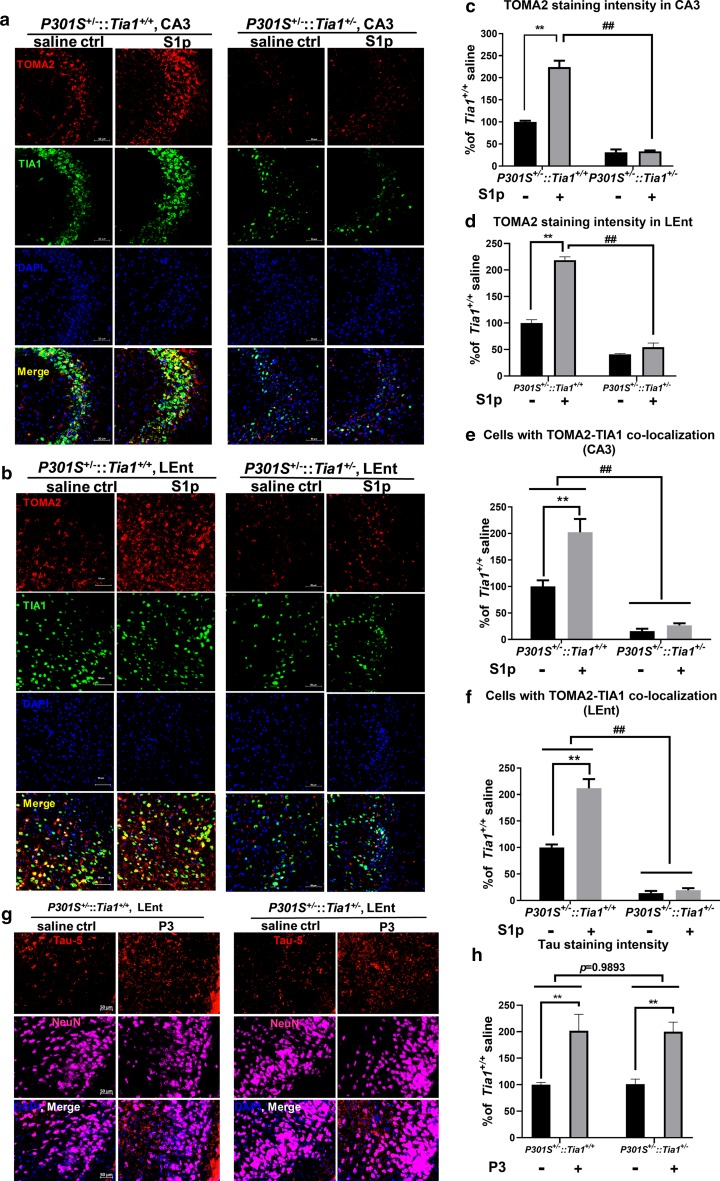
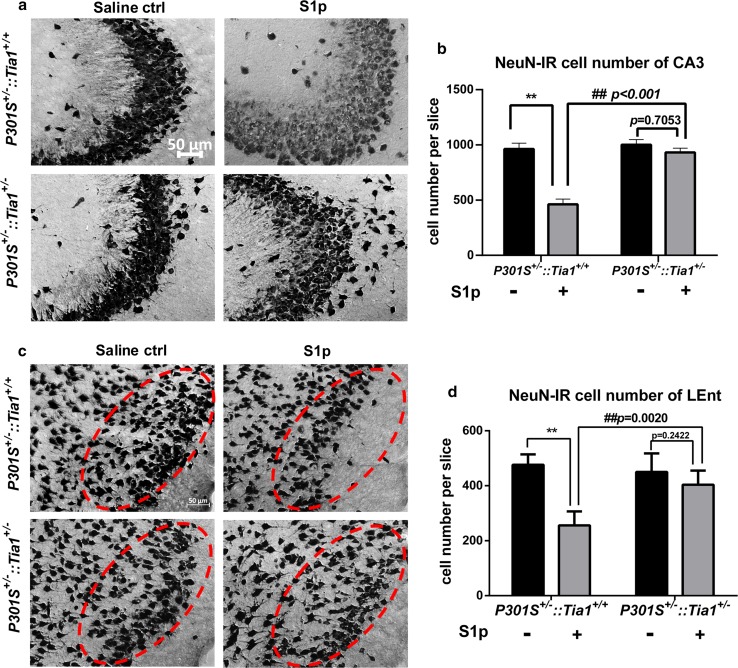
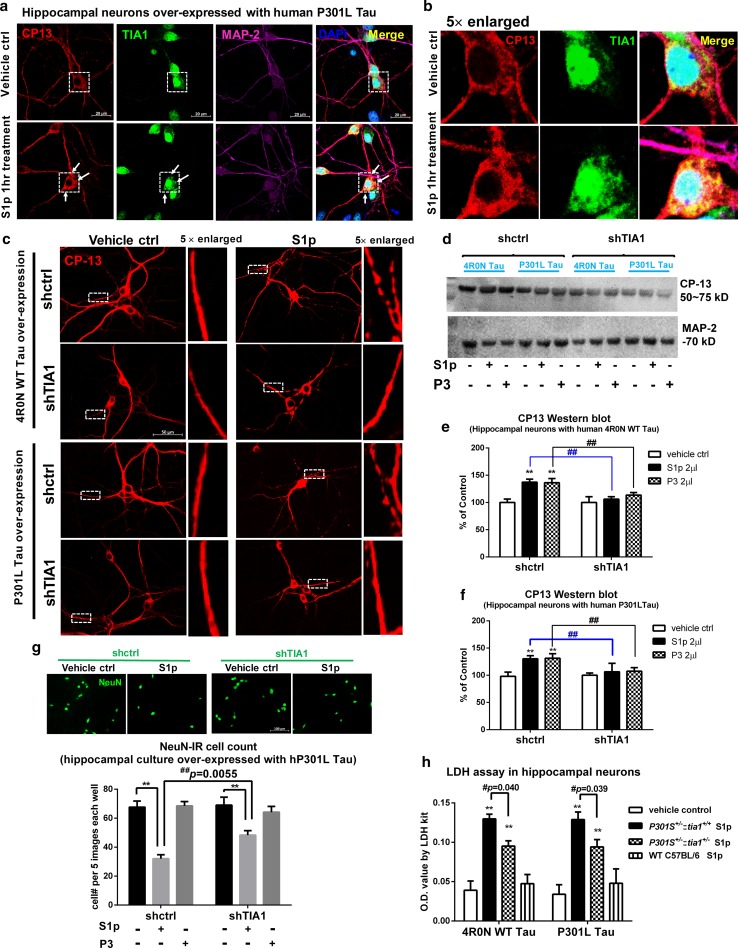
RNA binding proteins (RBPs) are strongly linked to the pathophysiology of motor neuron diseases. Recent studies show that RBPs, such as TIA1, also contribute to the pathophysiology of tauopathy. RBPs co-localize with tau pathology, and reduction of TIA1 protects against tau-mediated neurodegeneration. The mechanism through which TIA1 reduction protects against tauopathy, and whether TIA1 modulates the propagation of tau, are unknown. Previous studies indicate that the protective effect of TIA1 depletion correlates with both the reduction of oligomeric tau and the reduction of pathological TIA1 positive tau inclusions. In the current report, we used a novel tau propagation approach to test whether TIA1 is required for producing toxic tau oligomers and whether TIA1 reduction would provide protection against the spread of these oligomers. The approach used young PS19 P301S tau mice at an age at which neurodegeneration would normally not yet occur and seeding oligomeric or fibrillar tau by injection into hippocampal CA1 region. We find that propagation of exogenous tau oligomers (but not fibrils) across the brain drives neurodegeneration in this model. We demonstrate that TIA1 reduction essentially brackets the pathophysiology of tau, being required for the production of tau oligomers, as well as regulating the response of neurons to propagated toxic tau oligomers. These results indicate that RNA binding proteins modulate the pathophysiology of tau at multiple levels and provide insights into possible therapeutic approaches to reduce the spread of neurodegeneration in tauopathy.

Keywords: Neurodegeneration; Neuropathology; RNA binding proteins; Stress granules; TIA1; Tau fibrils; Tau oligomers; Tau propagation; Tauopathy.


Conflict of interest statement

BW is co-founder and Chief Scientific Officer for Aquinnah Pharmaceuticals Inc.

Figures

Fig. 1
Fig. 1
Oligomeric tau fractions trigger neurotoxicity. a Diagram of experiment design using C57BL/6 primary hippocampal cultures, including plating, transduction, treatment and harvest in time course. b Representative images showed the co-localization (yellow) of CP13 (red) marked phosphorylated tau with V-5 (green) tagged tau at 24 h after S1p or P3 fraction treatment. Scale bar 20 µm. c quantitative analysis of tau aggregation induced by the S1P and P3 fractions. The number of tau inclusions was quantified by Image J. Data expressed as average number of tau inclusions per neuron. **p < 0.001 compared to their corresponding vehicle control in EGFP-AAV vector, WT tau and P301L tau over-expression groups. de The LDH assay showed dose-dependent toxicity in hippocampal neurons over-expressed human 4R0 N tau or P301L upon S1p treatment. Toxicity was not elicited by treatment with P3 fractions, ##p < 0.001 in the linear comparison of S1p and P3, **p < 0.001 compared to the corresponsive vehicle control. f The LDH assay of neurons treated with vehicle or S1p fractions ± immuno-depletion of tau, **p = 0.0011, *p = 0.0148 compared to vehicle control, ##p = 0.0014 compared to original S1p treated neurons. g Representative images showing the cell loss (NeuN) and shorter dendritic length (MAP-2) at 96 h after S1p treatment. Scale bar 100 µm. h Quantification of NeuN-positive cell number by image J. Cell number equals total count per 5 images each well. **p < 0.001 compared to corresponsive vehicle control. WT tau over-expression VS EGFP vector control, #p = 0.0024; P301L tau over-expression VS EGFP vector control, ##p = 0.0006. i Measurement of dendritic length at 96 h after S1p or P3 treatment. **p < 0.001 compared to corresponsive vehicle control. In S1p treated groups, cells of P301L tau over-expression VS EGFP vector control, #p = 0.0106. Data are represented as mean ± SEM. Independent experiments were repeated at least 4 times with triplicate wells each time
Fig. 2
Fig. 2
Propagated oligomeric and fibrillar tau species accumulate in separate neuronal compartments in vivo. a The design for the in vivo tau propagation experiments. The saline ctrl, S1p or P3 fractions were stereotaxically injected into the CA1 region of PS19 mice at 3 months of age. The mice were then aged three more months, and then killed at 6 months, whereupon the brains were harvested to assess tauopathy and neuronal loss. b IHC of DAB stained brain sections showing the position of injection site (inset coordinates: 1.80 mm posterior and 1.50 mm lateral to bregma; 1.50 mm ventral to cortical surface). The red boxes highlight the CA1 injection site, as well as the sites used for analysis, which include the neighboring CA3 site and the lateral entorhinal cortex (LEnt, bregma − 2.80 mm), a remote projection site. Shown are coronal sections at two z-coordinates (corresponding to neurons that were labelled for tauopathy and neurotoxicity). Scale bar 300 µm. c Images showing the S1p- and P3-induced hyperphosphorylated tau inclusions in CA3: MC1 (red) staining, neuronal marker, NeuN (violet), and DAPI (blue). Scale bar 50 µm. d Images showing the S1p- and P3-induced hyperphosphorylated tau inclusions in LEnt with detection of MC1 (red), NeuN (violet) and DAPI (blue). Scale bar 50 µm. e Quantification of the MC1 fluorescence intensity in the CA3. N = 4 (average of two brain slice from each mouse), saline vs S1p, **p < 0.001; saline vs P3, **p < 0.001. No difference observed between S1p and P3, p = 0.8467. f Quantification of the MC1 fluorescence intensity in the LEnt. N = 4 (average of two brain slice from each mouse), saline vs S1p, **p < 0.001; saline vs P3, **p < 0.001. No difference between S1p and P3, p = 0.9979. g Representative images of TOMA2 (labeling oligomeric tau) staining detect tau oligomers’ accumulation in CA3 and LEnt after S1p or P3 injection. h Representative images of thioflavin S staining in CA3 and LEnt detect tau fibrils accumulation after S1p or P3 injection. i Quantitative analysis of TOMA2 staining in CA3 and LEnt after S1p or P3 injection, respectively. **p < 0.001 compared to saline control. j Quantitative analysis of thioflavin S staining in CA3 and LEnt after S1p or P3 injection, respectively. **p < 0.001 compared to saline control. Data are represented as mean ± SEM
Fig. 3
Fig. 3
Oligomeric Tau co-localized with TIA1 positive granules in soma of neurons. ab Representative images of CA3 (a) and LEnt b for oligomeric tau marker TOMA2 (red) staining overlapped with TIA1 (green) and DAPI (blue) at 3 months after injection. Scale bar 20 µm. The nucleus TIA1 was masked by DAPI (light blue) and the cytosolic TIA1 co-localized with oligomer tau was masked by TOMA2 (yellow). The 5 × enlarged single cell images showed the localization of TIA1 in nucleus (light blue) or cytosol (green or yellow). And the co-localization intensity of TIA1 to TOMA2 was highlighted by scatterplot. cd Translocation of TIA1 from nucleus to cytosol in neurons of CA3 c and LEnt d was quantified by DAPI masked TIA1 in nucleus and TOMA2 masked TIA1 in cytosol. The number of colocalized voxels of TIA1 to DAPI or TIA1 to TOMA2 in each neuron of saline group was normalized into 100%, and comparison made between S1p- or P3-treated animals to Saline. In CA3, **p < 0.001 S1p compared to saline. In LEnt, *p = 0.019 and *p = 0.029 comparing S1p-treated animals to saline group of TIA1-DAPI co-localization and TIA1-TOMA2 co-localization, respectively. ef Quantification for the percentage of TIA1 that co-localized with TOMA2 to its total voxels, in CA3 neurons e and LEnt neurons f respectively. S1p compared to saline, *p = 0.027 in CA3, *p = 0.0132 in LEnt. Analysis of TIA1-DAPI or TIA1-TOMA2 co-localization was by Image J Fiji coloc 2 plugin. N = 15 (15 neurons from 3 sections of 3 mice). Data are represented as mean ± SEM
Fig. 4
Fig. 4
The propagated oligomeric tau fraction induces neuron loss. a Images show the immunohistochemistry DAB labeling of NeuN-positive neurons in CA3 and LEnt at 3 months after injection. Scale bar 50 µm. b Quantification of NeuN staining intensity of CA3 by Image J. N = 4 (average pixels of two sections from each mouse), **p = 0.0004. No difference observed between P3 and saline, p = 0.4566. c Cell count of NeuN-positive neurons in LEnt by Image J automatic count. N = 4 (average number of two sections from each mouse), **p = 0.0002. No difference observed between P3 and saline, p = 0.2145. d-–e Images represent the CP13 (red) marked phosphorylated tau co-localization (yellow) with RBP TIA1 (green), neuronal marker NeuN (violet) and DAPI (blue) of CA3 d and LEnt e after 3 months of injection, respectively. Scale bar 50 µm. fg Quantification of CP13 staining intensity in CA3 f and LEnt g. Data showed by the mean pixels per area of each quantified section, N = 4 (average of two sections from each animal). In CA3 f, **p = 0.005 S1p compared to saline and **p = 0.002 P3 compared to saline. In LEnt g, *p = 0.014 S1p compared to saline and *p = 0.033 P3 compared to saline. hi Quantification for the number of co-localized voxels in CP13-TIA1 overlap (as shown yellow in d, e). Data showed by the total number of co-localized voxels in each quantified brain section, N = 4 (average of two sections from each animal). In CA3 h, **p = 0.005 S1p compared to saline. In LEnt i, *p < 0.001 S1p compared to saline. Multiple comparison test by Tukey’s. Data are represented as mean ± SEM
Fig. 5
Fig. 5
TIA1 reduction prevents tau propagation from the oligomeric tau fraction. ab Representative images showing co-localization of TOMA2 (red) and TIA1 (green) in CA3 a and LEnt b of PS19 Tia1+/+ and PS19 Tia1+/− mouse brain, respectively, 3 months after injection in CA1of saline or S1p. With the co-staining, total cell nuclei are stained with DAPI (blue). Scale bar 50 µm. cd Quantitative analysis of TOMA2 staining intensity of CA3 and LEnt in PS19::Tia1+/+ and PS19::Tia1+/− mice, respectively. In PS19::Tia1+/+ mice, S1p VS saline, **p < 0.001; With S1p injection, PS19::Tia1+/− VS PS19::Tia1+/+, ##p < 0.001. ef Quantification of cells with TOMA2-TIA1 co-localization. The number of cells with co-localization in the saline group of Tia1 wild-type animals was normalized to 100 for CA3 e and LEnt f, respectively. For CA3 e, in PS19::Tia1+/+ mice, S1p compared to saline, **p < 0.0001; in PS19::Tia1+/− mice, S1p compared to saline, no difference observed, p = 0.6019. Genotype difference ##p < 0.0001. For LEnt f, in PS19::Tia1+/+ mice, S1p compared to saline, **p < 0.0001; in PS19::Tia1+/− mice, S1p compared to saline, no difference was observed, p = 0.6922. Genotype difference ##p < 0.0001. gh Representative images of tau-5 staining (red) showed that fibrillary tau in P3 fractions propagated into LEnt and elevated tau inclusions equally in P301S+/:: Tia1+/+ and PS19::Tia1+/− mice. **p < 0.001 compared to saline control within the corresponding genotype. Gene factor p = 0.9893 between P301S+/:: Tia1+/+ and PS19::Tia1+/− mice. Scale bar 50 µm. Data are represented as mean ± SEM, N = 4 (average of two sections from each animal)
Fig. 6
Fig. 6
TIA1 reduction prevents neurotoxicity induced by oligomeric tau propagation. a Representative NeuN-positive images showed the DAB immunohistochemical staining of CA3 at 3 months after injection of saline or S1p in PS19 TIA1 heterozygous mice compared to PS19 TIA1 wild type. Scale bar 50 µm. b Count of NeuN-positive cell number from DAB stained CA3 sections in a, **p < 0.001 compared to corresponsive saline control in PS19::Tia1+/+. In PS19::Tia1+/− mice, S1p compared to saline, p = 0.7053. Under S1p injection, compare PS19::Tia1+/− to PS19::Tia1+/+ mice, ##p < 0.001. c Representative NeuN-positive images showed the DAB immunohistochemical staining of LEnt at 3 months after injection of saline or S1p in PS19 TIA1 heterozygous mice compared to PS19 TIA1 wild type. The red ovals identify similar areas in each tissue section and highlight loss of neurons in the PS19 TIA1 wild-type mouse, with rescue in the PS19 TIA1 heterozygous mouse. Scale bar 50 µm. d Count of NeuN-positive cell number from DAB stained Lent sections in c, **p < 0.0001 compared to corresponsive saline control in PS19::Tia1+/+. In PS19::Tia1+/− mice, S1p compared to saline, p = 0.2422. Under S1p injection, compare PS19::Tia1+/− to PS19::Tia1+/+ mice, ##p = 0.0020. Data are represented as mean ± SEM. N = 4; average cell number of three sections from each mouse was used. Data analysis was by two-way ANOVA, post hoc multiple comparison test by Fisher’s LSD
Fig. 7
Fig. 7
Silencing of TIA1 expression protects against oligomeric Tau toxicity. a Representative images showing the co-localization of phosphorylated tau inclusions CP13 (red) with TIA1 granules (green) in hippocampal neurons over-expressing human P301L tau, at 1 h after S1p or vehicle treatment. Co-labeled markers are MAP-2 (violet) for neurons and DAPI (blue) for nuclear. Scale bar 20 µm. b To show the translocation of TIA1 from nuclear to cytosol and co-localization with tau inclusions in neuronal soma, high-magnification images were enlarged fivefold from the boxed neurons in a. c CP13 staining representative images show that TIA1 knock down disperses S1p induced bead-like tau granules in synapse and dendrites, creating a more continuous, less consolidated distribution of CP13 positive tau. CP13 staining of hippocampal cultures over-expressing human 4R0 N WT or P301L tau fixed at 24 h after treatment. d TIA1 knockdown prevents the elevation of CP13 phospho-tau from S1p or P3 treatment. Immunoblots of primary neuron lysates expressing either 4R0N WT or P301L tau, knocked down with either shCtrl or shTIA1 and treated for 24 h with S1p or P3 fractions. Phosphorylated tau detected by CP13 and MAP-2 internal control. e Quantification of CP13 immunoblot in cell lysate of hippocampal cultures over-expressing human 4R0 N WT tau, transduced with shTIA1 or shCtrl AAV on day- 4, treated with vehicle control, S1p or P3 on day 14 and harvested at 24 h after treatment. N = 3, in shCtrl, S1p compared to vehicle **p < 0.001, P3 to vehicle **p < 0.001. For S1p treatment, shTIA1 compared to shCtrl, ##p = 0.001. For P3 treatment, shTIA1 compared to shCtrl, ##p = 0.0016. f Quantification of CP13 immunoblot in cell lysate of hippocampal cultures over-expressing human P301L tau, transduced with shTIA1 or shCtrl AAV on day 4, treated with vehicle control, S1p or P3 on day 14 and harvested at 24 h after treatment. N = 3, in shctrl, S1p compared to vehicle **p = 0.007, P3 to vehicle **p = 0.006. For S1p treatment, shTIA1 compared to shCtrl, ##p = 0.006. For P3 treatment, shTIA1 compared to shCtrl, ##p = 0.006. Two-way ANOVA multiple comparison test by Fisher’s LSD. g NeuN-positive neurons in shctrl and shTIA1 cultures after saline or S1p treatment. **p < 0.0001 compared to corresponding control, ##p = 0.0055 compared to S1p group in shctrl cultures. h LDH assay with conditioned medium at 24 h after vehicle or S1p treatment in hippocampal neurons over-expressed with human WT or P301L Tau. The S1p fractions are from three genotypes of 9-month-old brains, including PS19 Tia1+/+, PS19 Tia1+/− and C57BL/6 wild-type mice. N = 4 separate times of experiment (triplicate wells each time). **p < 0.001 compared to corresponsive saline control. In WT tau over-expressed neurons, Tia1+/+ S1p compared to Tia1+/− S1p, #p = 0.0402. In P301L tau over-expressed neurons, Tia1+/+ S1p compared to Tia1+/− S1p, #p = 0.0394. Two-way ANOVA, post hoc multiple comparison test by Fisher’s LSD. Data are represented as mean ± SEM

References

    1. Ahmed Z, Cooper J, Murray TK, Garn K, Mcnaughton E, Clarke H, et al. A novel in vivo model of tau propagation with rapid and progressive neurofibrillary tangle pathology: the pattern of spread is determined by connectivity, not proximity. Acta Neuropathol. 2014;3:667–683. doi: 10.1007/s00401-014-1254-6. - DOI - PMC - PubMed
    1. Apicco DJ, Ash PEA, Maziuk B, LeBlang C, Medalla M, Al Abdullatif A. Reducing the RNA binding protein TIA1 protects against tau-mediated neurodegeneration in vivo. Nat Neurosci. 2018;21:72–80. doi: 10.1038/s41593-017-0022-z. - DOI - PMC - PubMed
    1. Asai H, Ikezu S, Tsunoda S, Medalla M, Luebke J, Haydar T. Depletion of microglia and inhibition of exosome synthesis halt tau propagation. Nat Neurosci. 2015;18:1584–1593. doi: 10.1038/nn.4132. - DOI - PMC - PubMed
    1. Ash PEA, Vanderweyde TE, Youmans KL, Apicco DJ, Wolozin B. Pathological stress granules in Alzheimer’s disease. Brain Res. 2014;1584:52–58. doi: 10.1016/j.brainres.2014.05.052. - DOI - PMC - PubMed
    1. Berger Z, Roder H, Hanna A, Carlson A, Rangachari V, Yue M. Accumulation of pathological tau species and memory loss in a conditional model of tauopathy. J Neurosci. 2007;27:3650–3662. doi: 10.1523/JNEUROSCI.0587-07.2007. - DOI - PMC - PubMed

Publication types

LinkOut - more resources