. 2019 Apr;5(4):e000220.
doi: 10.1099/mgen.0.000220. Epub 2018 Nov 22.

PANINI: Pangenome Neighbour Identification for Bacterial Populations

Affiliations

PANINI: Pangenome Neighbour Identification for Bacterial Populations

Khalil Abudahab et al. Microb Genom. 2019 Apr.

Abstract

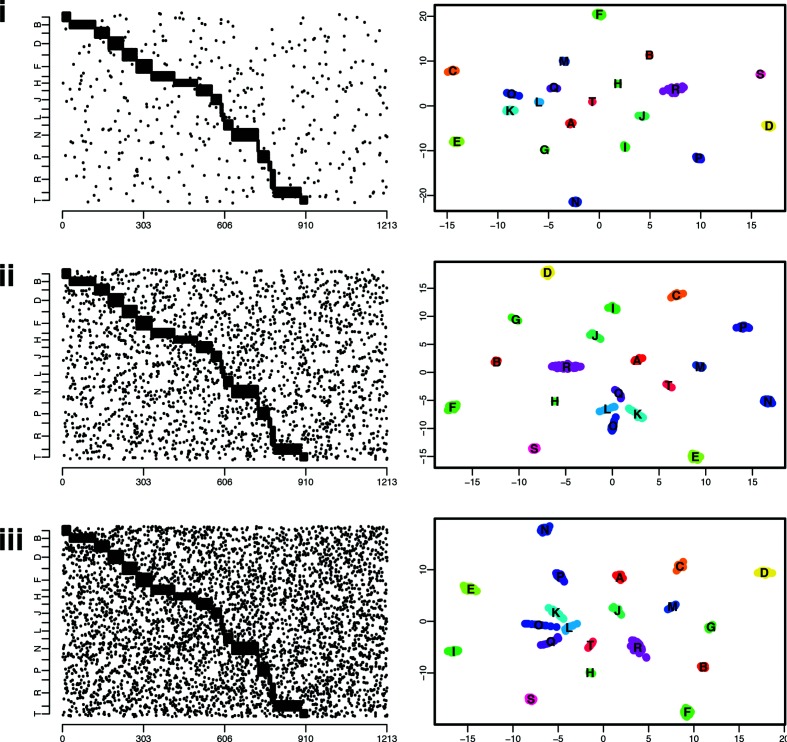
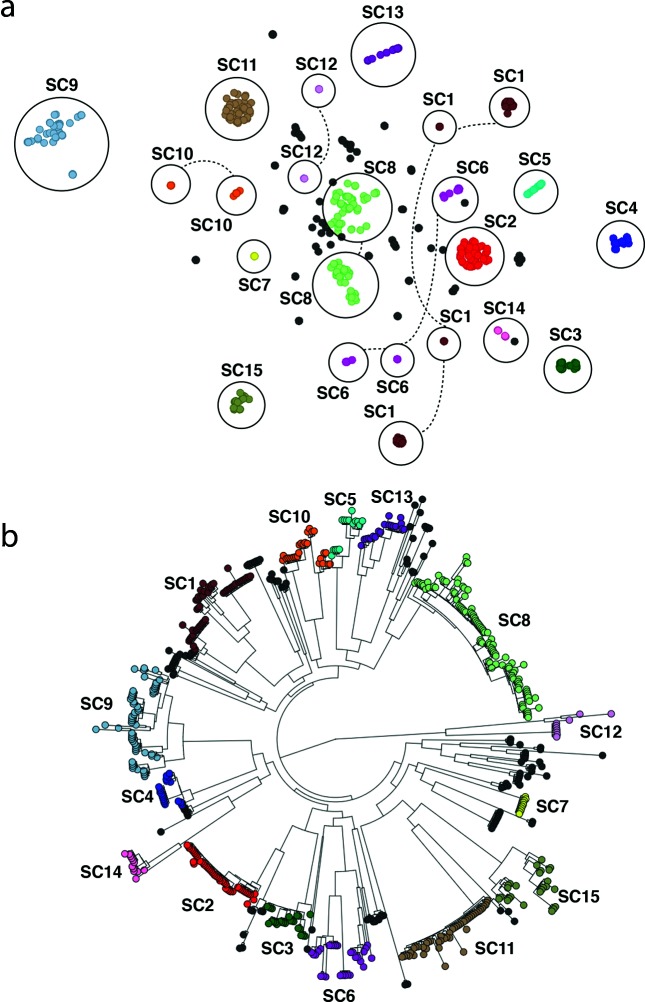
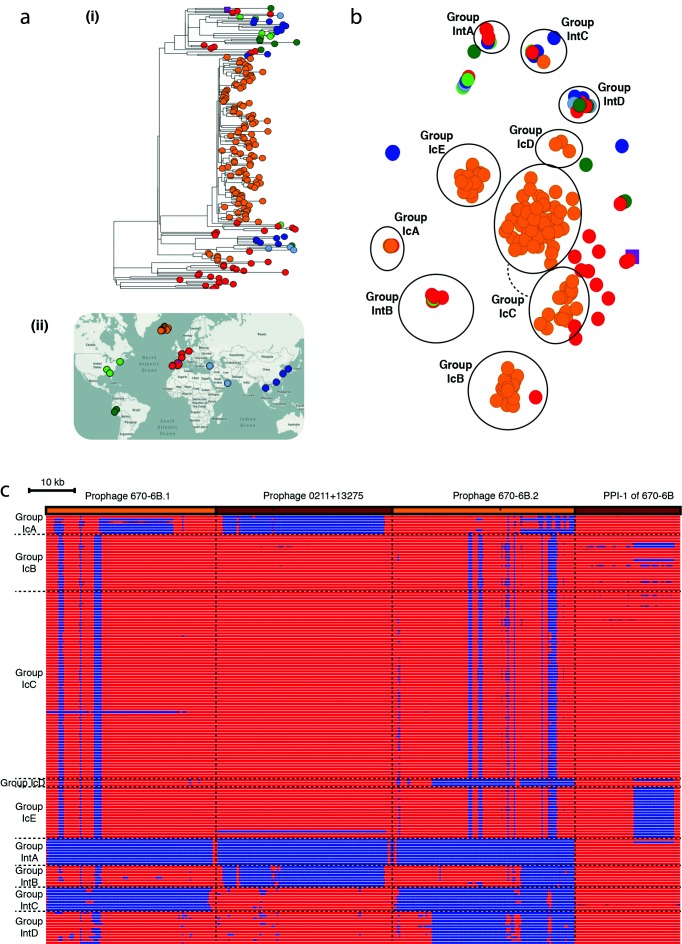
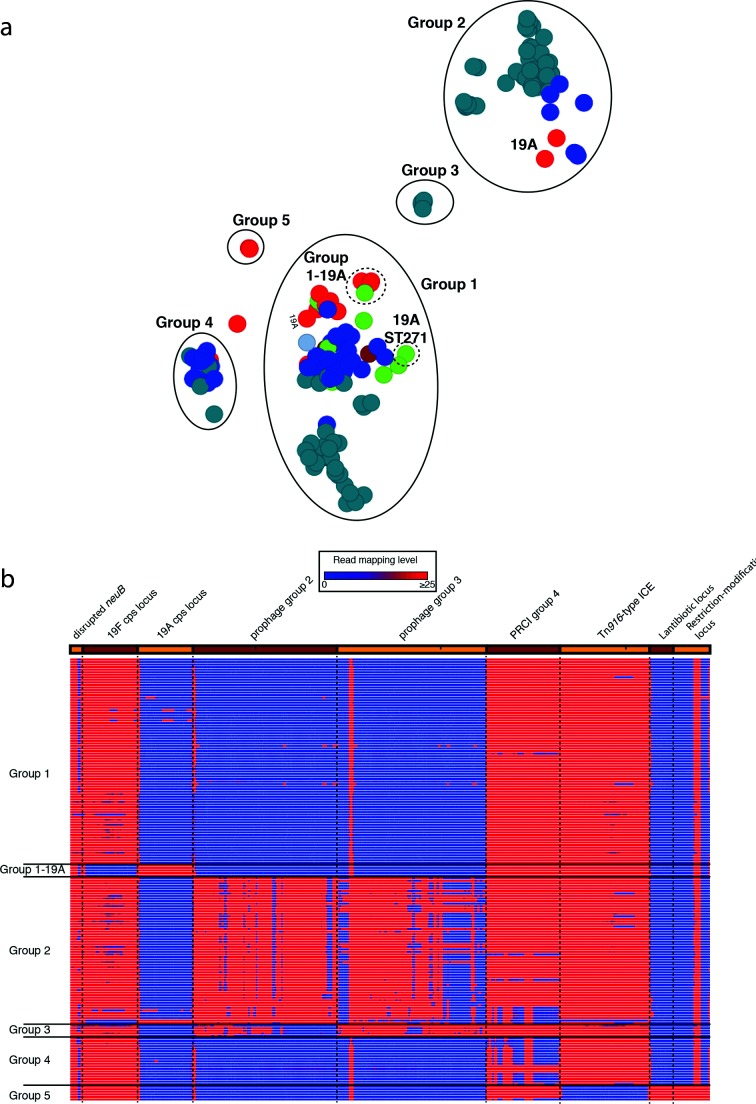
The standard workhorse for genomic analysis of the evolution of bacterial populations is phylogenetic modelling of mutations in the core genome. However, a notable amount of information about evolutionary and transmission processes in diverse populations can be lost unless the accessory genome is also taken into consideration. Here, we introduce panini (Pangenome Neighbour Identification for Bacterial Populations), a computationally scalable method for identifying the neighbours for each isolate in a data set using unsupervised machine learning with stochastic neighbour embedding based on the t-SNE (t-distributed stochastic neighbour embedding) algorithm. panini is browser-based and integrates with the Microreact platform for rapid online visualization and exploration of both core and accessory genome evolutionary signals, together with relevant epidemiological, geographical, temporal and other metadata. Several case studies with single- and multi-clone pneumococcal populations are presented to demonstrate the ability to identify biologically important signals from gene content data. panini is available at http://panini.pathogen.watch and code at http://gitlab.com/cgps/panini.

Keywords: machine learning; microbial population genomics; pangenome; web application.


Conflict of interest statement

The authors declare that there are no conflicts of interest.

Figures

Fig. 1.
Fig. 1.
Illustration of a simulated dataset, with the isolates’ gene content (left), black dots indicate the presence of a gene, the x-axis represents all the considered genes (a total of 1213 genes in this simulation). The right panels show the embedded locations in the 2D plane as estimated by the t-SNE algorithm, with each colour representing a cluster in the underlying simulation model. Clusters are named using the alphabet (A, B, C…). From top to bottom, plots indicate simulations generated with 0.1 % (i), 0.5 % (ii) and 1 % (iii) noise, respectively.
Fig. 2.
Fig. 2.
(a) Annotated output of the panini algorithm applied to 616 Streptococcus pneumoniae isolates from a diverse population in Massachusetts, USA. Each node represents an isolate, each of which is coloured according to its sequence cluster, as defined using the core genome. Clusters of isolates belonging to the same sequence cluster are circled and annotated. Where sequence clusters are divided into multiple groups in the panini network, the circles are joined by dashed lines. (b) Core-genome phylogeny based on comparison of conserved clusters of orthologous genes (COGs) adapted from [2] and displayed within Microreact. Sequence clusters are annotated for comparison with non-core clustering.
Fig. 3.
Fig. 3.
Analysis of the Streptococcus pneumoniae PMEN2 lineage. (a) (i) Core-genome phylogeny with tree leaves coloured by country of origin and (ii) geographical origin of isolates. (b) Annotated output of the panini algorithm applied to 189 isolates from an international collection of representatives of the Streptococcus pneumoniae PMEN2 lineage. Each point is coloured according to its region of origin. Groups defined by the structure of the panini output are circled and annotated. Clusters containing primarily Icelandic isolates (coloured orange) are labelled with ‘Ic’ prefixes, whereas those containing isolates from multiple countries are labelled with ‘Int’ prefixes. (c) Variation in accessory loci associated with differential classification of isolates into groups. The orange and brown bands across the top of the figure indicate the extent of the three prophage and pneumococcal pathogenicity island 1 (PPI-1) sequences, against which the short-read data from the isolates were mapped. The heatmap below includes one row per isolate, which were ordered according to their grouping in (a). The heatmap is coloured blue where mapping coverage was low, indicating a locus is absent, and red were mapping coverage was high, indicating a sequence was present. Horizontal dashed lines indicate the boundaries between the groups of isolates, vertical dashed lines indicate the boundaries between loci.
Fig. 4.
Fig. 4.
Analysis of the Streptococcus pneumoniae PMEN14 lineage. (a) Annotated output of the panini algorithm applied to 176 isolates from an international collection of representatives of the Streptococcus pneumoniae PMEN14 lineage. The main groups 1–5 are circled with solid lines and named; the subgroups within group 1 are circled by dashed lines. (b) Variation in accessory loci associated with differential classification of isolates into groups. This heatmap is displayed as in Fig. 3. In this case, the sequence loci across the top are more functionally diverse. The first is the neuB coding sequence with an ISSpn8 element inserted into it. The lack of mapping to the middle of this column indicates the absence of this insertion sequence anywhere in the chromosome. The next loci are alternative alleles of the capsule polysaccharide synthesis locus, one encoding for the biosynthesis of the PCV7 type 19F polysaccharide, the other for the non-PCV7 type 19A polysaccharide. These are followed by two similar prophage, one associated with group 2 isolates, the other with group 3 isolates; the similarity between these two viruses means there is extensive mapping to both, even when an isolate only contains one of them. The PRCI absent from the assemblies of group 4 isolates is next; mapping suggests this is actually present in some, but panini nevertheless included them in this group because the acquisition of a further, related PRCI prevented either assembling accurately. This is followed by the Tn916 conjugative element, absent from the group 5 isolates, which possess genomic islands encoding for the biosynthesis of a lantibiotic and a restriction-modification system, included at the right-hand end of the panel.
Fig. 5.
Fig. 5.
Analysis of the Salmonella enterica serovar Weltevreden as displayed within Microreact (https://microreact.org/project/panini-salmonella). (a) Core-genome tree of 115 Salmonella enterica serovar Weltevreden isolates, colour coded by the country of isolation. (b) Output of the panini algorithm with isolates colour coded similar to (a). (c) Timeline indicating date of sampling to aid interpretation and interactivity.

References

    1. Harris SR, Feil EJ, Holden MT, Quail MA, Nickerson EK, et al. Evolution of MRSA during hospital transmission and intercontinental spread. Science. 2010;327:469–474. doi: 10.1126/science.1182395. - DOI - PMC - PubMed
    1. Croucher NJ, Finkelstein JA, Pelton SI, Mitchell PK, Lee GM, et al. Population genomics of post-vaccine changes in pneumococcal epidemiology. Nat Genet. 2013;45:656–663. doi: 10.1038/ng.2625. - DOI - PMC - PubMed
    1. Chewapreecha C, Harris SR, Croucher NJ, Turner C, Marttinen P, et al. Dense genomic sampling identifies highways of pneumococcal recombination. Nat Genet. 2014;46:305–309. doi: 10.1038/ng.2895. - DOI - PMC - PubMed
    1. Aanensen DM, Feil EJ, Holden MT, Dordel J, Yeats CA, et al. Whole-genome sequencing for routine pathogen surveillance in public health: a population snapshot of invasive Staphylococcus aureus in Europe. MBio. 2016;7:e00444-16. doi: 10.1128/mBio.00444-16. - DOI - PMC - PubMed
    1. Argimón S, Abudahab K, Goater RJ, Fedosejev A, Bhai J, et al. Microreact: visualizing and sharing data for genomic epidemiology and phylogeography. Microb Genom. 2016;2:e000093. doi: 10.1099/mgen.0.000093. - DOI - PMC - PubMed

Publication types