

Unraveling the Control of Cell Cycle Periods during Intestinal Stem Cell Differentiation
- PMID: 30467024
- PMCID: PMC6289095
- DOI: 10.1016/j.bpj.2018.10.025
Unraveling the Control of Cell Cycle Periods during Intestinal Stem Cell Differentiation
Abstract
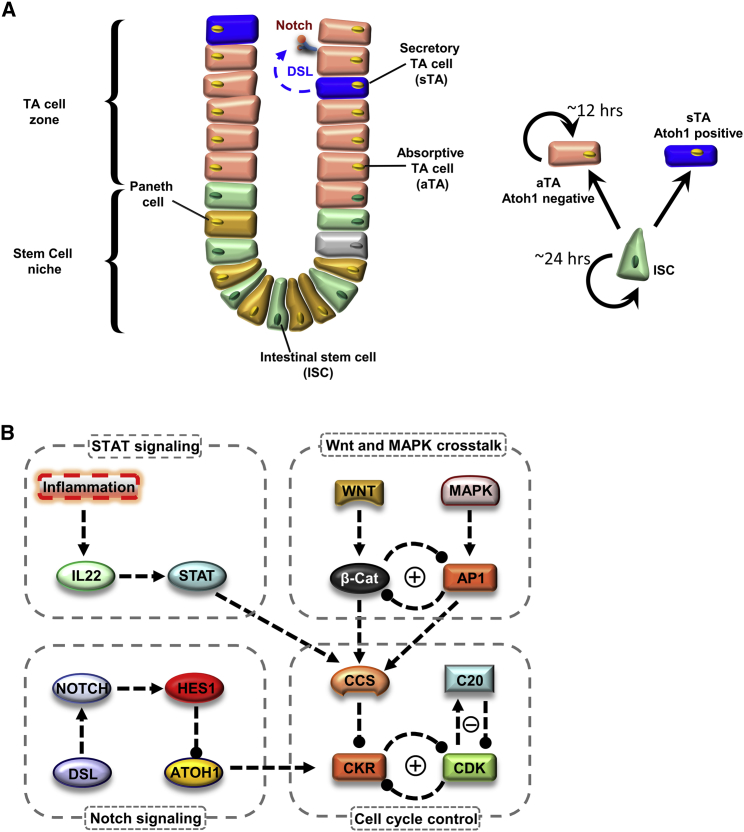
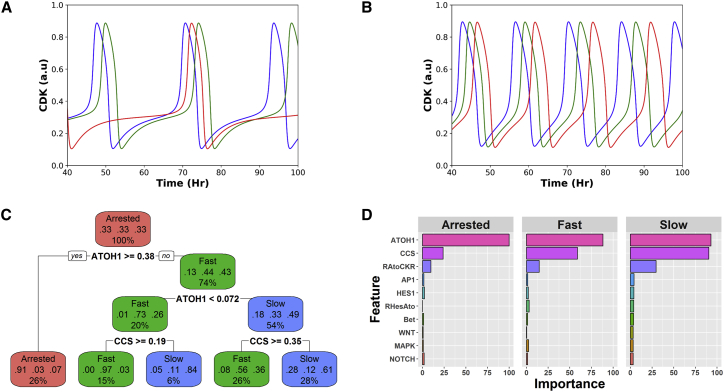
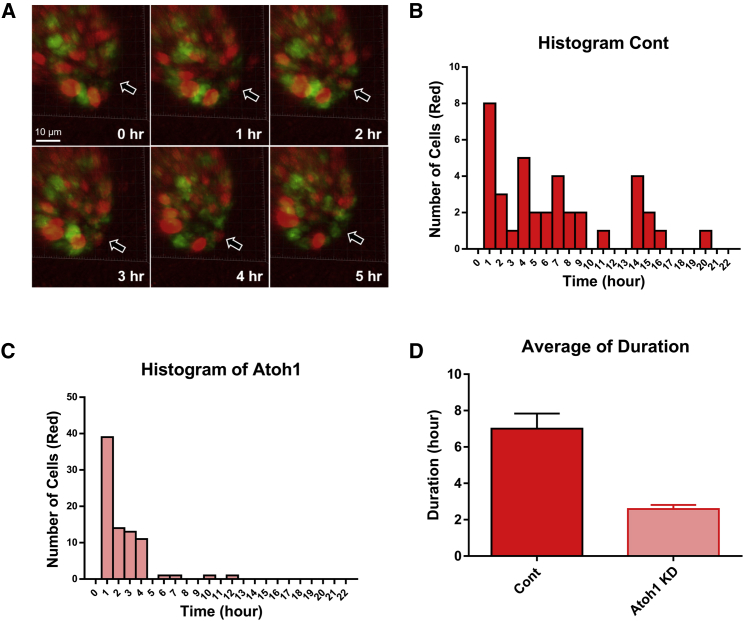
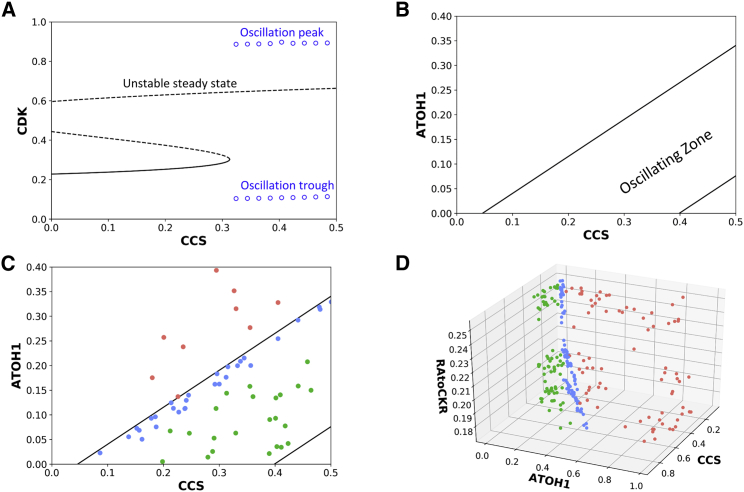
During differentiation, intestinal stem cells (ISCs), a prototypical adult stem cell pool, become either secretory transit-amplifying cells, which give rise to all secretory cell types, or absorptive transit-amplifying cells, which give rise to enterocytes. These cells exhibit distinct cell cycle dynamics: ISCs cycle with a period of 24 h and absorptive transit-amplifying cells cycle with a period of ∼12 h, whereas secretory transit-amplifying cells arrest their cycle. The cell cycle dynamics of ISCs and their progeny are a systems-level property that emerges from interactions between the cell cycle control machinery and multiple regulatory pathways. Although many mathematical models have been developed to study the details of the cell cycle and related regulatory pathways, few models have been constructed to unravel the dynamic consequences of their interactions. To fill this gap, we present a simplified model focusing on the interaction between four key regulatory pathways (STAT, Wnt, Notch, and MAPK) and cell cycle control. After experimentally validating a model prediction, which showed that the Notch pathway can fine-tune the cell cycle period, we perform further model analysis that reveals that the change of cell cycle period accompanying ISC differentiation may be controlled by a design principle that has been well studied in dynamical systems theory-a saddle node on invariant circle bifurcation. Given that the mechanisms that control the cell cycle are conserved in most eukaryotic cell types, this general principle potentially controls the interplay between proliferation and differentiation for a broad range of stem cells.
Copyright © 2018 Biophysical Society. Published by Elsevier Inc. All rights reserved.
Figures
Similar articles
-
JAK/STAT signaling coordinates stem cell proliferation and multilineage differentiation in the Drosophila intestinal stem cell lineage.Dev Biol. 2010 Feb 1;338(1):28-37. doi: 10.1016/j.ydbio.2009.10.045. Epub 2009 Nov 6. Dev Biol. 2010. PMID: 19896937
-
Division of Labor: Roles of Groucho and CtBP in Notch-Mediated Lateral Inhibition that Controls Intestinal Stem Cell Differentiation in Drosophila.Stem Cell Reports. 2019 May 14;12(5):1007-1023. doi: 10.1016/j.stemcr.2019.03.005. Epub 2019 Apr 11. Stem Cell Reports. 2019. PMID: 30982741 Free PMC article.
-
Overexpression of dJmj differentially affects intestinal stem cells and differentiated enterocytes.Cell Signal. 2018 Jan;42:194-210. doi: 10.1016/j.cellsig.2017.10.017. Epub 2017 Nov 2. Cell Signal. 2018. PMID: 29102770
-
Notch Signaling in Mammalian Intestinal Stem Cells: Determining Cell Fate and Maintaining Homeostasis.Curr Stem Cell Res Ther. 2019;14(7):583-590. doi: 10.2174/1574888X14666190429143734. Curr Stem Cell Res Ther. 2019. PMID: 31729290 Review.
-
Intestinal stem cell asymmetric division in the Drosophila posterior midgut.J Cell Physiol. 2010 Sep;224(3):581-4. doi: 10.1002/jcp.22194. J Cell Physiol. 2010. PMID: 20578235 Review.
Cited by
-
Amino acid transporter SLC7A5 regulates cell proliferation and secretary cell differentiation and distribution in the mouse intestine.Int J Biol Sci. 2024 Mar 25;20(6):2187-2201. doi: 10.7150/ijbs.94297. eCollection 2024. Int J Biol Sci. 2024. PMID: 38617535 Free PMC article.
-
Cell cycle expression heterogeneity predicts degree of differentiation.Brief Bioinform. 2024 Sep 23;25(6):bbae536. doi: 10.1093/bib/bbae536. Brief Bioinform. 2024. PMID: 39446193 Free PMC article.
-
Cell cycle expression heterogeneity predicts degree of differentiation.bioRxiv [Preprint]. 2024 Jul 22:2024.07.19.604184. doi: 10.1101/2024.07.19.604184. bioRxiv. 2024. Update in: Brief Bioinform. 2024 Sep 23;25(6):bbae536. doi: 10.1093/bib/bbae536. PMID: 39091773 Free PMC article. Updated. Preprint.
-
Understanding virtual patients efficiently and rigorously by combining machine learning with dynamical modelling.J Pharmacokinet Pharmacodyn. 2022 Feb;49(1):117-131. doi: 10.1007/s10928-021-09798-1. Epub 2022 Jan 5. J Pharmacokinet Pharmacodyn. 2022. PMID: 34985622 Free PMC article.
-
A Modeling and Machine Learning Pipeline to Rationally Design Treatments to Restore Neuroendocrine Disorders in Heterogeneous Individuals.Front Genet. 2021 Sep 9;12:656508. doi: 10.3389/fgene.2021.656508. eCollection 2021. Front Genet. 2021. PMID: 34567056 Free PMC article.
References
-
- Wagers A.J., Weissman I.L. Plasticity of adult stem cells. Cell. 2004;116:639–648. - PubMed
-
- Clevers H. The intestinal crypt, a prototype stem cell compartment. Cell. 2013;154:274–284. - PubMed
-
- Noah T.K., Shroyer N.F. Notch in the intestine: regulation of homeostasis and pathogenesis. Annu. Rev. Physiol. 2013;75:263–288. - PubMed
-
- Potten C.S. Cell cycles in cell hierarchies. Int. J. Radiat. Biol. Relat. Stud. Phys. Chem. Med. 1986;49:257–278. - PubMed
Publication types
MeSH terms
Substances
Grants and funding
LinkOut - more resources
Full Text Sources
Medical
Miscellaneous
