. 2018 Dec 4;115(11):2114-2126.
doi: 10.1016/j.bpj.2018.10.027. Epub 2018 Nov 6.

Targeting the Pentose Phosphate Pathway: Characterization of a New 6PGL Inhibitor

Affiliations

Targeting the Pentose Phosphate Pathway: Characterization of a New 6PGL Inhibitor

Anh Tuan Tran et al. Biophys J. .

Abstract

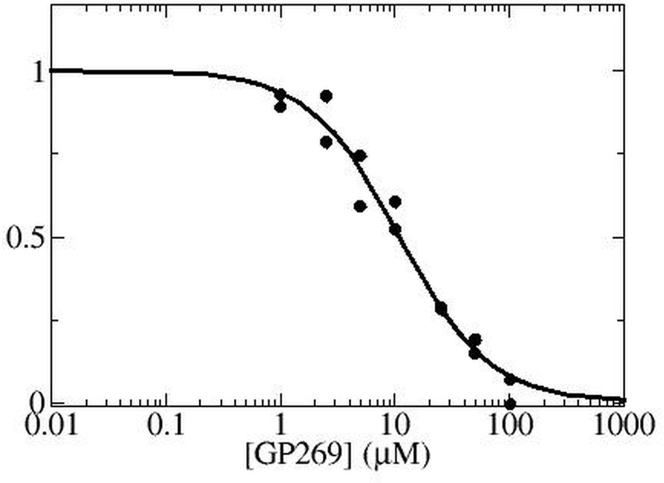
Human African trypanosomiasis, or sleeping sickness, is a lethal disease caused by the protozoan parasite Trypanosoma brucei. However, although many efforts have been made to understand the biochemistry of this parasite, drug development has led to treatments that are of limited efficiency and of great toxicity. To develop new drugs, new targets must be identified, and among the several metabolic processes of trypanosomes that have been proposed as drug targets, carbohydrate metabolism (glycolysis and the pentose phosphate pathway (PPP)) appears as a promising one. As far as the PPP is concerned, a limited number of studies are related to the glucose-6-phosphate dehydrogenase. In this work, we have focused on the activity of the second PPP enzyme (6-phospho-gluconolactonase (6PGL)) that transforms 6-phosphogluconolactone into 6-phosphogluconic acid. A lactam analog of the natural substrate has been synthesized, and binding of the ligand to 6PGL has been investigated by NMR titration. The ability of this ligand to inhibit 6PGL has also been demonstrated using ultraviolet experiments, and protein-inhibitor interactions have been investigated through docking calculations and molecular dynamics simulations. In addition, a marginal inhibition of the third enzyme of the PPP (6-phosphogluconate dehydrogenase) was also demonstrated. Our results thus open new prospects for targeting T. brucei.


Figures

Figure 1
Figure 1
Synthesis overview of GP269 (compound 10).
Figure 2
Figure 2
Monitoring of 6PGL enzymatic activity through UV absorption. (a) The first steep rise (t0 = 1 min) corresponds to UV absorption by NADPH produced by G6PDH upon G-6-P addition. The next UV absorption jump at τ0 = 3 min in the black and red curves corresponds to NADPH creation associated with 6PGA decarboxylation by 6PGDH. Data were obtained for 150 ng (black) and 15 ng (red) 6PGL. In the absence of 6PGL (blue curve), the slow slope corresponds to spontaneous lactone hydrolysis into 6PGA. Experimental conditions are given in Table S1; (b) 6PGL kinetics obtained for increasing concentrations of GP269 is shown: 0 μM (black), 1 μM (cyan), 2.5 μM (purple), 5 μM (black), 10 μM (red), 25 μM (dark green), 50 μM (blue), 100 μM (light green), and 250 μM (red). The linear part of the NADPH kinetics curve at t ≥ 5 min is associated with zero-order kinetics in δ-6-phosphogluconolactone. The different plateau values before the addition of 6PGL reflect experimental errors on G-6-P volumes added to the reactive medium at t = 0. This error, though irrelevant for our analysis, was estimated to be on the order of 7%. To see this figure in color, go online.
Figure 3
Figure 3
(a) Overlay of the [1H-15N]-HSQC spectra of a 90-μM sample of Tb6PGL obtained upon GP269 titration. The labeled resonance peaks on the full spectrum correspond to residues that disappear with 0.33 equivalent of GP269 (residues in intermediate exchange). In the inset, examples of residues in fast exchange (S162 and E222) are shown together with the G172 peak, which is unaffected by addition of the ligand; (b) residues with significant CSP shifts upon ligand addition (A11, T12, A41, A43, Y52, D75, S86, R92, H97, D98, L158, S162, T166, A167, F170, G188, M194, V198, A218, E222, K224, V227, L254, D256, and E261) are shown. Residues characterized by resonances disappearing during the titration (intermediate-to-slow exchange regime) are indicated above the graph. (c) The CSP measured during titration of the residues in fast-to-intermediate exchange and obtained with 0, 0.33, 1, 2, 5, and 10 Eq GP269 (open diamonds). Red filled circles indicate the average of CSP over all used residues for each GP269 concentration. The red line corresponds to the fit of these averaged values to Eq. 1, which yields the value Kd = 8.6 ± 1.3 μM. To see this figure in color, go online.
Figure 4
Figure 4
A schematic representation of the oxidative stage of the PPP. In the absence of 6PGL, δ-6-phosphogluconolactone undergoes spontaneous hydrolysis into 6PGA.
Figure 5
Figure 5
Inhibition experiments: the linear regions of the UV kinetics curves (5 min ≤ t ≤ 8 min) upon increasing concentrations of GP269, and depicted in Fig. 2, are least-squares fitted to straight lines. The relevant GP269 concentrations are indicated in the figure box. The titration has been performed in duplicate, and values are given in Table 1. To see this figure in color, go online.
Figure 6
Figure 6
Fit (solid line) of the experimental activities An(c) to Eq. 3, for 6PGL. The IC50 concentration corresponds to the inflection point of the curve.
Figure 7
Figure 7
Docking of GP269 into the 6PGL active site reveals two different poses, depending on the protocol used (see text for details). Only side chains of residues that belong to the active site are shown. In CONF1 (a), the phosphate group of GP269 is located in the region between His165 and Lys223. In CONF2 (b), the phosphate group of GP269 remains close to Arg77, His165 and Arg200. To see this figure in color, go online.
Figure 8
Figure 8
Distances between the GP269 phosphate group and active site residues in conf1 (a) and in conf2 (b). Dashed lines indicate the boundaries of different ion-pair interactions. The N-O distances refer to the actual distances between the side-chain N and the closest oxygen atom of the phosphate group. The distances between centroids were calculated according to the definition discussed in Materials and Methods. The number of occurrences is represented in logarithmic scale according to the color code indicated on the rightmost part of the figure. To see this figure in color, go online.
Figure 9
Figure 9
Conformational changes of GP269 in MD trajectories for 6PGL/GP269 in conf2. The time evolution of distances between GP269 and 6PGL active site is shown: the upper panel shows the distance of oxygen O2 from side chains of Lys223 (green) and Gly44 (orange) together with the distance of oxygen O4 from Asp75 side chain (red); the lower panel shows the distances between the GP269 phosphorus atom to both Arg77 (black) and Arg200 (blue). Representative structures are shown to illustrate the different orientations of GP269 in the protein active site. For the sake of clarity, Arg77 is not shown in these structures. To see this figure in color, go online.
Figure 10
Figure 10
Mapping of the exchanging residues identified by GP269 titration onto the 3D structure of the 6PGL/GP269 complex (conf1 pose). Residues in fast and intermediate NMR exchange are indicated in yellow and green, respectively. To see this figure in color, go online.

References

    1. Barrett M.P., Burchmore R.J., Krishna S. The trypanosomiases. Lancet. 2003;362:1469–1480. - PubMed
    1. Funayama S., Funayama S., Veiga L.A. Trypanosoma cruzi: kinetic properties of glucose-6-phosphate dehydrogenase. Exp. Parasitol. 1977;43:376–381. - PubMed
    1. Büscher P., Cecchi G., Priotto G. Human African trypanosomiasis. Lancet. 2017;390:2397–2409. - PubMed
    1. Opperdoes F.R. Compartmentation of carbohydrate metabolism in trypanosomes. Annu. Rev. Microbiol. 1987;41:127–151. - PubMed
    1. Kovářová J., Barrett M.P. The pentose phosphate pathway in parasitic trypanosomatids. Trends Parasitol. 2016;32:622–634. - PubMed

Publication types

MeSH terms