PARP-1 regulates DNA repair factor availability
- PMID: 30467127
- PMCID: PMC6284389
- DOI: 10.15252/emmm.201708816
PARP-1 regulates DNA repair factor availability
Abstract
PARP-1 holds major functions on chromatin, DNA damage repair and transcriptional regulation, both of which are relevant in the context of cancer. Here, unbiased transcriptional profiling revealed the downstream transcriptional profile of PARP-1 enzymatic activity. Further investigation of the PARP-1-regulated transcriptome and secondary strategies for assessing PARP-1 activity in patient tissues revealed that PARP-1 activity was unexpectedly enriched as a function of disease progression and was associated with poor outcome independent of DNA double-strand breaks, suggesting that enhanced PARP-1 activity may promote aggressive phenotypes. Mechanistic investigation revealed that active PARP-1 served to enhance E2F1 transcription factor activity, and specifically promoted E2F1-mediated induction of DNA repair factors involved in homologous recombination (HR). Conversely, PARP-1 inhibition reduced HR factor availability and thus acted to induce or enhance "BRCA-ness". These observations bring new understanding of PARP-1 function in cancer and have significant ramifications on predicting PARP-1 inhibitor function in the clinical setting.
Keywords: DNA repair; E2F1; PARP; transcription.
© 2018 The Authors. Published under the terms of the CC BY 4.0 license.
Figures
- A
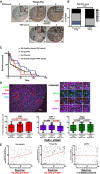
Tissue microarrays (TMAs) from primary PCa (n = 132) and CRPC (n = 148) were stained via immunohistochemistry for poly(ADP‐ribose; PAR), and scored by a clinical pathologist (T. Parsons) for intensity (0–3) and percentage (0–3).
- B
PAR score was generated via the equation: (intensity × 1) + (percentage × 2). PAR scores were compared between primary and CRPC. ****P value < 0.0001 by Chi‐square test.
- C
Manual PAR scores were divided in to quartiles and then were compared to progression‐free survival in the CRPC TMAs. *P < 0.05, ns = not statistically significant by Log‐rank (Mantel‐Cox). 1st quartile vs. 2nd quartile, P = 0.1482; 1st quartile vs. 3rd quartile, P = 0.5794; 1st quartile vs. 4th quartile, P = 0.0160; 2nd quartile vs. 3rd quartile, P = 0.3869; 2nd quartile vs. 4th quartile, P = 0.2110; 3rd vs. 4th quartile, P = 0.0201. 1st quartile (n = 24); 2nd quartile (n = 22); 3rd quartile (n = 27); 4th quartile (n = 26).
- D
Top left: Representative image of one TMA core after multiplex fluorescent IHC for γH2AX (green), PAR (red), PARP‐1 (purple), with DNA (blue). Top right: Insets of parent image on the left. Numbers above inset columns coincide with numbers on image at left that were chosen for further magnification and representation (boxed areas). Bottom left: Percent positive staining for PAR for the entirety of each TMA cohort. Bottom middle: Percent positive staining for PARP‐1. Bottom right: γH2AX for the entirety of each TMA cohort. Data were considered after a median intensity cutoff and analyzed for statistical significance using two‐tailed Student's t‐test for PAR, PARP‐1, and γH2AX, respectively. Exact P values are indicated. Horizontal lines are median. Box limits are 25% and 75% percentiles, and whiskers are min to max.
- E
Two‐tailed Spearman correlation test between PAR and γH2AX (% positive with a median intensity cutoff). Exact P values are indicated when available.

- A
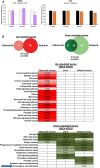
Left: Schematic representing the conditions utilized for transcriptomic analyses (n = 2) of HT‐sensitive LNCaP cells. Cells were deprived of hormones for 72 h, followed by either treatment with 2.5 μM veliparib (PARPi) or vehicle control (DMSO) for 1 h, then subsequently treated with either 1 nM DHT or vehicle control (EtOH) for 16 h. Middle: Immunoblot with the indicated antisera. Right: Volcano plots of transcripts found to be differentially regulated by DHT vs. EtOH (left) or DHT vs. PARPi followed by DHT (right). Red dots indicate transcripts that were both statistically significantly altered (P < 0.05) and more than 1.5‐fold changed.
- B
Left: Schematic representing the conditions utilized for transcriptomic analyses (n = 2) of CRPC C4‐2 cells. Cells were deprived of hormones for 72 h, followed by either treatment with 2.5 μM veliparib (PARPi) or vehicle control (DMSO) for 16 h. Middle: Immunoblot with the indicated antisera. Right: Volcano plots of transcripts found to be differentially regulated PARPi vs. vehicle control. Red dots indicate transcripts that were both statistically significantly altered (P < 0.05) and more than 1.5‐fold changed.
- C
Genes found to be down‐regulated by PARPi as described above (P value < 0.05, 1.5‐fold change) in either HT‐sensitive cells (left) or CRPC cells (right) were queried against the expression of these genes in the Grasso et al data set in Oncomine. Benign = gray, primary PCa = blue, metastases = orange. Boxplot was generated using the mean expression of the PARPi down‐regulated genes in the indicated data sets. Statistical significance determined by two‐tailed Student's t‐test. Box plots are median and upper and lower quartiles. Whiskers are min and max. For the Grasso et al data set, n = 28 benign prostate tissues, n = 59 localized prostate cancer, and n = 35 metastatic castration resistant.

- A
Left: Data generated as described above in Fig 2 were utilized for Gene Set Enrichment Analysis (GSEA) Molecular Signature DataBases (MSigDB) KEGG analyses. Cutoff for reporting was a false discovery rate q value of < 0.25, and normalized enrichment scores (NES) are shown, with darker colors indicating more enrichment. Middle: Data generated as described above in Fig 2 were utilized for Gene Set Enrichment Analysis (GSEA) Molecular Signature DataBases (MSigDB) KEGG analyses. Cutoff for reporting was a false discovery rate q value of < 0.25, and normalized enrichment scores (NES) are shown, with darker colors indicating more enrichment. Open circles indicate cell cycle‐related hallmarks, and closed circles indicate DNA damage repair‐related hallmarks. Right: Selected GSEA MSigDB Hallmarks pathways are shown with NES and false discovery rate (FDR).
- B
Indicated cell lines were treated as depicted in Fig 2. Data are depicted as mean ± standard deviation of three independent biological experiments. Statistical significance was determine by two‐tailed Student's t‐test where *P < 0.05, **P < 0.01, ***P < 0.001, ****P < 0.0001. LNCaP: E2F1, P = 0.0159; PCNA, P = 0.0217; MCM7, P = 4.0936e‐6; CCNA2, P = 0.0005. C4‐2: E2F1, P = 0.0074; PCNA, P = 0.1258; MCM7, P = 3.7471e‐5; CCNA2, P = 0.0031.
- C
ChIP‐qPCR after C4‐2 cells were treated as depicted in Fig 2. Data are depicted as mean ± standard deviation of three independent biological experiments. Statistical significance was determined by two‐tailed Student's t‐test where *P < 0.05, ****P < 0.0001. E2F1 ChIP, P = 0.4610; PARP‐1 ChIP, P = 0.1773; Pol II ChIP, P = 0.0305; AcH4 ChIP, P = 7.4261e‐5.
- D
Athymic nude mice were injected with C4‐2 cell mixed with matrigel. Once tumors became 100 mm3, mice were treated with either vehicle control or veliparib. Seventy‐two hours later, tumors were harvested, RNA was isolated and used for qPCR quantification of the indicated transcripts. Data are depicted as log2 absolute gene regulation of veliparib samples compared to control samples, ± standard deviation of three independent xenograft tumors.
- E
Prostatectomy tissue (n = 6) was cultured as previously described, and treated with either vehicle control or veliparib for 6 days. RNA was then harvested from the tissues and used for qPCR quantification of the indicated transcripts. Data are depicted as log2 absolute gene regulation of veliparib samples compared to control samples. Each individual tissue is depicted by a separate bar color. Statistical analyses were performed by Wilcoxon signed rank test.
- A
Indicated cell lines were treated as depicted in Fig 2, and labeled with bromodeoxyuridine (BrdU), harvested at indicated time points and utilized for FACS analyses. Data are depicted as mean ± standard deviation of three independent biological experiments. *P < 0.05 as determined by two‐tailed Student's t‐test. LNCaP: 3 h, P = 0.9838; 16 h, P = 0.2197, 24 h, P = 0.0207. C4‐2: 3 h, P = 0.4520; 16 h, P = 0.9446; 24 h, P = 0.4025; 48 h, P = 0.3431.
- B
Top: Data generated as described above in Fig 2 were compared to a separate microarray analysis in which the same cell line was exposed to 1 μM palbociclib instead of veliparib. Cutoffs for comparison were a P value < 0.05, and fold change of 1.5. Venn diagrams shows the overlapping and non‐overlapping genes of both down‐ (top) and up‐regulated (bottom) genes in response to either treatment modality. Statistical significance was determined using the Chi‐squared statistical test. Bottom: Genes found to be exclusively regulated by palbociclib, commonly regulated by palbociclib and veliparib, or exclusively regulated by veliparib were used for Gene Set Enrichment (GSEA) KEGG pathway analyses. Data indicate both FDR q value, where the darker colors indicate higher confidence (lower q). Numbers indicate q values. Blue arrow highlights the Homologous Recombination KEGG pathway.
- A
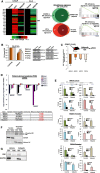
Left: Data generated as described above in Fig 2 were used to generate a heatmap of homologous recombination (HR) gene expression after the indicated treatment regimens. Middle: Selected GSEA MSigDB Oncogenic Signature pathways are shown. Right: Data generated as described above in Fig 2 were compared to a previously described HR deficiency transcriptional profile (Peng et al, 2014, Nature Communications). This profile was derived by independently silencing either BRCA1, RAD51, or BRIP1, followed by transcriptional analyses. The union of these three data sets was used to generate the signature. Cutoffs for comparison were a P value < 0.05, and fold change of 1.5. Venn diagrams shows the overlapping and non‐overlapping genes of both down‐ (top) and up‐regulated (bottom) genes in the previously defined HR deficiency signature, and the PARPi‐responsive transcriptome.
- B
Left: C4‐2 cells were treated as depicted in Fig 2. Data are depicted as mean ± standard deviation of three independent biological experiments. Statistical significance was determined by two‐tailed Student's t‐test where *P < 0.05, **P < 0.01. BRCA2, P = 0.0046; RAD51, P = 0.0151; XRCC3, P = 0.0341; TOP3A, P = 0.04988. Right: C4‐2 cells were treated as depicted in Fig 2 and immunoblotted with the indicated antisera. Quantifications shown below each band.
- C
Athymic nude mice were injected with C4‐2 cell mixed with matrigel. Once tumors became 100 mm3, mice were treated with either vehicle control or veliparib. Seventy‐two hours later, tumors were harvested, RNA was isolated and used for qPCR quantification of the indicated transcripts. Data are depicted as log2 absolute gene regulation of veliparib samples compared to control samples, ± standard deviation of three independent xenograft tumors.
- D
Prostatectomy tissue (n = 6) was cultured as previously described, and treated with either vehicle control or veliparib for 6 days. RNA was then harvested from the tissues and used for qPCR quantification of the indicated transcripts. Data are depicted as log2 absolute gene regulation of veliparib samples compared to control samples. Each individual tissue is depicted by a separate bar color. Statistical analyses were performed by Wilcoxon signed rank test.
- E
C4‐2 cells were treated as depicted in Fig 2. ChIP was performed using the indicated antisera, and the subsequent DNA was isolated and used in qPCR product using primers designed to amplify the indicated genomic loci: BRCA2 enhancer, RAD51 promoter, or TOP3A promoter. Data are depicted as mean ± standard deviation of three independent biological experiments. Statistical significance was determined by two‐tailed Student's t‐test where *P < 0.05, **P < 0.01. BRCA2 locus: E2F1 ChIP, P = 0.0308; PARP‐1 ChIP, P = 0.0488; Pol II ChIP, P = 0.0471; AcH4 ChIP, P = 0.0081. RAD51 Promoter E2F1 ChIP, P = 0.7739; PARP‐1 ChIP, P = 0.0366; Pol II ChIP, P = 0.0767; AcH4 ChIP, P = 0.1378. TOP3A promoter: E2F1 ChIP, P = 0.0074; PARP‐1 ChIP, P = 0.0500; Pol II ChIP, P = 0.0199; AcH4 ChIP, P = 0.0158.
- F, G
C4‐2 cells treated with 2.5 μM veliparib (Vel.) or vehicle control (Veh.) for 24 h. Cells were then harvested, lysed, and differentially centrifuged as described in the Material and Methods section, resulting in a soluble fraction (Sol.; GAPDH serves as control) or a chromatin‐tethered fraction (Teth.; histone H4 serves as control). Immunoblots were performed for the indicated proteins.
- A
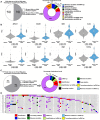
The CBioportal was used to query the DNA and RNA HR gene alterations found in the TCGA primary PCa data set. HR genes queried were BRCA1, BRCA2, RAD51, MRE11A, RAD50, NBN, RBBP8, EXO1, RPA1, RPA2, RPA3, XRCC3, BLM, RMI1, RMI2, TOP3A, GEN1, SLX4. Default settings were used.
- B
Expression levels of indicated HR pathway genes in primary PCa vs. normal patient samples. Violin plots represent FPKM normalized counts obtained from matched tumor and normal RNA‐Seq data from TCGA (n = 52) with P values generated using paired t‐tests. Notch is the median, length of notch is 95% confidence interval, and whiskers are 1.5 times the interquartile range from the hinge.
- C
The CBioportal was used to query the DNA and RNA HR gene alterations as above using the PCF‐SU2C advanced PCa data set.
- D
The CBioportal was used to query the DNA and RNA HR gene alterations as above using the PCF‐SU2C advanced PCa data set, and the data are presented on a per patient basis.
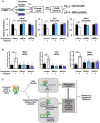
- A, B
(A) Indicated cell lines were transfected with indicated constructs and treated with veliparib. Cell growth and (B) DDR via γH2AX was assessed. Data represent median ± standard deviation of independent biological replicates. Control transfected and vehicle control treated cells are set to 1. *P value < 0.05, **P value < 0.01, ***P < 0.001. Statistical significance was determined by two‐tailed Student's t‐test. LNCaP cell growth: Control transfection, P = 0.0220; BRCA1 transfection, P = 0.67787; BRCA2 transfection, P = 0.4676. C4‐2 cell growth: Control transfection, P = 0.0354; BRCA1 transfection, P = 0.1638; BRCA2 transfection, P = 0.2519. 22Rv1 cell growth: Control transfection, P = 0.0039; BRCA1 transfection, P = 0.1085; BRCA2 transfection, P = 0.2781. LNCaP γH2AX: Control transfection, P = 0.0008; BRCA1 transfection, P = 0.9035; BRCA2 transfection, P = 0.4685. C4‐2 γH2AX: Control transfection, P = 0.0009; BRCA1 transfection, P = 0.6362; BRCA2 transfection, P = 0.4217. 22Rv1 γH2AX: Control transfection, P < 0.0001; BRCA1 transfection, P = 0.4698; BRCA2 transfection, P = 0.4937.
- C
Graphical abstract of data presented herein. TF = transcription factor.
References
-
- Alla V, Engelmann D, Niemetz A, Pahnke J, Schmidt A, Kunz M, Emmrich S, Steder M, Koczan D, Putzer BM (2010) E2F1 in melanoma progression and metastasis. J Natl Cancer Inst 102: 127–133 - PubMed
-
- Audeh MW, Carmichael J, Penson RT, Friedlander M, Powell B, Bell‐McGuinn KM, Scott C, Weitzel JN, Oaknin A, Loman N et al (2010) Oral poly(ADP‐ribose) polymerase inhibitor olaparib in patients with BRCA1 or BRCA2 mutations and recurrent ovarian cancer: a proof‐of‐concept trial. Lancet 376: 245–251 - PubMed
-
- Barber LJ, Sandhu S, Chen L, Campbell J, Kozarewa I, Fenwick K, Assiotis I, Rodrigues DN, Reis Filho JS, Moreno V et al (2013) Secondary mutations in BRCA2 associated with clinical resistance to a PARP inhibitor. J Pathol 229: 422–429 - PubMed
Publication types
MeSH terms
Substances
Grants and funding
LinkOut - more resources
Full Text Sources
Other Literature Sources
Medical
Molecular Biology Databases
Miscellaneous

