. 2018 Nov 23;362(6417):eaar2971.
doi: 10.1126/science.aar2971.

Myofibroblast proliferation and heterogeneity are supported by macrophages during skin repair

Affiliations

Myofibroblast proliferation and heterogeneity are supported by macrophages during skin repair

Brett A Shook et al. Science. .

Abstract

During tissue repair, myofibroblasts produce extracellular matrix (ECM) molecules for tissue resilience and strength. Altered ECM deposition can lead to tissue dysfunction and disease. Identification of distinct myofibroblast subsets is necessary to develop treatments for these disorders. We analyzed profibrotic cells during mouse skin wound healing, fibrosis, and aging and identified distinct subpopulations of myofibroblasts, including adipocyte precursors (APs). Multiple mouse models and transplantation assays demonstrate that proliferation of APs but not other myofibroblasts is activated by CD301b-expressing macrophages through insulin-like growth factor 1 and platelet-derived growth factor C. With age, wound bed APs and differential gene expression between myofibroblast subsets are reduced. Our findings identify multiple fibrotic cell populations and suggest that the environment dictates functional myofibroblast heterogeneity, which is driven by fibroblast-immune interactions after wounding.


Figures

Fig. 1.
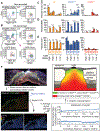
Fig. 1.. Dermal mesenchymal cell heterogeneity changes after injury.
(A) Identified molecular markers of wound bed myofibroblasts using genetic lineage tracing. (B) FACS analysis and quantification of CD34 and CD29 subsets of Sca1+;CD26High lineage traced cells in non-wounded skin (n = 4). (C) FACS plots and quantification of cellular subsets in non-wounded (n = 8), 5-day (n = 19), 7-day (n = 4) and 14-day wound beds (n = 7). (D and E) Real-time qPCR analysis of SMA (Acta2) and Collagen I (Col I) in mesenchymal subsets isolated from non-wounded skin (D) or 5-day wound beds (E). (F) Representative flow cytometry histograms and quantification of SMA, CD90 and Collagen I in mesenchymal subsets (n = 3). Error bars indicate mean ± SEM. *p < 0.05, **p < 0.01, ***p < 0.001, ****p < 0.0001. NW, non-wounded; WB, wound bed; pc, panniculus carnosus; dwat, dermal white adipose tissue.
Fig. 2.
Fig. 2.. Skin wounds contain multiple myofibroblast subsets.
(A and B) FACS plots detailing the gating strategy to define mesenchymal subpopulations. (C to E) Quantification of the relative abundance of prevalent pro-fibrotic subsets (n = 6) (C) and colocalization with SMA (D) and Collagen I (E) in non-wounded and 5-day wound bed mesenchymal subsets (n = 3). (F) Pipeline for processing immunostained tissue sections to infer the location of APs (CD29+;CD26High) and CD29High cells in day 5 wound beds. Yellow lines delineate wound edges. Scale bar, 250μm. Error bars indicate mean ± SEM. *p < 0.05, **p < 0.01, ***p < 0.001, ****p < 0.0001. NW, non-wounded; WB, wound bed; pc, panniculus carnosus; dwat, dermal white adipose tissue; AU, arbitrary units; LUT, look up table.
Fig. 3.
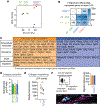
Fig. 3.. Myofibroblast subsets can distinctively regulate repair.
(A) Transcriptomic PCA of myofibroblast subsets. (B) Table of statistically significant, differentially expressed genes between cellular subsets. (C) Wound healing-related genes enriched in APs (CD9 and CD9+ AP populations) or CD29High cells. (D and E) Quantification of hydroxyproline content (n = 7) (D) and lysyl oxidase (LOX) activity in cells from day 5 wounds (n = 4; p = 0.0416) (E). (F) Migration distance of APs (CD26High) (asterisks) and CD29High cells (arrow heads) from cultured wound beds (n ≥ 250 cells from 3 wound beds). Scale bar, 10μm. Error bars indicate mean ± SEM.
Fig. 4.
Fig. 4.. Myofibroblast composition and gene expression is altered during aging.
(A) FACS plots from 5-day wounds from young and aged mice. (B) Quantification of the relative abundance of prevalent pro-fibrotic subsets in 5-day wounds (n = 4). (C) Pie charts depicting CD9 and CD26 colocalization. (D) Pipeline for processing immunostained wound bed sections to infer APs and CD29High cell location in day 5 wound beds from aged mice. Yellow lines delineate wound edges. Scale bar, 250μm. (E) Genes with altered differential expression with age. Black and red text indicates enrichment in young and aged mice, respectively. Error bars indicate mean ± SEM. pc, panniculus carnosus; dwat, dermal white adipose tissue; AU, arbitrary units; LUT, look up table. **p < 0.01, ***p < 0.001, ****p < 0.0001.
Fig. 5.
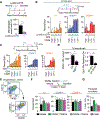
Fig. 5.. CD301b+ macrophages selectively stimulate AP proliferation during wound healing.
(A) Quantification of wound bed macrophages depletion (n ≥ 3; p = 0.004). (B) Quantification of myofibroblast proliferation in wound beds (n = 4). (C) Quantification of cell proliferation in wound beds of CD301b+ macrophage-depleted mice (Mgl2DTR) (n = 3). (D) Quantification of EdU-incorporating APs in mice receiving DT on day 2, 4 and after injury (left) (n = 3, p = 0.0469) and DT 2 and 3 or 3, 4 and 6 days after injury (right) (n = 3, p = 0.0116). Mice were given 2 injections of EdU per day from day 3 thru 7 after injury. (E) FACS plots of immune cell populations isolated for transplants. (F and G) Quantification of EdU-incorporating cells after injection of select immune cell subsets in vivo (n = 5, p = 0.0146) (F) or Transwell co-culture (G) (n = 6, p = 0.001). Error bars indicate mean ± SEM. *p < 0.05, **p < 0.01.
Fig. 6.
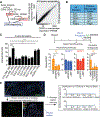
Fig. 6.. CD301b+ macrophage-derived ligands activate AP proliferation.
(A) Cell populations isolated from 5-day wound beds for RNA-sequencing (left) and FPKM scatterplot (right). (B) Table of ligands enriched in CD301b+ macrophages that bind to receptors on APs. (C) Quantification of AP proliferation following administration of ligands. 10% FBS is a positive control (n = 5, ***p < 0.001). (D) Quantification of in vivo cellular proliferation after administration of PDGFC (n = 6, p = 0.0337) and IGF1 (n = 6, p = 0.0436) neutralizing antibodies or antagonists against PDGFRα (Crenolanib) (n = 6, p=0.0001), IGFR1 (Linsitinib) (n = 4, p = 0.01017) or PI3K (Wortmannin) (n = 4, p = 0.0028). (E) Pipeline for processing immunostained wound bed sections to infer the distribution of CD301b+ macrophages in day 5 wounds (n = 6). Yellow lines delineate wound edges. Scale bar, 250μm. Error bars indicate mean ± SEM.

Comment in

  • Cellular networks in wound healing.
    Willenborg S, Eming SA. Willenborg S, et al. Science. 2018 Nov 23;362(6417):891-892. doi: 10.1126/science.aav5542. Science. 2018. PMID: 30467155 No abstract available.

References

    1. Wynn TA, Vannella KM, Macrophages in Tissue Repair, Regeneration, and Fibrosis. Immunity.44 450–462 (2016). - PMC - PubMed
    1. Ebmeier S, Horsley V, Origin of fibrosing cells in systemic sclerosis. Current Opinion in Rheumatology. 27, 555–562 (2015). - PMC - PubMed
    1. Gosain A, DiPietro LA, Aging and wound healing. World J Surg. 28, 321–326 (2004). - PubMed
    1. Ballas CB, Davidson JM, Delayed wound healing in aged rats is associated with increased collagen gel remodeling and contraction by skin fibroblasts, not with differences in apoptotic or myofibroblast cell populations. Wound Repair Regen. 9, 223–237 (2001). - PubMed
    1. Fujiwara T et al., Age-Associated Intracellular Superoxide Dismutase Deficiency Potentiates Dermal Fibroblast Dysfunction During Wound Healing. Exp. Dermatol. (2017), doi:10.1111/exd.13404. - DOI - PubMed

Publication types

MeSH terms