. 2018 Nov 22;18(12):4095.
doi: 10.3390/s18124095.

Smartphone-Based Indoor Localization within a 13th Century Historic Building

Affiliations

Smartphone-Based Indoor Localization within a 13th Century Historic Building

Toni Fetzer et al. Sensors (Basel). .

Abstract

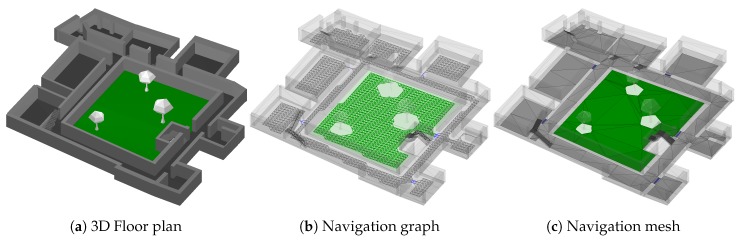
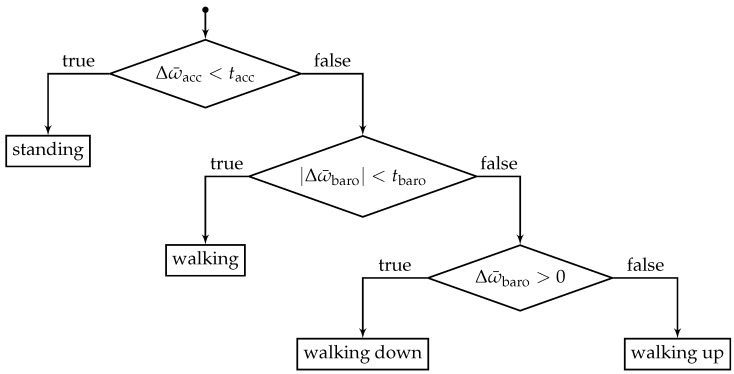
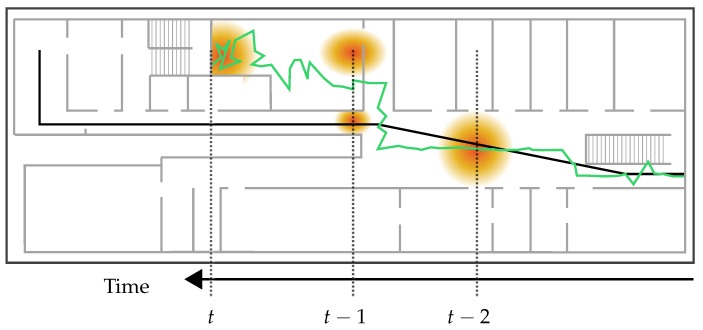
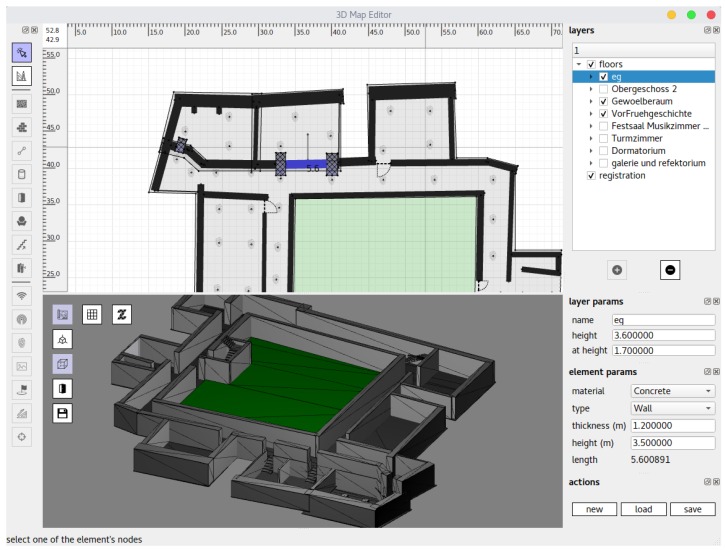
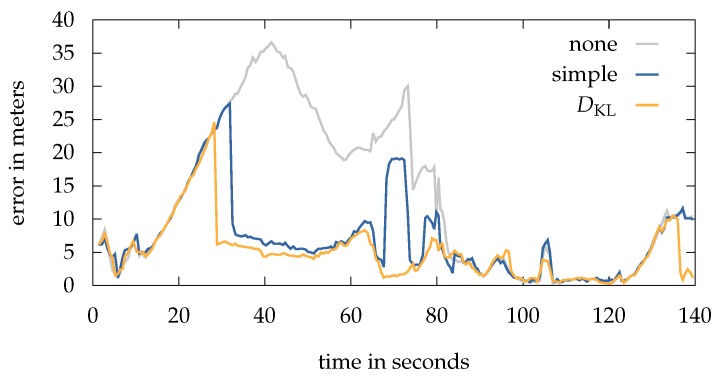
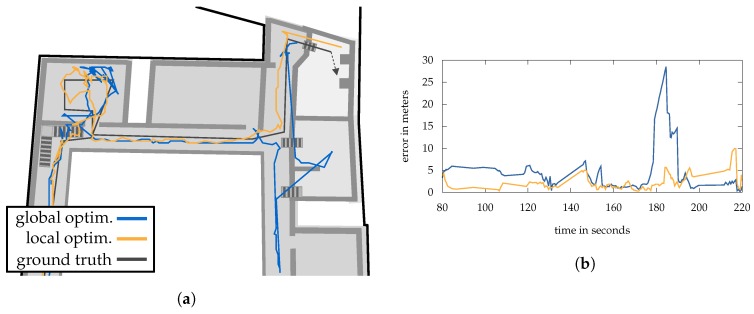
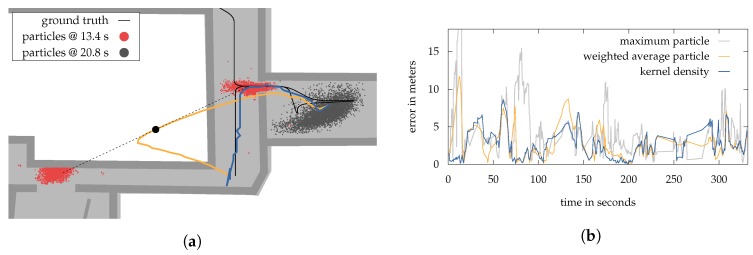
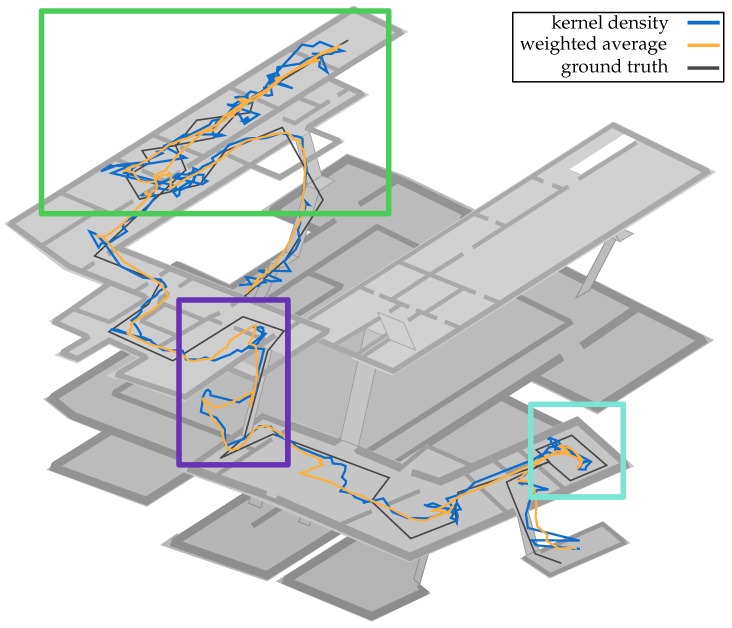
Within this work we present an updated version of our indoor localization system for smartphones. The pedestrian's position is given by means of recursive state estimation using a particle filter to incorporate different probabilistic sensor models. Our recently presented approximation scheme of the kernel density estimation allows to find an exact estimation of the current position, compared to classical methods like weighted-average. Absolute positioning information is given by a comparison between recent measurements of nearby access points and signal strength predictions. Instead of using time-consuming approaches like classic fingerprinting or measuring the exact positions of access points, we use an optimization scheme based on a set of reference measurements to estimate a corresponding model. This work provides three major contributions to the system. The most essential contribution is the novel state transition based on continuous walks along a navigation mesh, modeling only the building's walkable areas. The localization system is further updated by incorporating a threshold-based activity recognition using barometer and accelerometer readings, allowing for continuous and smooth floor changes. Within the scope of this work, we tackle problems like multimodal densities and sample impoverishment (system gets stuck) by introducing different countermeasures. For the latter, a simplification of our previous solution is presented for the first time, which does not involve any major changes to the particle filter. The goal of this work is to propose a fast to deploy localization solution, that provides reasonable results in a high variety of situations. To stress our system, we have chosen a very challenging test scenario. All experiments were conducted within a 13th century historic building, formerly a convent and today a museum. The system is evaluated using 28 distinct measurement series on four different test walks, up to 310 m length and 10 min duration. It can be shown, that the here presented localization solution is able to provide a small positioning error, even under difficult conditions and faulty measurements. The introduced filtering methods allow for a real fail-safe system, while the optimization scheme enables an on-site setup-time of less then 120 min for the building's 2500 m walkable area.

Keywords: PDR; Wi-Fi; estimation; historic buildings; indoor localization; navigation mesh; particle filter; sample impoverishment; sensor fusion; smartphone.


Conflict of interest statement

The authors declare no conflict of interest.

Figures

Figure 1
Figure 1
Floor plan (a) and automatically generated transition data structures (b,c) for the ground floor of the historic building ( 71 m × 53 m). To reach every nook and cranny, the generated graph (b) requires many nodes and edges. The depicted version uses a coarse node-spacing of 90 cm (1700 nodes) but barely reaches all doors and stairs. A navigation mesh generated for the same building required only 320 triangles (c) and reaches every corner within the building.
Figure 2
Figure 2
Decision tree describing the threshold-based activity recognition using the smartphone’s barometer and accelerometer measurements. The respective thresholds are given by tacc and tbaro. For each sensor the sigma of the arithmetic mean Δω¯=ω¯lω¯s of two different fix-sized windows ωs (short) and ωl (long), holding a set of the most current sensor measurements, is calculated. The process updates with every incoming barometer reading.
Figure 3
Figure 3
An example of the occurrence of sample impoverishment enhanced by a restrictive transition model that prevents sampling through walls. At time t1 the approximated position (green line) drifts apart from the ground truth (black line) due to uncertain measurements. The posterior distribution is then captured within the room and not able to recover by itself [3].
Figure 4
Figure 4
The 3D map editor we developed to create the floor plans. This screenshot shows the ground level of the building. The window is split into toolbar (left), layers (upper right), parameters of current selection (lower right), drawing mode (upper center) and 3D view (lower center).
Figure 5
Figure 5
The two mobile applications developed for Android. The localization app in (a) is used to record the Wi-Fi reference measurements based on the positions provided by the floor plan. In this screenshot the dialog for recording them is visible. The app also implements the here presented approach and can thus be used for localization. However, for the utilized experiments we used a simpler client (b) allowing for user input like a ground truth or activity button.
Figure 6
Figure 6
Simple staircase scenario to compare the old graph-based model with the new navigation mesh. All units are given in meter. The black line indicates the current position and the green line gives the estimated path until 25 or 180 steps, both using weighted average. The particles are colored according to their z-coordinate. A pedestrian walks up and down the stairs several times in a row. After 25 steps, both methods produce good results, although there are already some outliers (blue particles). After 180 steps, the outliers using the graph have multiplied, leading to a multimodal situation. In contrast, the mesh offers the possibility to remove particles that hit a wall and can thus prevent such a situation.
Figure 7
Figure 7
Ground level of the building in the xy-plane from above. Includes the locations of the reference points, the ground truth and the optimized APs. The grey line connects an AP with the corresponding optimization. The colored borders are areas of special interest and are discussed within the text. The corresponding pictures on the right side show the museum in these places.
Figure 8
Figure 8
All conducted walks within the building. The arrows indicate the running direction and a cross marks the end. For a better overview we have divided the building into three floors, which are connected by four stairs (numbered 1–4). However, each floor consists of different high levels. They are separated from each other by different shades of grey, dark is lower than light.
Figure 9
Figure 9
Error development over time of a single particle filter run of walk 0. Between 10 s and 24 s the Wi-Fi signal was highly attenuated, causing the system to get stuck and producing high errors. Both, the simple and the DKL anti-impoverishment method are able to recover early. However, between 65 s and 74 s the simple method produces high errors due to the high random factor involved.
Figure 10
Figure 10
(a) A small section of walk 3. Optimizing the system with a global Wi-Fi optimization scheme (blue) causes a big jump and thus high errors. This happens due to highly attenuated Wi-Fi signals and inappropriate Wi-Fi parameters. We compare this to a system optimized for each floor individually (orange), resolving the situation a producing reasonable results; (b) Error development over time for this section. The high error can be seen at 190 s.
Figure 11
Figure 11
(a) Occurring bimodal distribution caused by uncertain measurements in the first 13.4 s of walk 1. After 20.8 s, the distribution gets unimodal. The weigted-average estimation (orange) provides a high error compared to the ground truth (solid black), while the KDE approach (blue) does not; (b) Error development over time for the complete walk. From 230 s to 290 s to pedestrian was not moving.
Figure 12
Figure 12
Estimation results of walk 2 using the KDE method (blue) and the weighted-average (orange). While the latter provides a more smooth representation of the estimated locations, the former provides a better idea of the quality of the underlying processes. In order to keep a better overview, the top level of the last floor was hidden. The colored rectangles mark interesting areas. Within the green rectangle, the above mentioned differences between the two methods are clearly visible. The purple rectangle displays a situation in which a sample impoverishment was successfully resolved. The teal rectangle marks an area were both methods do not provide sufficient results.

References

    1. Möhring H. Reichsstadtmuseum Rothenburg. [(accessed on 22 March 2018)]; Available online: http://reichsstadtmuseum.rothenburg.de.
    1. Ebner F., Fetzer T., Köping L., Grzegorzek M., Deinzer F. Multi Sensor 3D Indoor Localisation; Proceedings of the 2015 International Conference on Indoor Positioning and Indoor Navigation (IPIN); Banff, AB, Canada. 13–16 October 2015.
    1. Fetzer T., Ebner F., Deinzer F., Grzegorzek M. Recovering from Sample Impoverishment in Context of Indoor Localisation; Proceedings of the 2017 International Conference on Indoor Positioning and Indoor Navigation (IPIN); Sapporo, Japan. 18–21 September 2017.
    1. Fetzer T., Ebner F., Köping L., Grzegorzek M., Deinzer F. On Monte Carlo Smoothing in Multi Sensor Indoor Localisation; Proceedings of the 2016 International Conference on Indoor Positioning and Indoor Navigation (IPIN); Madrid, Spain. 4–7 October 2016.
    1. Bullmann M., Fetzer T., Ebner F., Grzegorzek M., Deinzer F. Fast Kernel Density Estimation using Gaussian Filter Approximation; Proceedings of the 21th International Conference on Information Fusion (FUSION); Cambridge, UK. 10–13 July 2018; pp. 1245–1252.

LinkOut - more resources