

Frequency-dependent decoupling of domain-wall motion and lattice strain in bismuth ferrite
- PMID: 30467315
- PMCID: PMC6250669
- DOI: 10.1038/s41467-018-07363-y
Frequency-dependent decoupling of domain-wall motion and lattice strain in bismuth ferrite
Abstract
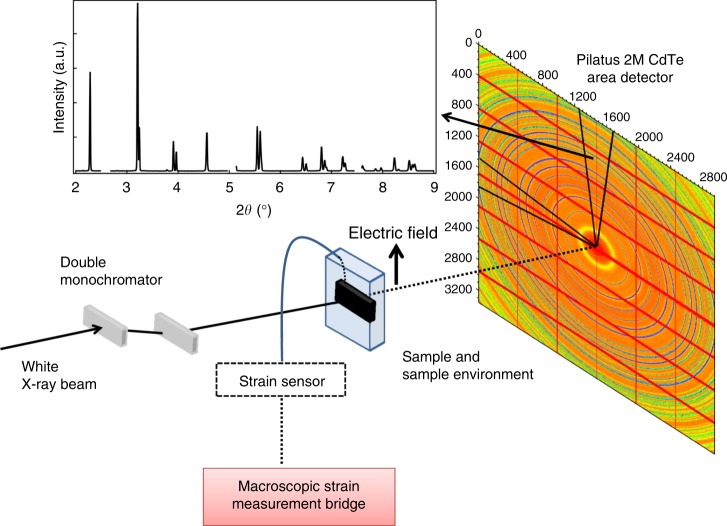
Dynamics of domain walls are among the main features that control strain mechanisms in ferroic materials. Here, we demonstrate that the domain-wall-controlled piezoelectric behaviour in multiferroic BiFeO3 is distinct from that reported in classical ferroelectrics. In situ X-ray diffraction was used to separate the electric-field-induced lattice strain and strain due to displacements of non-180° domain walls in polycrystalline BiFeO3 over a wide frequency range. These piezoelectric strain mechanisms have opposing trends as a function of frequency. The lattice strain increases with increasing frequency, showing negative piezoelectric phase angle (i.e., strain leads the electric field), an unusual feature so far demonstrated only in the total macroscopic piezoelectric response. Domain-wall motion exhibits the opposite behaviour, it decreases in magnitude with increasing frequency, showing more common positive piezoelectric phase angle (i.e., strain lags behind the electric field). Charge redistribution at conducting domain walls, oriented differently in different grain families, is demonstrated to be the cause.
Conflict of interest statement
J.D. is director of Critus Pty. Ltd. The other authors declare no competing interests.
Figures


Similar articles
-
Asymmetric Response of Ferroelastic Domain-Wall Motion under Applied Bias.ACS Appl Mater Interfaces. 2016 Feb 10;8(5):2935-41. doi: 10.1021/acsami.5b08312. Epub 2016 Jan 26. ACS Appl Mater Interfaces. 2016. PMID: 26695346
-
Simultaneous resonant x-ray diffraction measurement of polarization inversion and lattice strain in polycrystalline ferroelectrics.Sci Rep. 2016 Feb 11;6:20829. doi: 10.1038/srep20829. Sci Rep. 2016. PMID: 26864859 Free PMC article.
-
Quantitative analysis of the direct piezoelectric response of bismuth ferrite films by scanning probe microscopy.Sci Rep. 2019 Dec 23;9(1):19727. doi: 10.1038/s41598-019-56261-w. Sci Rep. 2019. PMID: 31873166 Free PMC article.
-
Relationship among the Crystal Structure, Texture, and Macroscopic Properties of Tetragonal (Pb,La)(Zr,Ti)O3 Ferroelectrics Investigated by In Situ High-Energy Synchrotron Diffraction.Inorg Chem. 2020 Sep 21;59(18):13632-13638. doi: 10.1021/acs.inorgchem.0c02002. Epub 2020 Aug 30. Inorg Chem. 2020. PMID: 32862641
-
Functional Ferroic Domain Walls for Nanoelectronics.Materials (Basel). 2019 Sep 10;12(18):2927. doi: 10.3390/ma12182927. Materials (Basel). 2019. PMID: 31510049 Free PMC article. Review.
Cited by
-
Domain-wall pinning and defect ordering in BiFeO3 probed on the atomic and nanoscale.Nat Commun. 2020 Apr 9;11(1):1762. doi: 10.1038/s41467-020-15595-0. Nat Commun. 2020. PMID: 32273515 Free PMC article.
-
ID15A at the ESRF - a beamline for high speed operando X-ray diffraction, diffraction tomography and total scattering.J Synchrotron Radiat. 2020 Mar 1;27(Pt 2):515-528. doi: 10.1107/S1600577519016813. Epub 2020 Jan 28. J Synchrotron Radiat. 2020. PMID: 32153293 Free PMC article.
-
Characterization and calibration of DECTRIS PILATUS3 X CdTe 2M high-Z hybrid pixel detector for high-precision powder diffraction measurements.J Appl Crystallogr. 2025 Feb 1;58(Pt 1):76-86. doi: 10.1107/S1600576724010033. eCollection 2025 Feb 1. J Appl Crystallogr. 2025. PMID: 39917188 Free PMC article.
References
-
- Catalan G, Seidel J, Ramesh R, Scott JF. Domain wall nanoelectronics. Rev. Mod. Phys. 2012;84:119–156. doi: 10.1103/RevModPhys.84.119. - DOI
Publication types
LinkOut - more resources
Full Text Sources
Molecular Biology Databases
