. 2018 Nov 22;9(1):4943.
doi: 10.1038/s41467-018-07129-6.

Locally anchoring enzymes to tissues via extracellular glycan recognition

Affiliations

Locally anchoring enzymes to tissues via extracellular glycan recognition

Shaheen A Farhadi et al. Nat Commun. .

Abstract

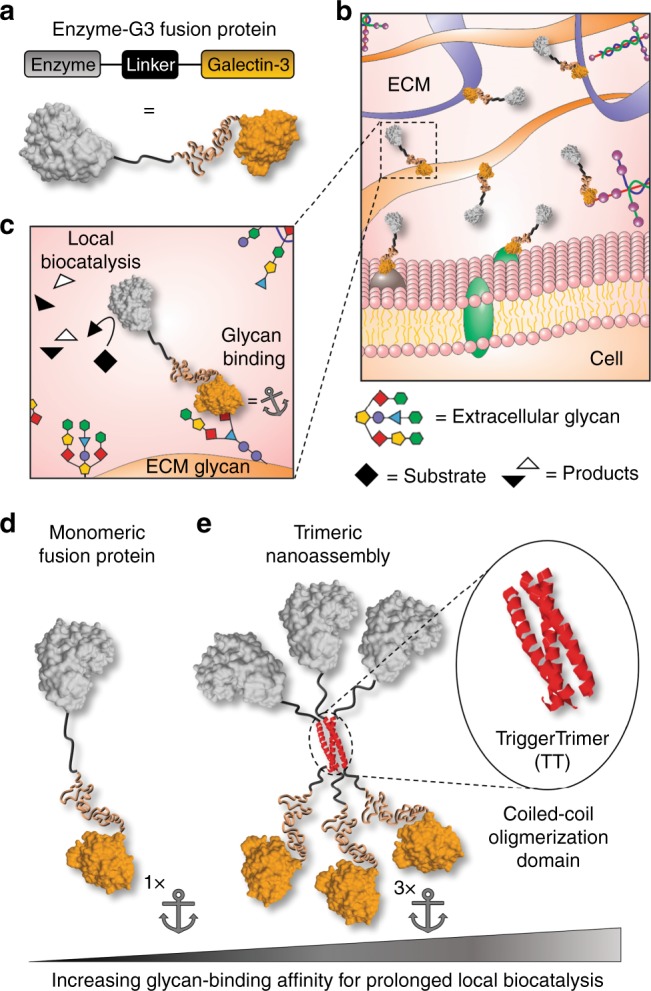
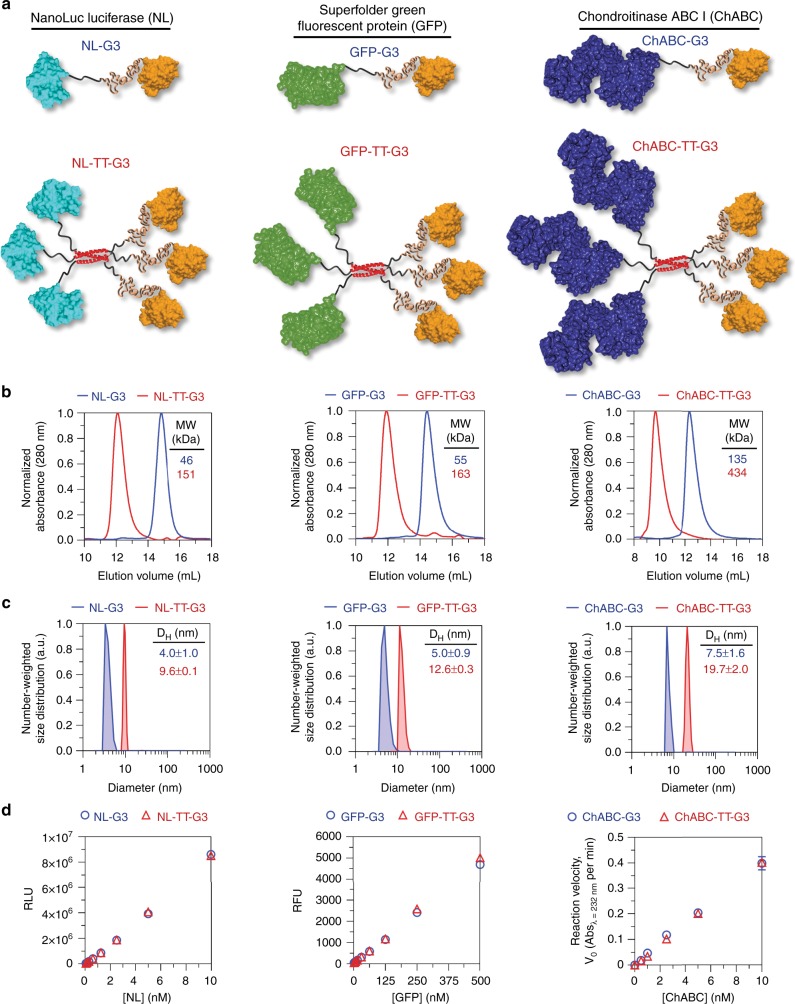
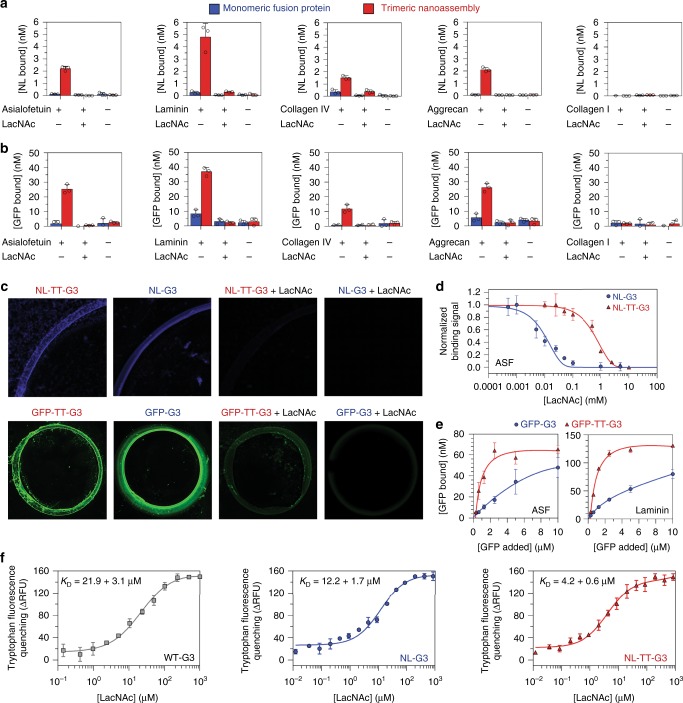
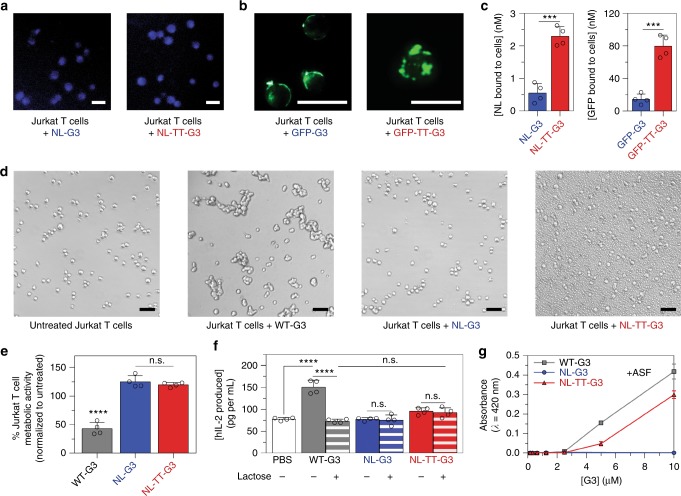
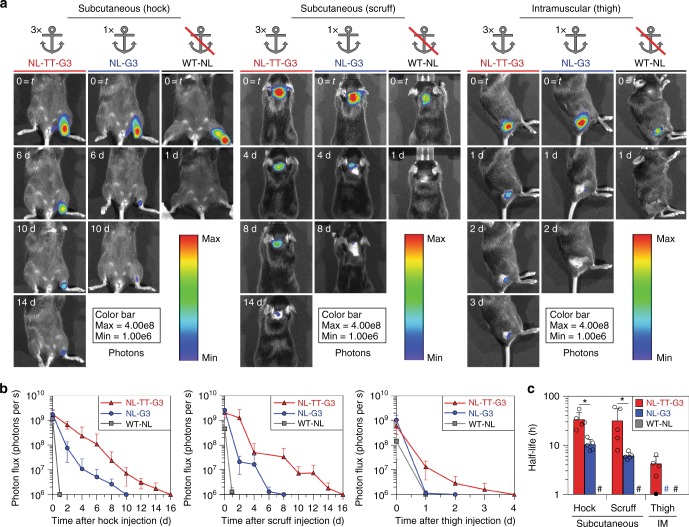
Success of enzymes as drugs requires that they persist within target tissues over therapeutically effective time frames. Here we report a general strategy to anchor enzymes at injection sites via fusion to galectin-3 (G3), a carbohydrate-binding protein. Fusing G3 to luciferase extended bioluminescence in subcutaneous tissue to ~7 days, whereas unmodified luciferase was undetectable within hours. Engineering G3-luciferase fusions to self-assemble into a trimeric architecture extended bioluminescence in subcutaneous tissue to 14 days, and intramuscularly to 3 days. The longer local half-life of the trimeric assembly was likely due to its higher carbohydrate-binding affinity compared to the monomeric fusion. G3 fusions and trimeric assemblies lacked extracellular signaling activity of wild-type G3 and did not accumulate in blood after subcutaneous injection, suggesting low potential for deleterious off-site effects. G3-mediated anchoring to common tissue glycans is expected to be broadly applicable for improving local pharmacokinetics of various existing and emerging enzyme drugs.


Conflict of interest statement

A pending patent has been filed by the University of Florida related to materials reported in this manuscript that lists G.A.H., B.G.K., S.A.F., E.B.-S., A.R., M.M.F., and S.L.F. as inventors. Publication No. WO2018067660A1; Publication date 04/12/2018. A provisional patent has been filed by the University of Florida related to materials reported in this manuscript that lists G.A.H., B.G.K., D.T.S., and S.A.F. as inventors. Serial No. 62/751,146; Filing date 10/26/2018.

Figures

Fig. 1
Fig. 1
Design of G3 fusion proteins to locally anchor enzymes to tissues via extracellular glycan binding. ac Schematic of recombinant enzymes fused with galectin-3 (i.e., enzyme-G3 fusion protein), which are anchored to an injection site via binding to cell surface and extracellular matrix (ECM) glycans. d Monomeric fusion protein consisting of an enzyme linked to the N-terminal domain of galectin-3 via a flexible peptide linker. e Trimeric nanoassembly formed by inserting the TT domain between the enzyme and G3 domains. The trimeric nanoassembly has higher glycan-binding affinity than the monomeric fusion protein due to multivalent avidity effects. PDB ID: 253L [10.2210/pdb253L/pdb] (generic enzyme), 2O7H [10.2210/pdb2O7H/pdb] (generic coiled-coil), and 5NF7 [10.2210/pdb5NF7/pdb] (carbohydrate-recognition domain of galectin-3)
Fig. 2
Fig. 2
Design and characterization of monomeric G3 fusion proteins and trimeric nanoassemblies. a Predicted structure of NanoLucTM luciferase (NL), superfolder green fluorescent protein (GFP), and chondroitinase ABC I (ChABC) monomeric G3 fusion proteins and trimeric nanoassemblies. b Approximate molecular weight determined under native conditions via size-exclusion chromatography. c Average hydrodynamic diameter estimated via dynamic light scattering. d Quantitative bioluminescence, fluorescence, and reaction velocity of NL, GFP, and ChABC fusions, respectively. PDB ID: 5IBO [10.2210/pdb5IBO/pdb] (NanoLucTM luciferase), 2B3P [10.2210/pdb2B3P/pdb] (superfolder GFP), 1HN0 [10.2210/pdb1HN0/pdb] (ChABC) for a. N ≥ 3, mean ± s.d. for c. N = 3, mean ± s.d. for d. Data for monomeric G3 fusion proteins appear as blue circles/traces, trimeric nanoassemblies as red triangles/traces
Fig. 3
Fig. 3
Carbohydrate-binding properties of monomeric G3 fusion proteins and trimeric nanoassemblies. a, b NL-G3, NL-TT-G3, GFP-G3, and GFP-TT-G3 binding to asialofetuin (ASF), laminin, collagen IV, aggrecan, and collagen I (negative control) adsorbed onto plastic. c Micrographs taken of NL luminescence or GFP fluorescence localized to a laminin coffee ring adsorbed onto glass. Fusion proteins were mixed with soluble LacNAc to demonstrate inhibition of binding to adsorbed glycoconjugates for ac. d Competitive inhibition of binding of NL-G3 and NL-TT-G3 to adsorbed ASF by soluble LacNAc. e Saturation binding of GFP-G3 and GFP-TT-G3 to adsorbed ASF and laminin. f Tryptophan fluorescence quenching of wild-type G3 (WT-G3), NL-G3, and NL-TT-G3 via binding to soluble LacNAc. N = 3, mean ± s.d. for a, b, df. Data points at or above baseline signal are shown as open circles in a, b. Data for WT-G3 appear as gray squares/traces, for monomeric G3 fusion proteins as blue bars/circles/traces, and trimeric nanoassemblies as red bars/triangles/traces
Fig. 4
Fig. 4
Extracellular signaling activity of monomeric G3 fusion proteins and trimeric nanoassemblies. a Micrographs demonstrating NL-G3 and NL-TT-G3 bioluminescence on Jurkat T cells using a blue fluorescence filter. b Micrographs demonstrating GFP-G3 and GFP-TT-G3 fluorescence on Jurkat T cells using a green fluorescence filter. c Amount of NL or GFP bound to Jurkat T cells after 4 h incubation with NL-G3, NL-TT-G3, GFP-G3, or GFP-TT-G3. d Bright-field micrographs of Jurkat T cells incubated with PBS (untreated, negative control), WT-G3 (positive control), NL-G3, or NL-TT-G3 for 4 h. e Percentage of metabolic activity of Jurkat T cells incubated with WT-G3 (positive control), NL-G3, or NL-TT-G3 for 4 h. f hIL-2 produced by Jurkat T cells after incubation with PBS (negative control), WT-G3 (positive control), NL-G3, or NL-TT-G3 for 24 h. Lactose was added as an inhibitor of G3 binding to Jurkat T cells. g Asialofetuin (ASF) (7 µM) precipitation with various quantities of WT-G3, NL-G3, or NL-TT-G3 as measured by light scattering and absorbance at 420 nm. N = 4, mean ± s.d., ***p < 0.001, Student’s t test for c. N = 4, mean ± s.d., n.s. is no significant differences, ****p < 0.0001, ANOVA with Tukey’s post hoc for e and f. N = 3, mean ± s.d. for g. Scale bar = 25 µm for a, b. Scale bar = 50 µm for d. Data points at or above baseline signal are shown as open circles in c, e, f. Data for WT-G3 appear as gray bars/squares/traces, for monomeric G3 fusion proteins as blue bars/circles/traces, and for trimeric nanoassemblies as red bars/triangles/traces
Fig. 5
Fig. 5
Injection site half-life of monomeric G3 fusion proteins and trimeric nanoassemblies. a Bioluminescence images and b photon flux at various time points for mice that received NL-TT-G3, NL-G3, or WT-NL (equivalent moles of NL) in the hock, scruff, or thigh. c Biocatalytic activity half-life of NL-TT-G3, NL-G3, or WT-NL in different tissues. N = 5, mean ± s.d., *p < 0.05, ANOVA with Tukey’s post hoc. In c, open circles represent each half-life calculation, closed circle represents individual animals for which half-life could not be accurately calculated due to rapid enzyme clearance from the injection site, and hash sign represents groups for which half-life could not be accurately calculated due to rapid enzyme clearance from the injection site (signal at t = 24 was at baseline for ≥3 animals in a cohort). Data for WT-NL appear as gray bars/squares/traces, NL-G3 as blue bars/circles/traces, and NL-TT-G3 as red bars/triangles/traces
Fig. 6
Fig. 6
Circulating concentration and proteolysis of monomeric G3 fusion proteins and trimeric nanoassemblies. a Percentage of NL, by total mass injected, in blood samples collected over time after subcutaneous injection into the hock. b Percentage of NL activity, relative to NL activity at the initial time point, in 25% mouse serum in vitro. c Schematic of ECM proteases, such as collagenase and other MMPs, digesting the N-terminal domain (NTD) of G3, thereby separating the carbohydrate-recognition domain (CRD) of G3 from the enzyme fusion partner. d SDS-PAGE analysis of collagenase-mediated digestion of WT-G3, NL-G3, and NL-TT-G3. Uncropped gel image found in Supplementary Figure 26. N = 5, mean ± s.d. for a. N = 3, mean ± s.d. for b. Data for NL-G3 appear as blue circles/traces and NL-TT-G3 as red triangles/traces

References

    1. Platt FM. Emptying the stores: lysosomal diseases and therapeutic strategies. Nat. Rev. Drug Discov. 2017;17:133–150. doi: 10.1038/nrd.2017.214. - DOI - PubMed
    1. Bradford KL, Moretti FA, Carbonaro-Sarracino DA, Gaspar HB, Kohn DB. Adenosine deaminase (ADA)-deficient severe combined immune deficiency (SCID): molecular pathogenesis and clinical manifestations. J. Clin. Immunol. 2017;37:626–637. doi: 10.1007/s10875-017-0433-3. - DOI - PubMed
    1. Lopes AM, et al. Therapeutic l-asparaginase: upstream, downstream and beyond. Crit. Rev. Biotechnol. 2017;37:82–99. doi: 10.3109/07388551.2015.1120705. - DOI - PubMed
    1. Lyseng-Williamson KA. Coagulation factor IX (recombinant), albumin fusion protein (albutrepenonacog alfa; Idelvion®): a review of its use in haemophilia B. Drugs. 2017;77:97–106. doi: 10.1007/s40265-016-0679-8. - DOI - PubMed
    1. Gurman P, et al. Recombinant tissue plasminogen activators (rtPA): a review. Clin. Pharmacol. Ther. 2015;97:274–285. doi: 10.1002/cpt.33. - DOI - PubMed

Publication types

MeSH terms