. 2019 Mar;27(3):475-483.
doi: 10.1038/s41431-018-0304-2. Epub 2018 Nov 22.

The role of matrilineality in shaping patterns of Y chromosome and mtDNA sequence variation in southwestern Angola

Affiliations

The role of matrilineality in shaping patterns of Y chromosome and mtDNA sequence variation in southwestern Angola

Sandra Oliveira et al. Eur J Hum Genet. 2019 Mar.

Abstract

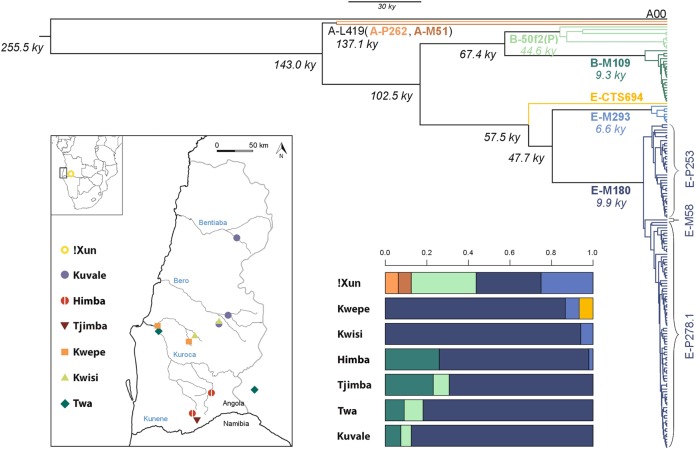
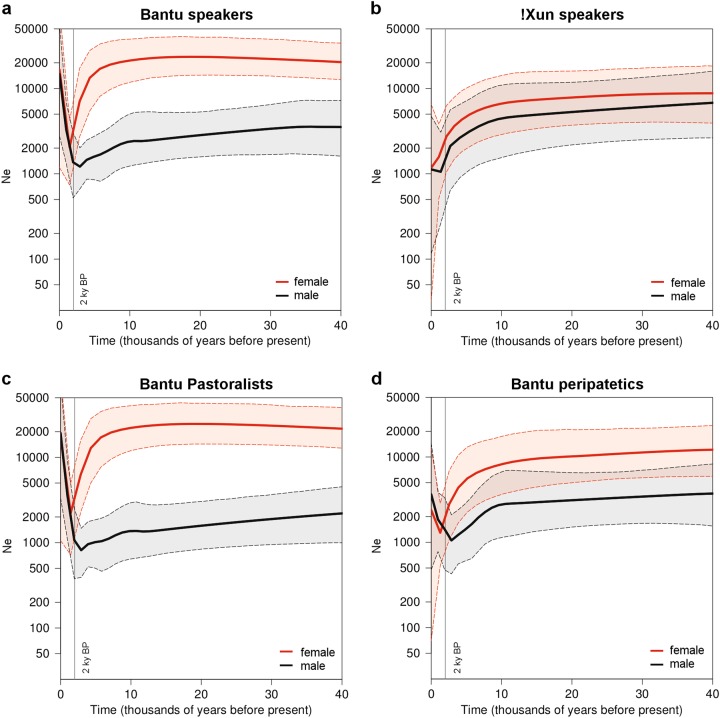
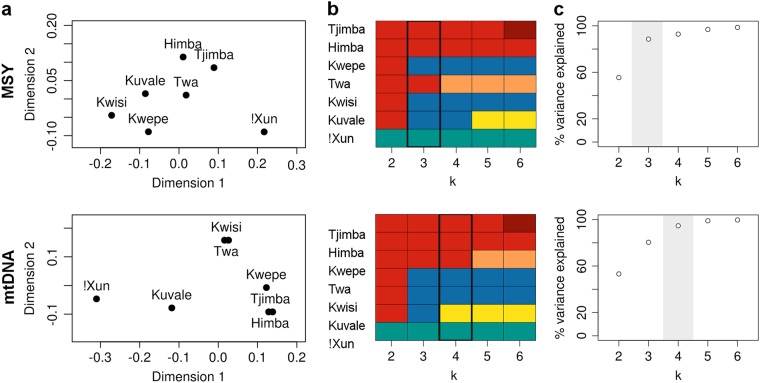
Southwestern Angola is a region characterized by contact between indigenous foragers and incoming food-producers, involving genetic and cultural exchanges between peoples speaking Kx'a, Khoe-Kwadi, and Bantu languages. Although present-day Bantu speakers share a patrilocal residence pattern and matrilineal principle of clan and group membership, a highly stratified social setting divides dominant pastoralists from marginalized groups that subsist on alternative strategies and have previously been thought to have pre-Bantu origins. Here, we compare new high-resolution sequence data from 2.3 Mb of the male-specific region of the Y chromosome (MSY) from 170 individuals with previously reported mitochondrial DNA (mtDNA) genomes, to investigate the population history of seven representative southwestern Angolan groups (Himba, Kuvale, Kwisi, Kwepe, Twa, Tjimba, !Xun), and to study the causes and consequences of sex-biased processes in their genetic variation. We found no clear link between the formerly Kwadi-speaking Kwepe and pre-Bantu eastern African migrants, and no pre-Bantu MSY lineages among Bantu-speaking groups, except for small amounts of "Khoisan" introgression. We therefore propose that irrespective of their subsistence strategies, all Bantu-speaking groups of the area share a male Bantu origin. Additionally, we show that in Bantu-speaking groups, the levels of among-group and between-group variation are higher for mtDNA than for MSY. These results, together with our previous demonstration that the matriclanic systems of southwestern Angolan Bantu groups are genealogically consistent, suggest that matrilineality strongly enhances both female population sizes and interpopulation mtDNA variation.


Conflict of interest statement

The authors declare that they have no conflict of interest.

Figures

Fig. 1
Fig. 1
Y chromosome phylogeny, haplogroup distribution, and map of the sampling locations. The phylogenetic tree was reconstructed in BEAST based on 2379 SNPs and is in accordance with the known Y chromosome topology [7, 27, 30]. Main haplogroup clades and their labels are shown with different colors. Age estimates are reported in italics near each node, with the mean TMRCA of main haplogroups shown with their corresponding color. A map of the sampling locations, re-used with permission from Oliveira et al. [9], is shown on the bottom left, and the haplogroup distribution per population is shown on the bottom right, with color-coding corresponding to the phylogenetic tree. In the map, the Angolan Namib province is delimited by a gray contour, country borders are show in black, and the names of the main intermittent rivers are indicated in blue
Fig. 2
Fig. 2
Bayesian skyline plots (BSP) of effective population size change through time, based on mtDNA (red) and the MSY (black). Thick lines show the mean estimates and dashed lines show the 95% HPD intervals. The vertical line highlights the 2 ky before present mark. Effective sizes are plotted on a log scale. Generation times of 25 and 31 years were assumed for mtDNA and the MSY, respectively [26]
Fig. 3
Fig. 3
Multidimensional scaling (MDS) and k-means analysis based on Фst distances of mtDNA and the MSY. a MDS. The stress values are 0.003 and 0.006 for MSY and mtDNA, respectively. b k-means. Each color represents the cluster assigned to a population. c Percentage of variance explained by each k. The best k (i.e., the value where the percentage of the variance explained starts to plateau) is highlighted in gray

References

    1. Webster TH, Sayres MAW. Genomic signatures of sex-biased demography: progress and prospects. Curr Opin Genet Dev. 2016;41:62–71. doi: 10.1016/j.gde.2016.08.002. - DOI - PubMed
    1. Heyer E, Chaix R, Pavard S, Austerlitz F. Sex-specific demographic behaviours that shape human genomic variation. Mol Ecol. 2012;21:597–612. doi: 10.1111/j.1365-294X.2011.05406.x. - DOI - PubMed
    1. Jobling MA, Tyler-Smith C. Human Y-chromosome variation in the genome-sequencing era. Nat Rev Genet. 2017;18:485–97. doi: 10.1038/nrg.2017.36. - DOI - PubMed
    1. Karmin M, Saag L, Vicente M, Sayres MAW, Järve M, Talas UG, et al. A recent bottleneck of Y chromosome diversity coincides with a global change in culture. Genome Res. 2015;25:459–66. doi: 10.1101/gr.186684.114. - DOI - PMC - PubMed
    1. Hallast P, Batini C, Zadik D, Delser PM, Wetton JH, Arroyo-Pardo E, et al. The Y-chromosome tree bursts into leaf: 13,000 high-confidence SNPs covering the majority of known clades. Mol Biol Evol. 2014;32:661–73. doi: 10.1093/molbev/msu327. - DOI - PMC - PubMed

Publication types

Substances