

Behavioral Outcomes Following Brain-Computer Interface Intervention for Upper Extremity Rehabilitation in Stroke: A Randomized Controlled Trial
- PMID: 30467461
- PMCID: PMC6235950
- DOI: 10.3389/fnins.2018.00752
Behavioral Outcomes Following Brain-Computer Interface Intervention for Upper Extremity Rehabilitation in Stroke: A Randomized Controlled Trial
Abstract
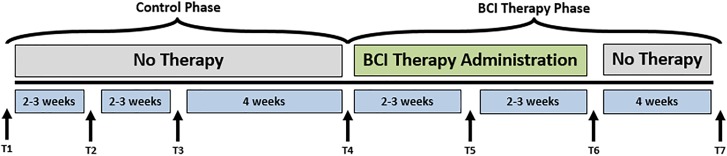
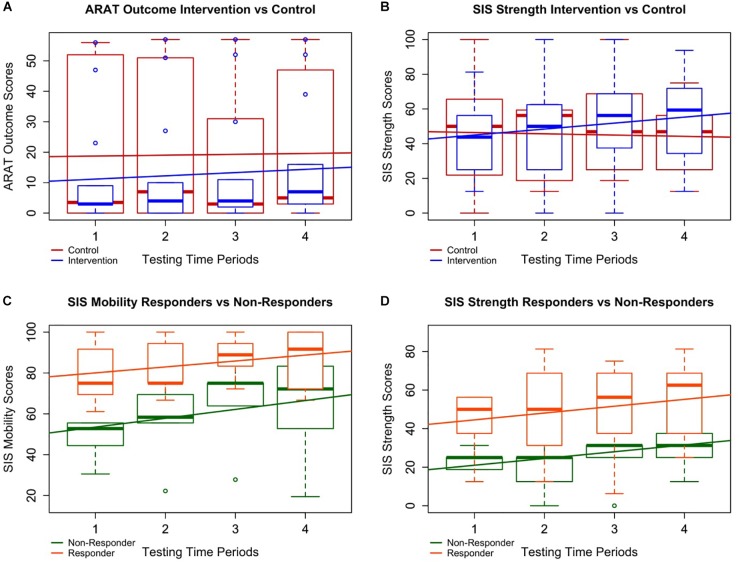
Stroke is a leading cause of persistent upper extremity (UE) motor disability in adults. Brain-computer interface (BCI) intervention has demonstrated potential as a motor rehabilitation strategy for stroke survivors. This sub-analysis of ongoing clinical trial (NCT02098265) examines rehabilitative efficacy of this BCI design and seeks to identify stroke participant characteristics associated with behavioral improvement. Stroke participants (n = 21) with UE impairment were assessed using Action Research Arm Test (ARAT) and measures of function. Nine participants completed three assessments during the experimental BCI intervention period and at 1-month follow-up. Twelve other participants first completed three assessments over a parallel time-matched control period and then crossed over into the BCI intervention condition 1-month later. Participants who realized positive change (≥1 point) in total ARAT performance of the stroke affected UE between the first and third assessments of the intervention period were dichotomized as "responders" (<1 = "non-responders") and similarly analyzed. Of the 14 participants with room for ARAT improvement, 64% (9/14) showed some positive change at completion and approximately 43% (6/14) of the participants had changes of minimal detectable change (MDC = 3 pts) or minimally clinical important difference (MCID = 5.7 points). Participants with room for improvement in the primary outcome measure made significant mean gains in ARATtotal score at completion (ΔARATtotal = 2, p = 0.028) and 1-month follow-up (ΔARATtotal = 3.4, p = 0.0010), controlling for severity, gender, chronicity, and concordance. Secondary outcome measures, SISmobility, SISadl, SISstrength, and 9HPTaffected, also showed significant improvement over time during intervention. Participants in intervention through follow-up showed a significantly increased improvement rate in SISstrength compared to controls (p = 0.0117), controlling for severity, chronicity, gender, as well as the individual effects of time and intervention type. Participants who best responded to BCI intervention, as evaluated by ARAT score improvement, showed significantly increased outcome values through completion and follow-up for SISmobility (p = 0.0002, p = 0.002) and SISstrength (p = 0.04995, p = 0.0483). These findings may suggest possible secondary outcome measure patterns indicative of increased improvement resulting from this BCI intervention regimen as well as demonstrating primary efficacy of this BCI design for treatment of UE impairment in stroke survivors. Clinical Trial Registration: ClinicalTrials.gov, NCT02098265.
Keywords: brain–computer interface (BCI); hemiparesis; motor function; recovery; rehabilitation; stroke; upper extremity.
Figures
Similar articles
-
Ipsilesional Mu Rhythm Desynchronization and Changes in Motor Behavior Following Post Stroke BCI Intervention for Motor Rehabilitation.Front Neurosci. 2019 Mar 6;13:53. doi: 10.3389/fnins.2019.00053. eCollection 2019. Front Neurosci. 2019. PMID: 30899211 Free PMC article.
-
The Promotoer, a brain-computer interface-assisted intervention to promote upper limb functional motor recovery after stroke: a study protocol for a randomized controlled trial to test early and long-term efficacy and to identify determinants of response.BMC Neurol. 2020 Jun 27;20(1):254. doi: 10.1186/s12883-020-01826-w. BMC Neurol. 2020. PMID: 32593293 Free PMC article.
-
Ipsilesional Mu Rhythm Desynchronization Correlates With Improvements in Affected Hand Grip Strength and Functional Connectivity in Sensorimotor Cortices Following BCI-FES Intervention for Upper Extremity in Stroke Survivors.Front Hum Neurosci. 2021 Oct 28;15:725645. doi: 10.3389/fnhum.2021.725645. eCollection 2021. Front Hum Neurosci. 2021. PMID: 34776902 Free PMC article.
-
Brain-computer interfaces for post-stroke motor rehabilitation: a meta-analysis.Ann Clin Transl Neurol. 2018 Mar 25;5(5):651-663. doi: 10.1002/acn3.544. eCollection 2018 May. Ann Clin Transl Neurol. 2018. PMID: 29761128 Free PMC article. Review.
-
Immediate and long-term effects of BCI-based rehabilitation of the upper extremity after stroke: a systematic review and meta-analysis.J Neuroeng Rehabil. 2020 Apr 25;17(1):57. doi: 10.1186/s12984-020-00686-2. J Neuroeng Rehabil. 2020. PMID: 32334608 Free PMC article.
Cited by
-
Poststroke motor, cognitive and speech rehabilitation with brain-computer interface: a perspective review.Stroke Vasc Neurol. 2022 Jul 19;7(6):541-9. doi: 10.1136/svn-2022-001506. Online ahead of print. Stroke Vasc Neurol. 2022. PMID: 35853669 Free PMC article. Review.
-
Efficacy of brain-computer interface training with motor imagery-contingent feedback in improving upper limb function and neuroplasticity among persons with chronic stroke: a double-blinded, parallel-group, randomized controlled trial.J Neuroeng Rehabil. 2025 Jan 6;22(1):1. doi: 10.1186/s12984-024-01535-2. J Neuroeng Rehabil. 2025. PMID: 39757218 Free PMC article. Clinical Trial.
-
Determining optimal mobile neurofeedback methods for motor neurorehabilitation in children and adults with non-progressive neurological disorders: a scoping review.J Neuroeng Rehabil. 2022 Sep 28;19(1):104. doi: 10.1186/s12984-022-01081-9. J Neuroeng Rehabil. 2022. PMID: 36171602 Free PMC article.
-
EEG-based sensorimotor neurofeedback for motor neurorehabilitation in children and adults: A scoping review.Clin Neurophysiol. 2024 Nov;167:143-166. doi: 10.1016/j.clinph.2024.08.009. Epub 2024 Aug 20. Clin Neurophysiol. 2024. PMID: 39321571 Free PMC article.
-
Workshops of the Eighth International Brain-Computer Interface Meeting: BCIs: The Next Frontier.Brain Comput Interfaces (Abingdon). 2022;9(2):69-101. doi: 10.1080/2326263X.2021.2009654. Epub 2022 Feb 8. Brain Comput Interfaces (Abingdon). 2022. PMID: 36908334 Free PMC article.
References
Associated data
Grants and funding
LinkOut - more resources
Full Text Sources
Medical