. 2019 Jan;23(1):328-339.
doi: 10.1111/jcmm.13934. Epub 2018 Nov 22.

Testin protects against cardiac hypertrophy by targeting a calcineurin-dependent signalling pathway

Affiliations

Testin protects against cardiac hypertrophy by targeting a calcineurin-dependent signalling pathway

Lu Gao et al. J Cell Mol Med. 2019 Jan.

Abstract

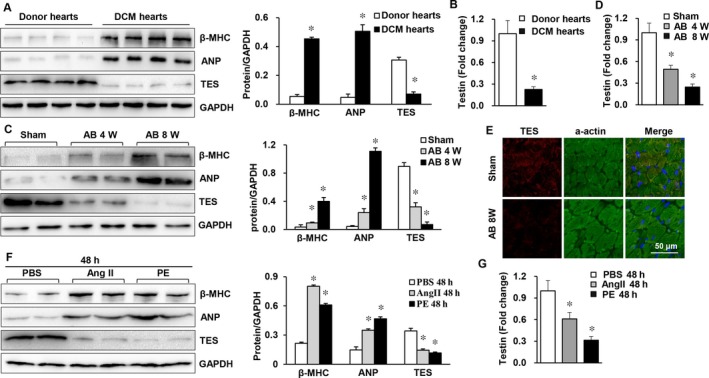
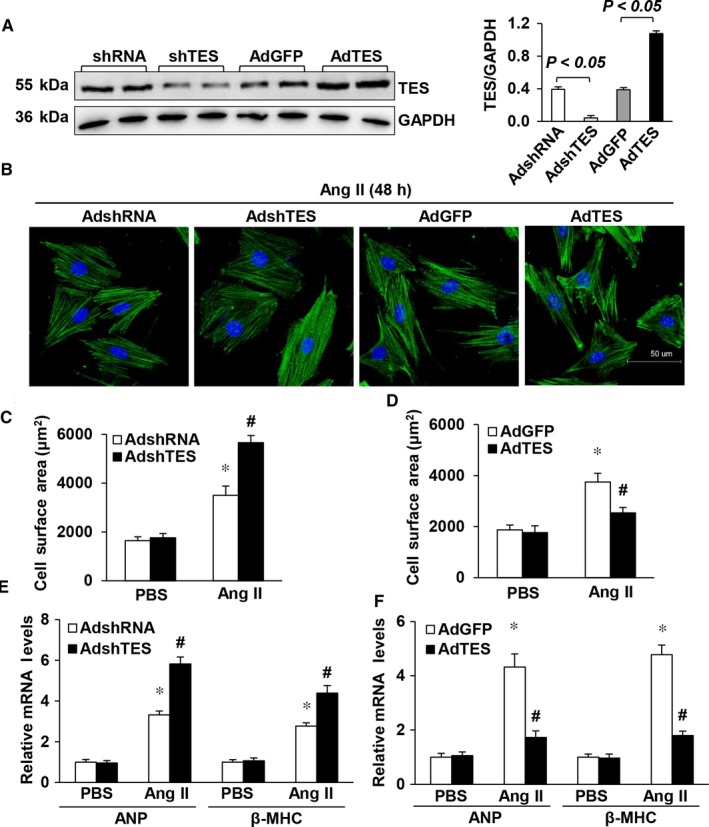
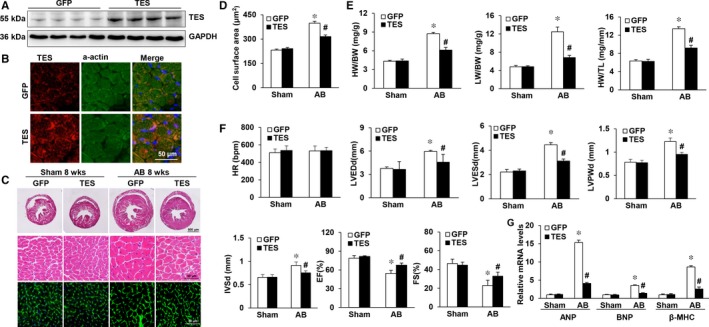
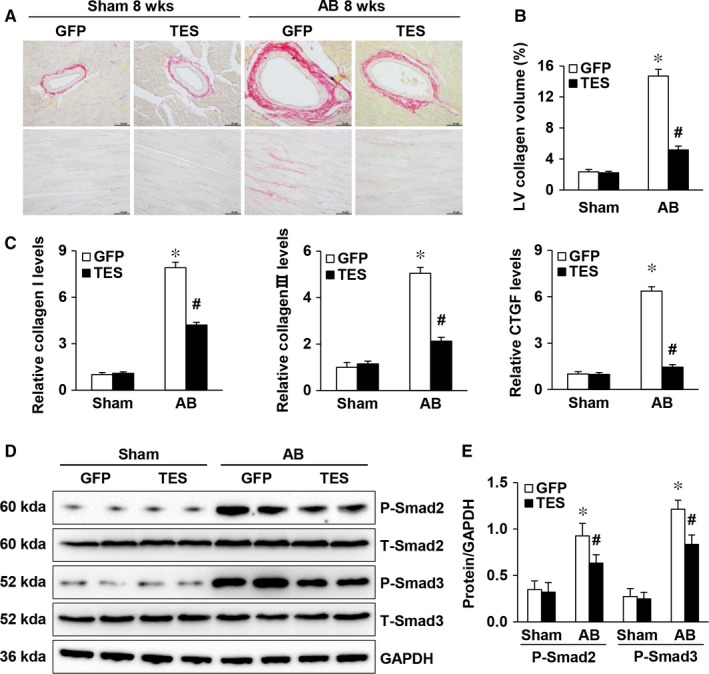
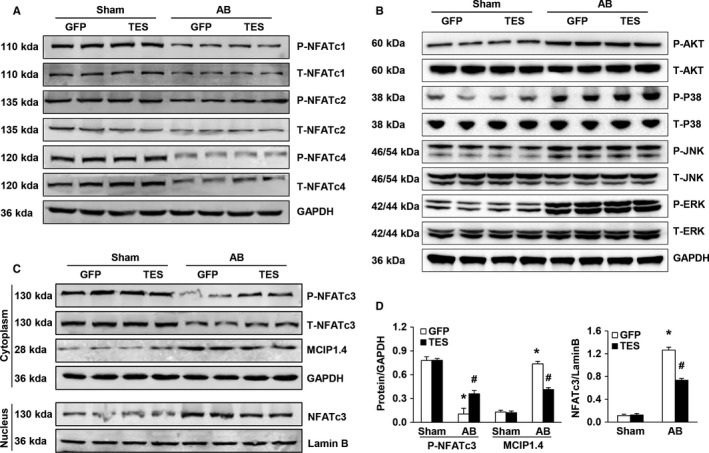
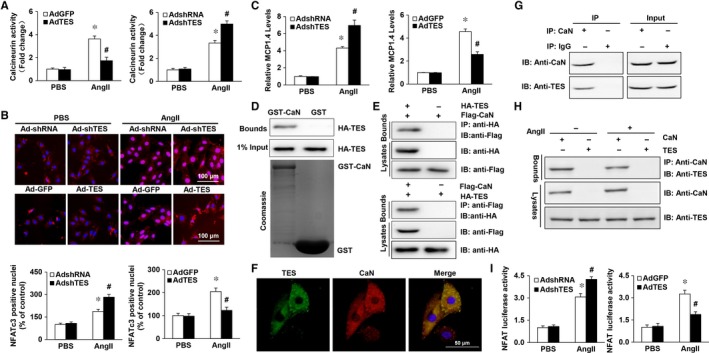
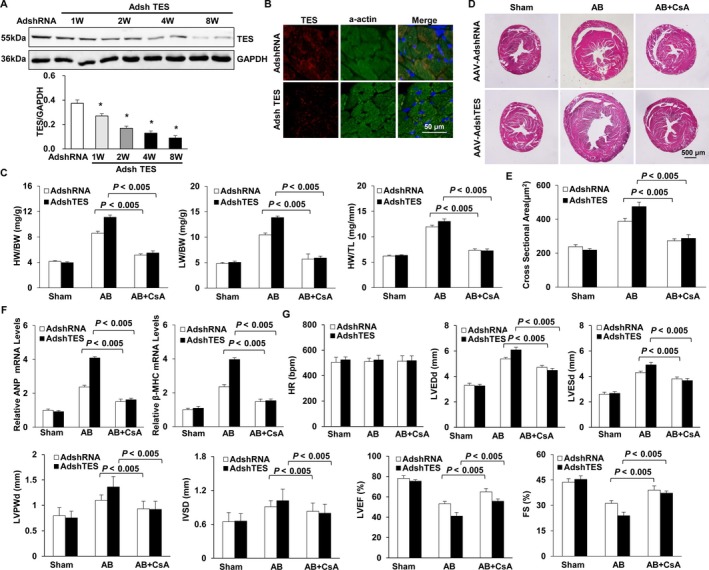
Multiple organs express testin (TES), including the heart. Nevertheless, current understanding of the influence of TES on cardiovascular diseases, especially on cardiac hypertrophy and its etiology, is insufficient. This study investigated the influence of TES on cardiac hypertrophy and its etiology. Murine models with excessive TES expression specific to the heart were constructed with an adeno-associated virus expression system. Cardiac hypertrophy was stimulated through aortic banding (AB). The severity of cardiac hypertrophy was evaluated through molecular, echocardiographic, pathological, and hemodynamic examination. The findings of our study revealed that TES expression was remarkably suppressed not only in failing human hearts but also in mouse hearts with cardiac hypertrophy. It was discovered that excessive TES expression driven by an adeno-associated viral vector noticeably inhibited hypertrophy triggered by angiotensin II (Ang II) in cultivated cardiomyocytes from newborn rats. It was also revealed that TES knockdown via AdshTES caused the reverse phenotype in cardiomyocytes. Furthermore, it was proved that excessive TES expression attenuated the ventricular dilation, cardiac hypertrophy, dysfunction, and fibrosis triggered by AB in mice. It was discovered that TES directly interacted with calcineurin and suppressed its downstream signalling pathway. Moreover, the inactivation of calcineurin with cyclosporin A greatly offset the exacerbated hypertrophic response triggered by AB in TES knockdown mice. Overall, the findings of our study suggest that TES serves as a crucial regulator of the hypertrophic reaction by hindering the calcineurin-dependent pathway in the heart.

Keywords: calcineurin; cardiac hypertrophy; signalling pathway; testin.


Figures

Figure 1
Figure 1
TES expression was suppressed in failing hearts and in murine cardiac hypertrophy models. A, Western blot analysis of markers of hypertrophy (ANP and β‐MHC) and TES protein levels in healthy donors and donors with dilated cardiomyopathy (n = 4 in each group). B, Real‐time PCR of testin in human hearts (n = 4 in each group, *P < 0.05 vs normal donor heart). C, Western blot analysis β‐MHC, TES, and ANP protein levels in hypertrophic hearts from mice receiving AB (n = 4 mice in each group). D, Real‐time PCR of testin in mouse hearts (n = 4 mice in each group, *P < 0.05 vs sham). E, Immunofluorescence staining of TES and a‐actin in mouse hearts (n = 5 mice in each group). F, Western blot analysis of β‐MHC, TES, and ANP in cultivated NRVMs triggered by Ang II (1 mol/L; n = 4) or phenylephrine (PE, 100 μmol/L) for 24 h. G, Real‐time PCR of testin in NRVMs in the indicated groups (*P < 0.05 vs PBS)
Figure 2
Figure 2
TES modulated Ang II‐triggered cardiac hypertrophy ex vivo. A, TES protein levels after transduction with AdshTES or AdTES (n = 3). B, Representative images of Ang II‐stimulated cardiac muscle cells that were transduced with AdTES or AdshTES. C, Quantification of cell surface area (n = 50 cells, *P < 0.05 vs AdshRNA/PBS; # P < 0.05 vs AdshRNA/Ang II). D, Quantification of cell surface area (n = 50 cells, *P < 0.05 vs AdGFP/PBS; # P < 0.05 vs AdGFP/Ang II). E, Real‐time PCR of β‐MHC and ANP in AdshTES cells and control AdshRNA cells after supplementation with PBS or Ang II for 48 h (n = 4, *P < 0.05 vs AdshRNA/PBS; # P < 0.05 vs AdshRNA/Ang II). F, Real‐time PCR of the mRNA concentration of β‐MHC and ANP in TES overexpressing cells and control (GFP) cells after supplementation with PBS or Ang II for 48 h (n = 4, *P < 0.05 vs AdGFP/PBS; # P < 0.05 vs AdGFP/Ang II)
Figure 3
Figure 3
Overexpression of TES in the heart attenuates pressure overload‐induced hypertrophy. A, Western blot analysis was utilized to verify excessive TES expression (n = 4). GFP denotes the AVV9‐GFP groups, while TES denotes the groups with excessive expression of TES. B, Immunofluorescence staining of TES and a‐actin in mouse hearts after 8 weeks of AVV9‐GFP or AAV9‐TES injection (n = 4). C, Histological examination of HE staining and WGA staining of GFP and TES mice 8 weeks after the AB operation (n = 5‐6). D, Statistical analysis of the cardiomyocyte cross‐sectional areas (n = 100 cells). E, Statistical analysis of the LW/BW, HW/TL, and HW/BW ratios in the indicated groups (n = 11‐14). F, Echocardiographic parameters of TES as well as GFP mice (n = 9‐13). G, RTPCR of BNP, ANP, and β‐MHC expression triggered by AB in the indicated mice (n = 4). *P < 0.05 vs GFP/sham; # P < 0.05 vs GFP/AB
Figure 4
Figure 4
TES overexpression attenuated fibrosis in pressure‐overloaded hearts. A, Picrosirius red staining of histological slices of LVs in the indicated groups 8 weeks after AB (n = 6, scale bar = 50 μm). B, An image analysis system was used to quantify the fibrotic area (n = 29‐33 fields). C, qPCR of markers of fibrosis (collagen I, CTGF, and collagen III) in the indicated mice (n = 4). D and E, Representative Western blot and quantification of total and phosphorylated Smad 2 and 3 proteins in the indicated groups (n = 4).*P < 0.05 vs GFP/sham; # P < 0.05 vs GFP/AB
Figure 5
Figure 5
TES inhibited the calcineurin‐NFAT axis in murine hypertrophic hearts. A, Western blot of the total and phosphorylated protein concentrations of NFATc4, NFATc2, and NFATc1 in murine hearts in the indicated groups. B, Western blot of the total and phosphorylated protein concentration of MEK1/2, AKT, ERK1/2, P38, and JNK1/2 in murine hearts in the indicated groups. C and D, Representative Western blot and quantification of NFATc3 and MCIP1.4 protein levels in murine cytoplasm and nucleus in the indicated groups. (n = 4, *P < 0.05 vs GFP/sham; # P < 0.05 vs GFP/AB)
Figure 6
Figure 6
Mechanism of TES modulation of the calcineurin‐NFAT Axis. A, The calcineurin activity of NRVMs that were transduced with the indicated plasmids and stimulated by AngII for 30 min was evaluated. B, Immunofluorescence staining and quantitative analysis of the nuclear translocation of NFAT (n = 100 cells). C, Real‐time PCR analysis of the 1.4 isoform of the calcineurin‐interacting protein (MCIP 1.4) in mouse hearts from the indicated experimental groups (n = 6). D, A GST pull‐down assay was performed to examine the direct interaction between calcineurin and TES. E, Co‐IP assays proving the existence of an interaction between calcineurin and TES in vitro. F, Colocalization of TES and calcineurin in the cytoplasm. G, Co‐IP assays proving the existence of an interaction between calcineurin and TES in vivo. H, Co‐IP assays proving the existence of an interaction between calcineurin and TES in H9c2 cells stimulated with AngII. I, Relative luciferase activity of the NFAT promoter in NRVMs cotransduction with adeno‐associated viruses
Figure 7
Figure 7
Blocking calcineurin‐NFAT signalling blunts cardiac hypertrophy in TES knockdown mice. A, TES protein expression level in mouse hearts after 1, 2, 4, or 8 weeks of AAV9‐shTES injection (n = 4, *P < 0.05 vs AdshRNA group). B, Immunofluorescence staining of TES and a‐actin in mouse hearts after 8 weeks of AAV9‐shRNA or AAV9‐shTES injection (n = 4). C, Statistical analysis of the ratios of LW/BW, HW/TL as well as HW/BW in indicated groups (n = 11‐15). D, HE staining and WGA staining in mice 4 weeks subsequent to AB operation in indicated groups (n = 9‐11). E, Statistical analysis for cross‐sectional area (n = 100 cells). F, RTPCR of β‐MHC and ANP triggered via AB in indicated mice (n = 4). G, Echocardiographic parameters in indicated groups (n = 9‐11)

References

    1. Shimizu I, Minamino T. Physiological and pathological cardiac hypertrophy. J Mol Cell Cardiol. 2016;97:245‐262. - PubMed
    1. Heineke J, Molkentin JD. Regulation of cardiac hypertrophy by intracellular signalling pathways. Nat Rev Mol Cell Biol. 2006;7:589‐600. - PubMed
    1. Drazner MH. The progression of hypertensive heart disease. Circulation. 2011;123:327‐334. - PubMed
    1. Maron BJ, Maron MS. Hypertrophic cardiomyopathy. Lancet. 2013;381:242‐255. - PubMed
    1. Tham YK, Bernardo BC, Ooi JY, Weeks KL, McMullen JR. Pathophysiology of cardiac hypertrophy and heart failure: signaling pathways and novel therapeutic targets. Arch Toxicol. 2015;89:1401‐1438. - PubMed

Publication types

MeSH terms