

Evaluation of NSE and S100B in patients with tick-borne encephalitis
- PMID: 30468006
- PMCID: PMC6305942
- DOI: 10.1002/brb3.1160
Evaluation of NSE and S100B in patients with tick-borne encephalitis
Abstract
Introduction: The aim of this study was the assessment of neuron-specific enolase (NSE) and S-100 concentration in serum and cerebrospinal fluid (CSF) in patients with different clinical forms of tick-borne encephalitis (TBE).
Material and methods: The serum and CFS concentrations of S100B and NSE of 43 patients with TBE were measured with ELISA method using commercial kits: NSE and S100B Elisa Kit (DRG, Germany). Subjects were divided into: Group I-patients with meningoencephalitis (n = 17) and Group II-patients with meningitis (n = 26). None of the patients reported any neurodegenerative disorder that could affect the results of the study. The control group (CG) consisted of 13 patients. These patients were admitted to the hospital because of headache, and the CSF examination excluded inflammatory process. Samples were collected on admission (sample 1) and after treatment (sample 2).
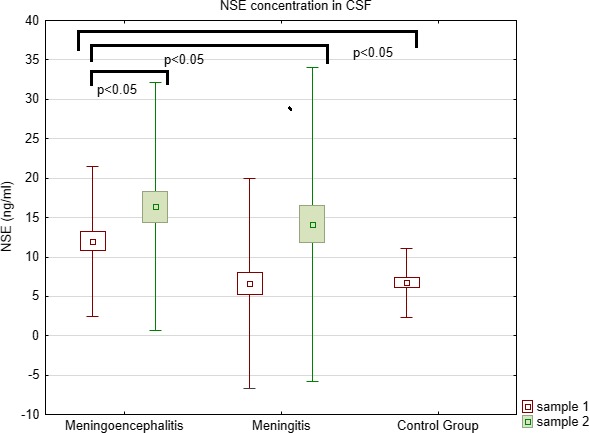
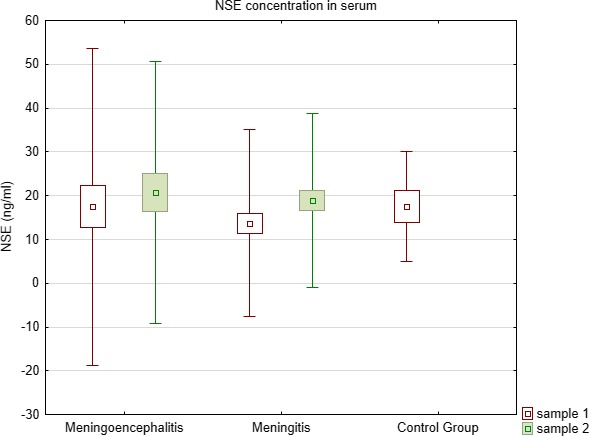
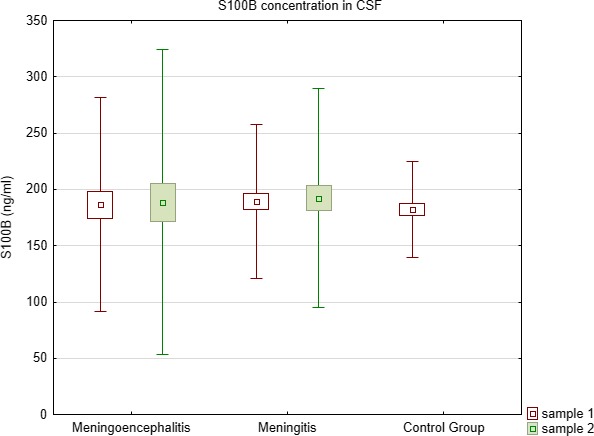
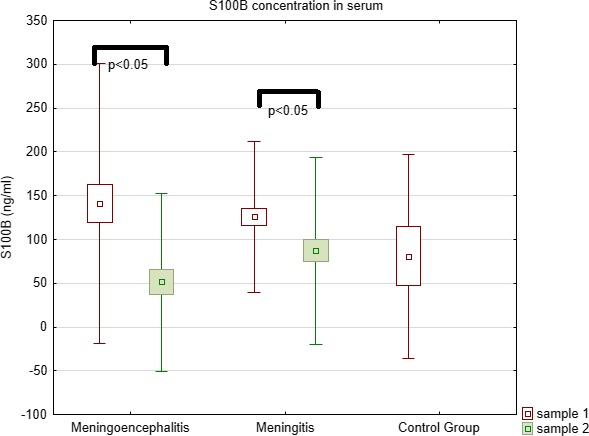
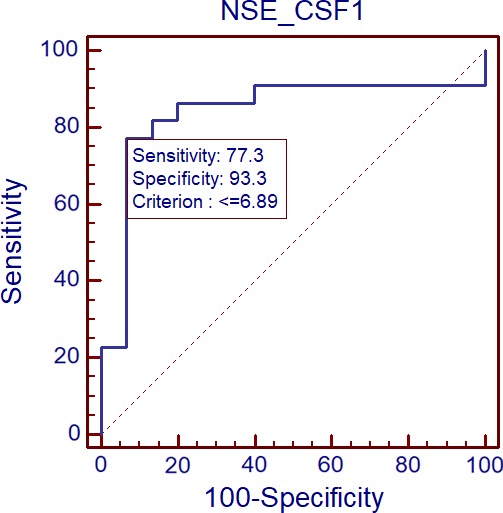
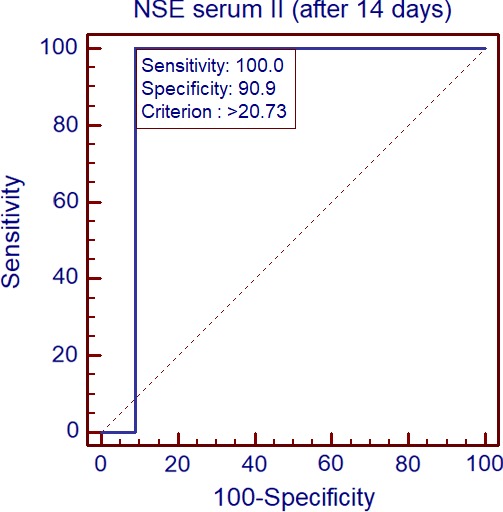
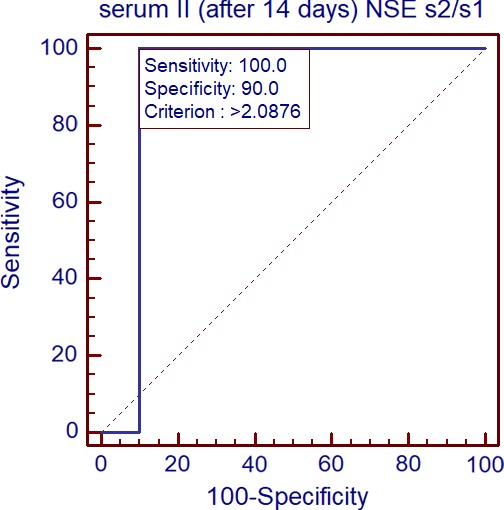
Results: Neuron-specific enolase concentration in CSF was higher in group I than in group II (p = 0.0002) and controls (p = 0.04). NSE concentration was higher in the second serum and CSF sample in both groups. S100B concentration did not differ between TBE patients and controls. NSE concentration in serum after 14 days was higher in the sequelae group (34.3 ± 9.7 vs. 16.7 ± 15, p = 0.04). Also, NSE serum sample 2/serum sample 1 ratio was significantly higher in the sequelae group (3.57 ± 0.92 vs. 1.53 ± 1.99, p = 0.04). Receiver Operating Characteristic curve analysis indicated that NSE concentration in serum II differentiates sequelae group from other meningoencephalitis patients (p = 0.0001). S100B serum sample 2/CSF sample 2 ratio was lower in the sequelae group (0.05 ± 0.1 vs. 0.37 ± 0.28, p = 0.02).
Conclusions: (a) Neurodegeneration process is present in TBE encephalitis. (b) NSE concentration correlates with inflammatory parameters in CSF in TBE. (c) Neurodegeneration is present even after clinical recovery of TBE. (d) NSE could be used in the prediction of TBE course. (e) S-100 did not differ between TBE patients and controls.
Keywords: NSE; S100B; TBE; neurodegeneration.
© 2018 The Authors. Brain and Behavior published by Wiley Periodicals, Inc.
Figures
References
-
- Bellander, B.‐M. , Olafsson, I. H. , Ghatan, P. H. , Bro Skejo, H. P. , Hansson, L.‐O. , Wanecek, M. , & Svensson, M. A. (2011). Secondary insults following traumatic brain injury enhance complement activation in the human brain and release of the tissue damage marker S100B. Acta Neurochirurgica, 153, 90–100. 10.1007/s00701-010-0737-z - DOI - PMC - PubMed
-
- Czupryna, P. , Moniuszko, A. , Pancewicz, S. A. , Grygorczuk, S. , Kondrusik, M. , & Zajkowska, J. (2011). Tick‐borne encephalitis in Poland in years 1993–2008–epidemiology and clinical presentation. A retrospective study of 687 patients. European Journal of Neurology, 18(5), 673–679. 10.1111/j.1468-1331.2010.03278.x - DOI - PubMed
Publication types
MeSH terms
Substances
LinkOut - more resources
Full Text Sources
Medical
Miscellaneous
