

Neighborhood disadvantage and chronic disease management
- PMID: 30468015
- PMCID: PMC6341202
- DOI: 10.1111/1475-6773.13092
Neighborhood disadvantage and chronic disease management
Abstract
Objective: To assess the relationship between a composite measure of neighborhood disadvantage, the Area Deprivation Index (ADI), and control of blood pressure, diabetes, and cholesterol in the Medicare Advantage (MA) population.
Data sources: Secondary analysis of 2013 Medicare Healthcare Effectiveness Data and Information Set, Medicare enrollment data, and a neighborhood disadvantage indicator.
Study design: We tested the association of neighborhood disadvantage with intermediate health outcomes. Generalized estimating equations were used to adjust for geographic and individual factors including region, sex, race/ethnicity, dual eligibility, disability, and rurality.
Data collection: Data were linked by ZIP+4, representing compact geographic areas that can be linked to Census block groups.
Principal findings: Compared with enrollees residing in the least disadvantaged neighborhoods, enrollees in the most disadvantaged neighborhoods were 5 percentage points (P < 0.05) less likely to have controlled blood pressure, 6.9 percentage points (P < 0.05) less likely to have controlled diabetes, and 9.9 percentage points (P < 0.05) less likely to have controlled cholesterol. Adjustment attenuated this relationship, but the association remained.
Conclusions: The ADI is a strong, independent predictor of diabetes and cholesterol control, a moderate predictor of blood pressure control, and could be used to track neighborhood-level disparities and to target disparities-focused interventions in the MA population.
Keywords: Medicare; geographic/spatial factors/small area variations; social determinants of health.
© 2018 The Authors. Health Services Research published by Wiley Periodicals, Inc. on behalf of Health Research and Educational Trust.
Conflict of interest statement
None.
Figures

Notes. †Neighborhood deprivation is derived from the Area Deprivation Index score, which was split into five equally sized quintiles. The most (5th) disadvantaged quintile is presented here. This map includes neighborhoods of residence for the entire study population of enrollees eligible for blood pressure, diabetes, and/or cholesterol control in 2013.
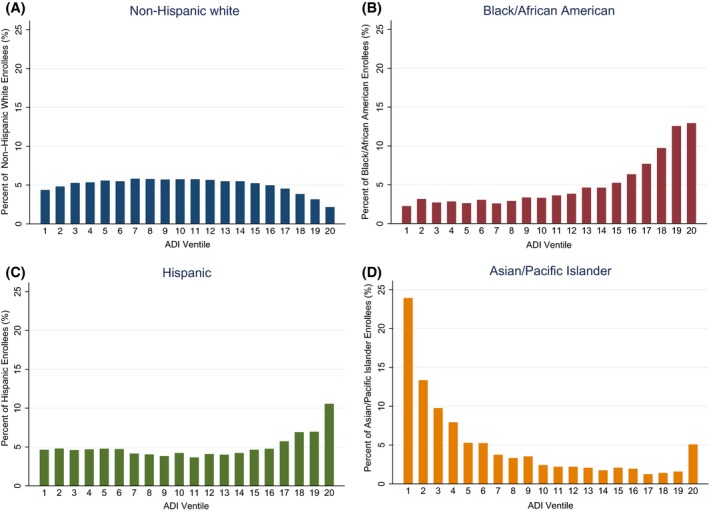
Notes. †Neighborhood deprivation is derived from the Area Deprivation Index score, which was split into 20 equally sized ventiles, representing increasing (worsening) neighborhood deprivation in 5 percent increments. Results not shown for diabetes and cholesterol control cohorts.
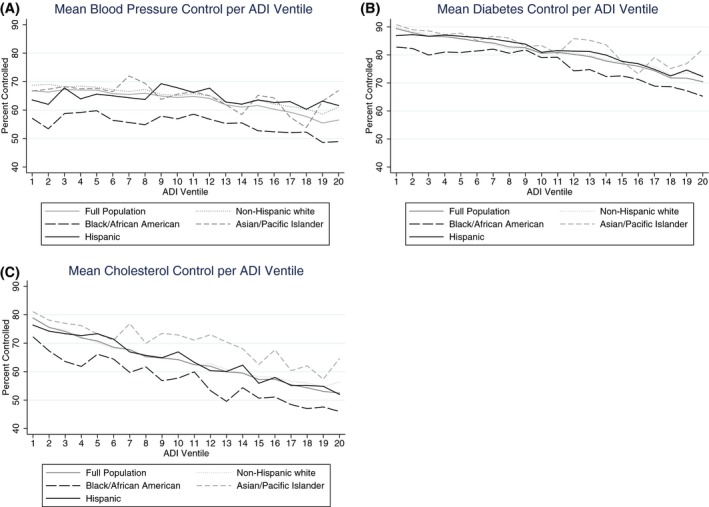
Notes. †Neighborhood deprivation is derived from the Area Deprivation Index score, which was split into 20 equally sized ventiles, representing increasing (worsening) neighborhood deprivation in 5 percent increments. Each point plots the mean outcome control for either the entire population, or one racial/ethnic group in the population, over equally sized Area Deprivation Index ventiles that were created from the full population.
References
-
- Mujahid M, Diez Roux A, Morenoff J, et al. Neighborhood characteristics and hypertension. Epidemiology. 2008;19(4):590‐598. - PubMed
-
- Johnson G, Figueroa J, Zhou X, Orav E, Jha A. Recent growth in Medicare Advantage enrollment associated with decreased fee‐for‐service spending in certain US counties. Health Aff (Millwood). 2016;35(9):1707‐1715. - PubMed
-
- Shimada S, Zaslavsky A, Zaborski L, O'Mally A, Heller A, Cleary P. Market and beneficiary characteristics associated with enrollment in Medicare managed care plans and fee‐for‐service. Med Care. 2009;47:517‐523. - PubMed
Publication types
MeSH terms
Substances
Grants and funding
- R01AG044374-01/National Institute on Aging of the National Institutes of Health/International
- P01AG027296-07S1/National Institute on Aging of the National Institutes of Health/International
- Nora Kahn Piore Award/International
- R01 AG044374/AG/NIA NIH HHS/United States
- R01 MD010243/MD/NIMHD NIH HHS/United States
LinkOut - more resources
Full Text Sources
Medical
