. 2018 Nov 30:9:451-460.
doi: 10.1016/j.isci.2018.10.028. Epub 2018 Nov 2.

Transcriptome Deconvolution of Heterogeneous Tumor Samples with Immune Infiltration

Affiliations

Transcriptome Deconvolution of Heterogeneous Tumor Samples with Immune Infiltration

Zeya Wang et al. iScience. .

Abstract

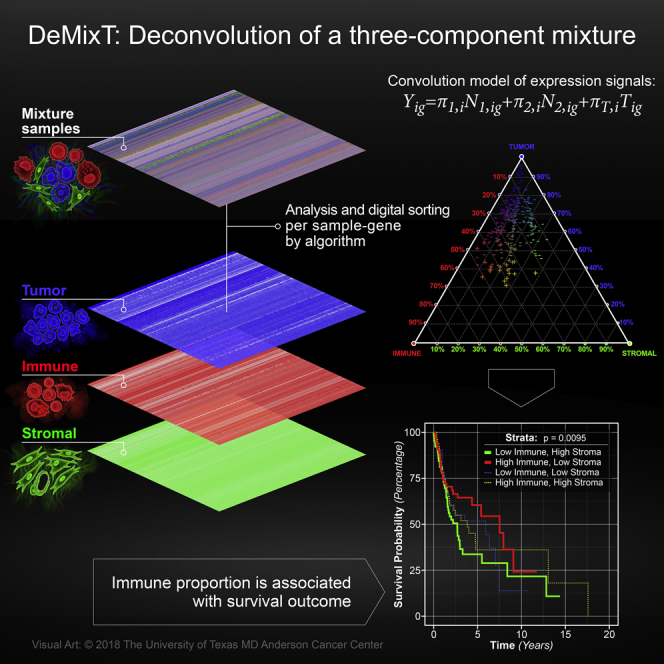
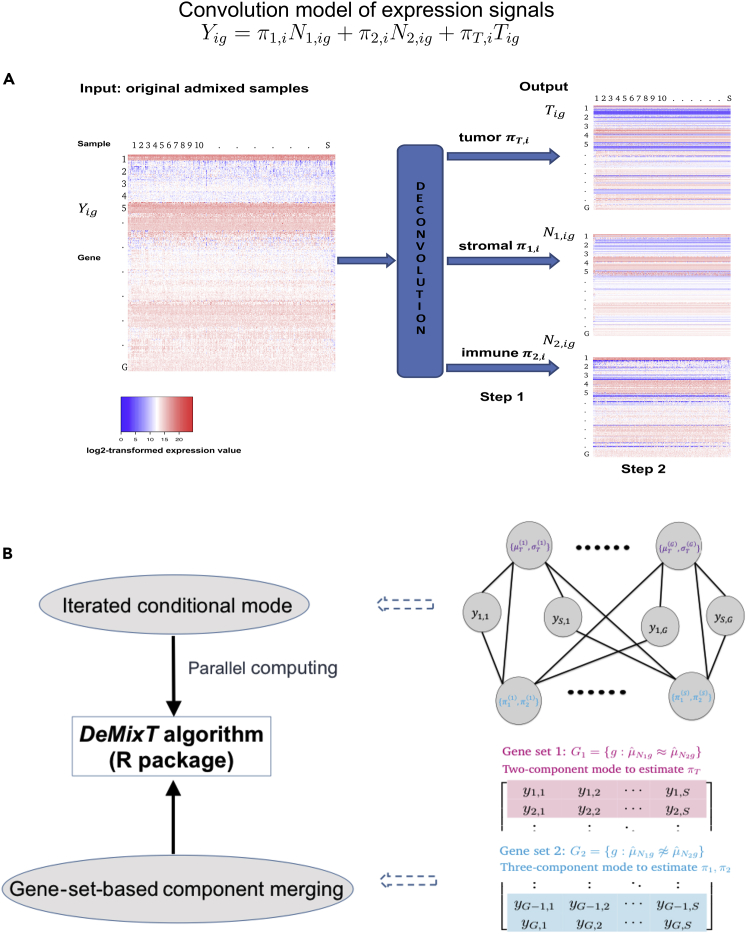
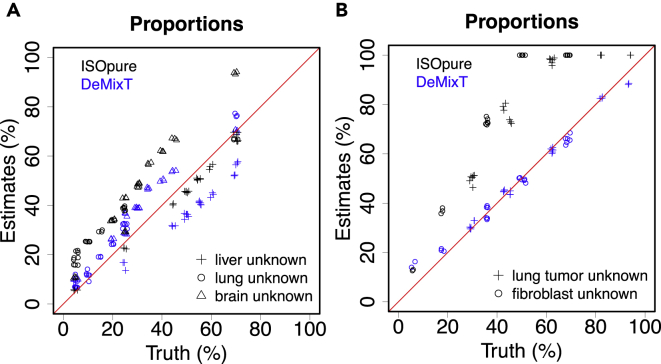
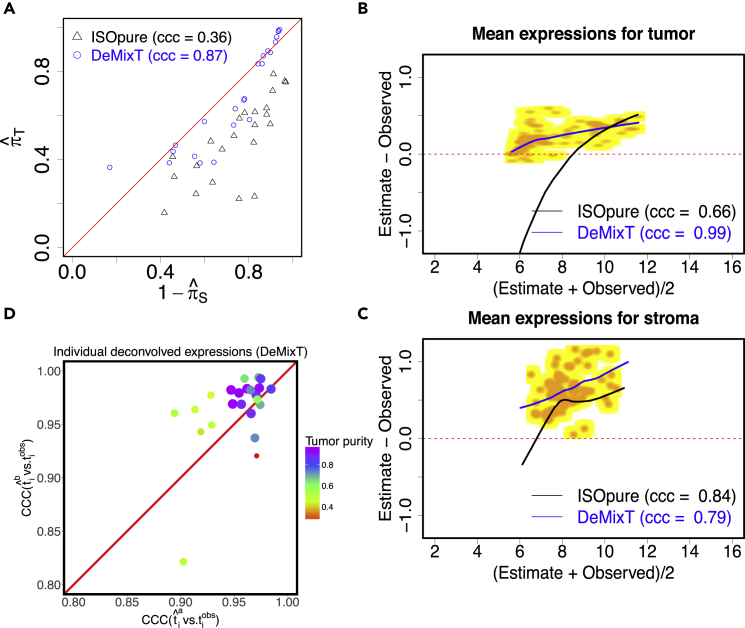
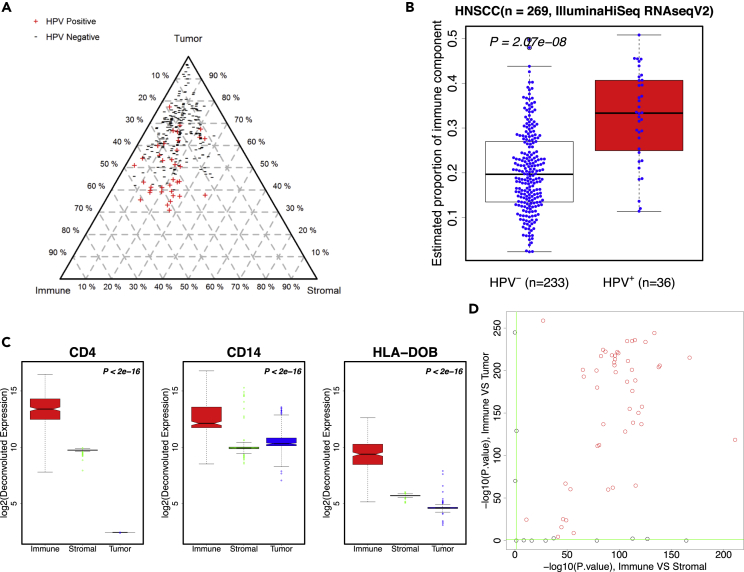
Transcriptome deconvolution in cancer and other heterogeneous tissues remains challenging. Available methods lack the ability to estimate both component-specific proportions and expression profiles for individual samples. We present DeMixT, a new tool to deconvolve high-dimensional data from mixtures of more than two components. DeMixT implements an iterated conditional mode algorithm and a novel gene-set-based component merging approach to improve accuracy. In a series of experimental validation studies and application to TCGA data, DeMixT showed high accuracy. Improved deconvolution is an important step toward linking tumor transcriptomic data with clinical outcomes. An R package, scripts, and data are available: https://github.com/wwylab/DeMixTallmaterials.

Keywords: Cancer; Computational Bioinformatics; Transcriptomics.


Figures

None
Graphical abstract
Figure 1
Figure 1
The Model and Algorithm of DeMixT (A) DeMixT performs three-component deconvolution to output tissue-specific proportions and isolated expression matrices of tumor (T-component), stromal (N1-component), and immune cells (N2-component). Heatmaps of expression levels correspond to the original admixed samples, the deconvolved tumor component, stromal component, and immune component. (B) DeMixT-based parameter estimation is achieved by using the iterated conditional modes (ICM) algorithm and a gene-set-based component merging (GSCM) approach. The top graph describes the conditional dependence between the unknown parameters, which can be assigned to two groups: genome-wise parameters (top row, red superscript) and sample-wise parameters (bottom row, blue superscript). They are connected by edges, which suggest conditional dependence. The unconnected nodes on the top row are independent of each other when conditional on those on the bottom row, and vice versa. Because of conditional independence, we implemented parallel computing to substantially increase computational efficiency. The bottom graph illustrates the GSCM approach, which first runs a two-component deconvolution on gene set G1 (red), where μˆN1gμˆN2g to estimate πT, and then runs a three-component deconvolution on gene set G2 (blue), where μˆN1gμˆN2g and πT is given by the prior step, to estimate π1 and π2.
Figure 2
Figure 2
Validation Results using Microarray and RNA-seq Data from Tissue and Cell-Line Mixture Experiments (A) Scatterplot of estimated tissue proportions versus the truth when liver (plus), brain (triangle), or lung (circle) tissue is assumed to be the unknown tissue in the microarray experiments mixing the three; estimates from ISOpure are also presented. (B) Scatterplot of estimated tissue proportions versus the truth when either lung tumor (plus) or fibroblast (circle) cell lines are assumed to be the unknown tissue in the RNA-seq experiments mixing lung tumor, fibroblast, and lymphocyte cell lines. See also Figures S4 and S6 and Tables S3–S7.
Figure 3
Figure 3
Analyses of Real Data Using DeMixT through Validation Using LCM Data in Prostate Cancer (A) Scatterplot of estimated tumor proportions versus 1- estimated stromal proportions; estimates from DeMixT (blue) are compared with those from ISOpure (black). (B) Smoothed scatter MA plots between observed and deconvolved mean expression values at the log2 scale from DeMixT for the tumor component (yellow for low values and orange for high values). The lowest smoothed curves for DeMixT are shown in blue and those for ISOpure in black. (C) Smoothed scatter MA plots between observed and deconvolved mean expression values at the Log2 scale from DeMixT for the stromal component. (D) Scatterplot of concordance correlation coefficient (CCC) between individual deconvolved expression profiles for the tumor component (tˆi) and observed values (tiobs) for 23 LCM matching prostate cancer samples. Superscript a: stromal component is represented by reference samples; b: tumor component is represented by reference samples. Color gradient and size of each point corresponds to the estimated tumor proportion.
Figure 4
Figure 4
Analyses of Real Data Using DeMixT through Application to TCGA RNA-seq Data in HNSCC (A) A triangle plot of estimated proportions (%) of the tumor component (top), the immune component (bottom left), and the stromal component (bottom right) in the HNSCC data. Points closer to a component's vertex suggests higher proportion for the corresponding component, whose quantity equals the distance between the side opposite the vertex and a parallel line (illustrated as dashed gray lines for the multiples of 10th percentile) that a point is sitting on. The “+” and “−” signs correspond to the infectious status of HPVs. (B) Boxplots of estimated immune proportions for HNSCC samples in the test set display differences between HPV+ (red) and HPV− (white) samples. (C) Boxplots of log2-transformed deconvolved expression profiles for three important immune genes (CD4, CD14, HLA-DOB) in the test set of HNSCC samples. Red: immune component; green: stromal component; blue: tumor component. P values of differential tests are at the top right corner for each gene: the first p value is for immune versus stromal component; second p value is for immune versus tumor component. (D) Scatterplot of negative log-transformed p values for comparing deconvolved expression profiles between immune component and the other two components of 63 immune cell-related genes. The x axis: immune component versus stromal component; y axis: immune component versus tumor component. Genes in red are significant in both comparisons. Green horizontal and vertical lines: cutoff value for statistical significance.

References

    1. Gong T., Szustakowski J.D. DeconRNASeq: a statistical framework for deconvolution of heterogeneous tissue samples based on mRNA-Seq data. Bioinformatics. 2013;29:1083–1085. - PubMed
    1. Ahn J., Yuan Y., Parmigiani G., Suraokar MB., Diao L., Wistuba I.I., Wang W. De Mix: deconvolution for mixed cancer transcriptomes using raw measured data. Bioinformatics. 2013;29:1865–1871. - PMC - PubMed
    1. Besag J. On the statistical analysis of dirty pictures. J. R. Stat. Soc. Series B Stat. Methodol. 1986;48:259–302.
    1. Cancer Genome Atlas Network Comprehensive genomic characterization of head and neck squamous cell carcinomas. Nature. 2015;517:576. - PMC - PubMed
    1. Dave S.S., Wright G., Tan B., Rosenwald A., Gascoyne R.D., Chan W.C., Fisher R.I., Braziel R.M., Rimsza L.M., Grogan T.M. Prediction of survival in follicular lymphoma based on molecular features of tumor-infiltrating immune cells. N. Engl. J. Med. 2004;351:2159–2169. - PubMed