. 2018 Nov 21;19(11):3684.
doi: 10.3390/ijms19113684.

Functional Biological Activity of Sorafenib as a Tumor-Treating Field Sensitizer for Glioblastoma Therapy

Affiliations

Functional Biological Activity of Sorafenib as a Tumor-Treating Field Sensitizer for Glioblastoma Therapy

Yunhui Jo et al. Int J Mol Sci. .

Abstract

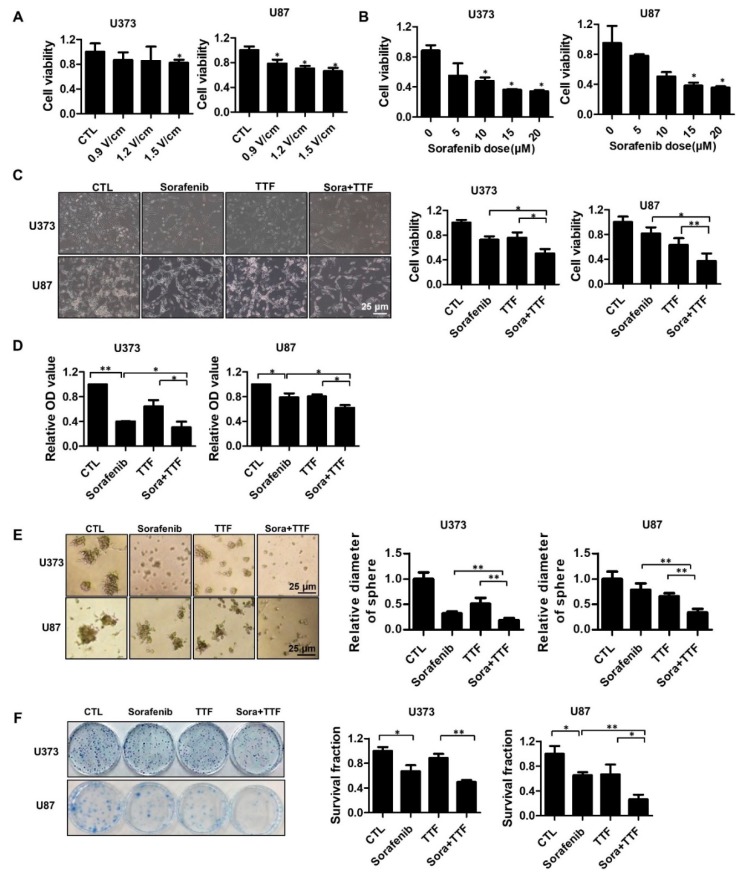
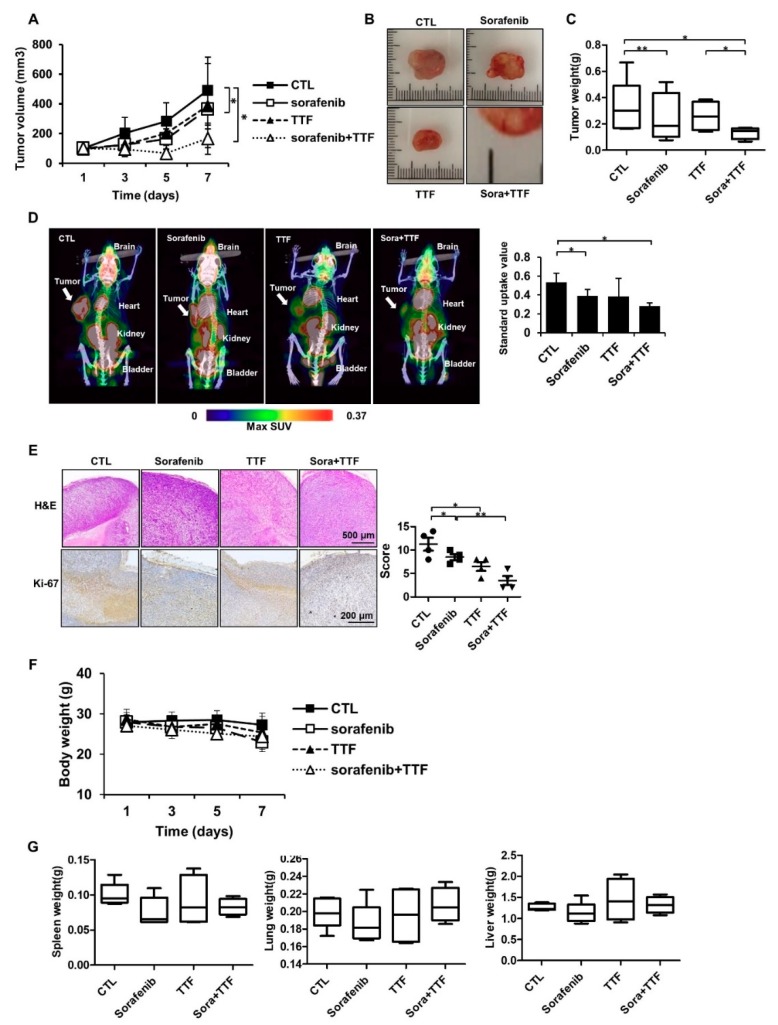
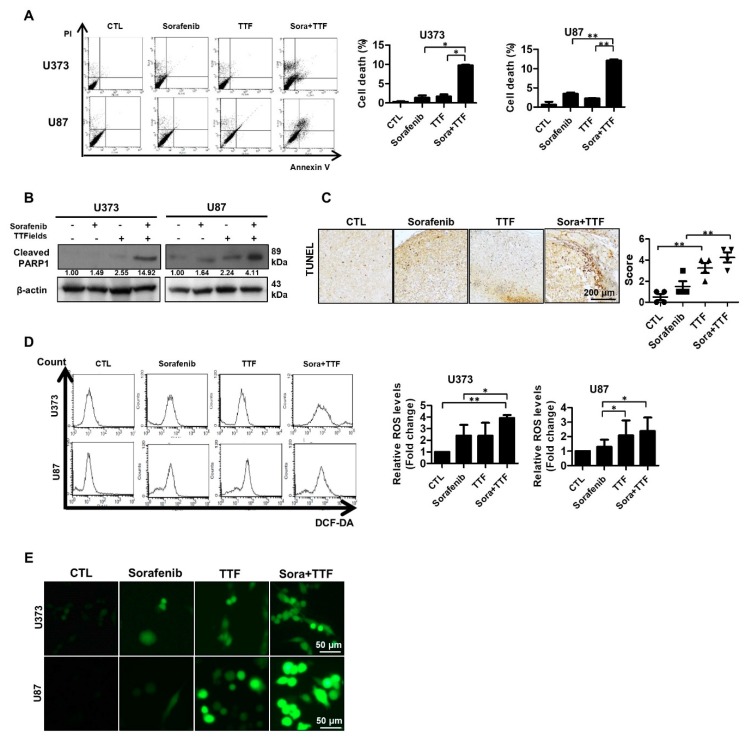
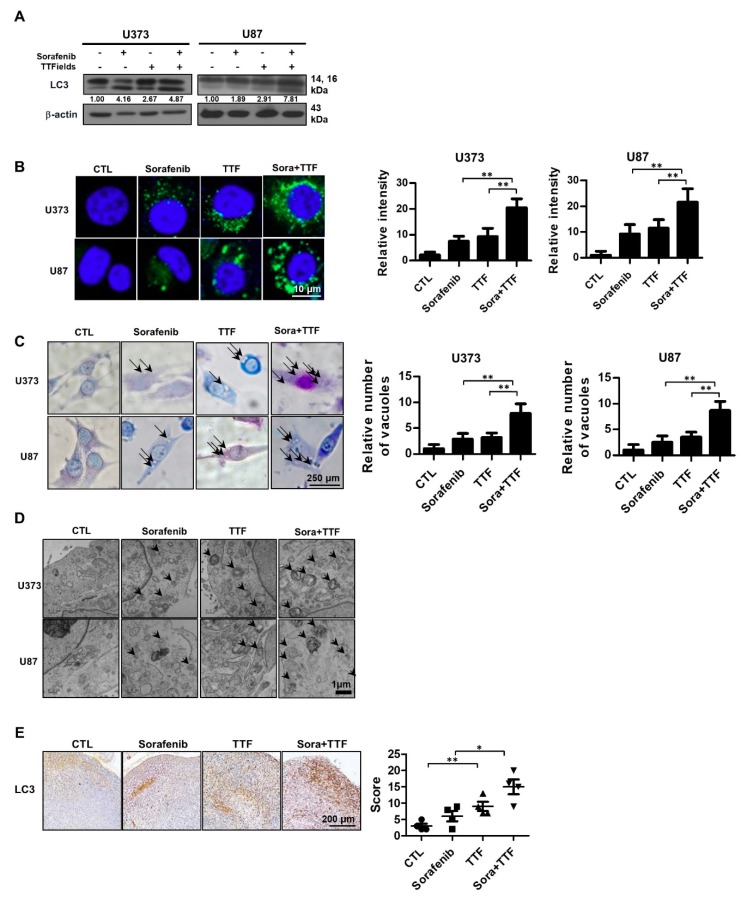
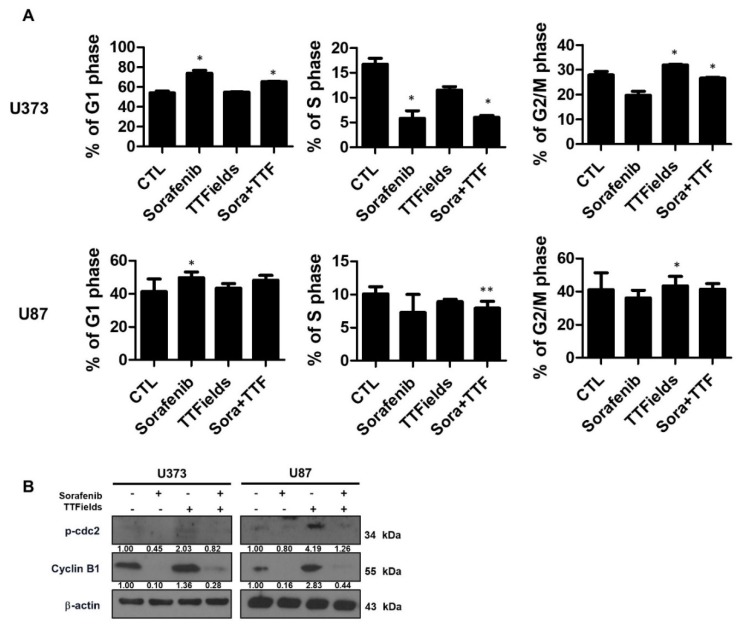
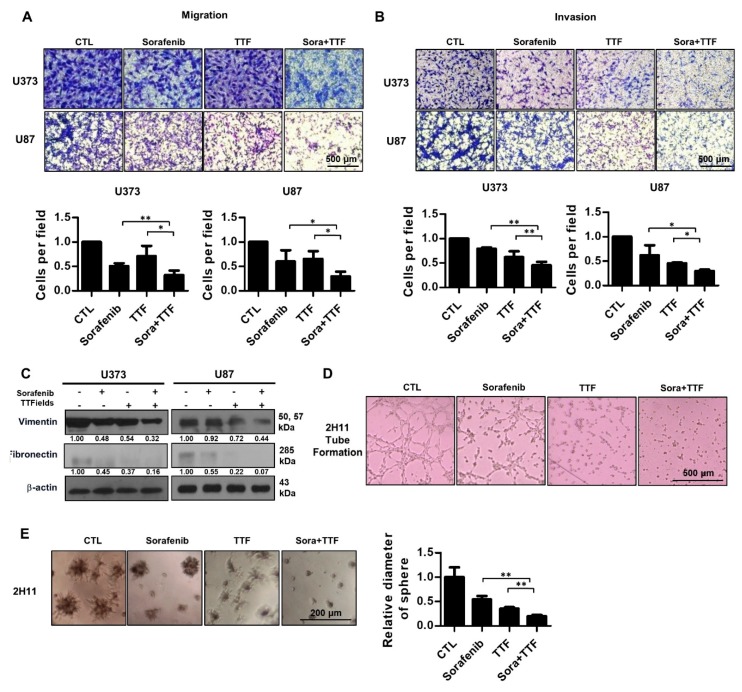
Glioblastoma, the most common primary brain tumor in adults, is an incurable malignancy with poor short-term survival and is typically treated with radiotherapy along with temozolomide. While the development of tumor-treating fields (TTFields), electric fields with alternating low and intermediate intensity has facilitated glioblastoma treatment, clinical outcomes of TTFields are reportedly inconsistent. However, combinatorial administration of chemotherapy with TTFields has proven effective for glioblastoma patients. Sorafenib, an anti-proliferative and apoptogenic agent, is used as first-line treatment for glioblastoma. This study aimed to investigate the effect of sorafenib on TTFields-induced anti-tumor and anti-angiogenesis responses in glioblastoma cells in vitro and in vivo. Sorafenib sensitized glioblastoma cells to TTFields, as evident from significantly decreased post-TTFields cell viability (p < 0.05), and combinatorial treatment with sorafenib and TTFields accelerated apoptosis via reactive oxygen species (ROS) generation, as evident from Poly (ADP-ribose) polymerase (PARP) cleavage. Furthermore, use of sorafenib plus TTFields increased autophagy, as evident from LC3 upregulation and autophagic vacuole formation. Cell cycle markers accumulated, and cells underwent a G2/M arrest, with an increased G0/G1 cell ratio. In addition, the combinatorial treatment significantly inhibited tumor cell motility and invasiveness, and angiogenesis. Our results suggest that combination therapy with sorafenib and TTFields is slightly better than each individual therapy and could potentially be used to treat glioblastoma in clinic, which requires further studies.

Keywords: glioblastoma; sorafenib; tumor-treating fields.


Conflict of interest statement

The authors declare no conflict of interest.

Figures

Figure 1
Figure 1
Tumor-treating field (TTField)-sensitizing effects of sorafenib on in vitro models of glioblastoma. (A) TTFields inhibited glioblastoma cell viability in an intensity-dependent manner. Cell viability was evaluated by cell counting using 0.4% Trypan Blue stain for U373 and U87 cells treated with TTFields for the indicated durations; * p < 0.05; (B) sorafenib inhibited glioblastoma cell Fluorine-18viability in a dose-dependent manner. Cell viability was evaluated by cell counting using 0.4% Trypan Blue stain for U373 and U87 cells treated with the indicated doses of sorafenib; * p < 0.05. (CE) the viability of cells treated with a combination of TTFields and sorafenib was significantly lower than that of cells treated with either sorafenib or TTFields. The proliferation rate was detected by counting (C), MTT assay (D), and 3D colony culture (E). * p < 0.05; ** p < 0.01; (F) the sensitivity of U373 and U87 cells treated with sorafenib and TTFields was measured via a colony formation assay. The survival fraction, which was expressed as a function of the irradiation dose, was calculated as follows: survival fraction = colonies counted/(cells seeded × plating efficiency/100). * p < 0.05; ** p < 0.01. CTL: Control group; TTF: Tumor treating fields group.
Figure 2
Figure 2
Tumor-treating field (TTField)-sensitizing effects of sorafenib on glioblastoma in vivo. (A) Nude mice were inoculated with U373 cells and treated with TTFields, sorafenib, or a combination thereof. Tumor volumes were measured at the indicated time points, using the formula: volume = (length × width2 × 3.14)/6 (n = 8); * p < 0.05; (B) images of tumors isolated from control- or TTFields-treated mice, n = 4, Sora: sorafenib.; bar = 1 cm (C) tumors were excised and weighed at the end of the experiment (seven days). * p < 0.05; ** p < 0.01; (D) representative PET/CT images of U373 tumor-bearing mice after injection of [18F]-fluorodeoxyglucose (FDG). The radioactivity of [18F]-FDG in tumors is presented as the maximum standard uptake value (mean ± SD). * p < 0.05; SUV: Standard uptake value. (E) hematoxylin and eosin (H&E) staining and Ki-67 expression was examined by immunohistochemistry. * p < 0.05; ** p < 0.01, n = 4; Solid circle: Control; Solid square: Sorafenib; Triangle: Tumor treating fields; Inverted triangle: Sorafenib+TTF. (F) the body weights of the mice were not significantly different among the sorafenib-, TTFields-, and combination-treated groups, n = 4; (G) the spleen, liver, and lung tissues of the mice were excised and weighed at the end of the experiment (seven days), n = 4.
Figure 3
Figure 3
Effects of sorafenib and tumor-treating fields (TTFields) on apoptosis in glioblastoma cells. (A) U373 and U87 cells were exposed to sorafenib (5 µmol/L) and/or TTFields for 48 h prior to annexin V/PI staining; (B) cell lysates (30 µg) were immunoblotted with antibodies against cleaved PARP1 and β-actin; Band intensities were quantified and normalized to actin intensities (n = 3, mean ± SD). (C) terminal deoxynucleotide transferase-mediated dUTP nick-end labeling assays were performed using xenografts, n = 4; Solid circle: Control; Solid square: Sorafenib; Triangle: Tumor treating fields; Inverted triangle: Sorafenib+TTF. (D,E) U373 and U87 cells were treated with sorafenib, TTFields, or the indicated combinations, and reactive oxygen species (ROS) levels were determined using 2′,7′-dichlorofluorescein diacetate (a peroxide-sensitive dye), flow cytometry, and confocal laser fluorescence microscopy. Data are expressed as % of control and are means ± SD from 3 experiments. * p < 0.05; ** p < 0.01.
Figure 4
Figure 4
Combinatorial treatment with sorafenib and tumor-treating fields (TTFields) induces autophagy in glioblastoma cancer cells. (A) cell lysates (30 µg) were immunoblotted with anti-LC3 and anti-β-actin antibodies; Band intensities were quantified and normalized to actin intensities (n = 3, mean ± SD). (B) cyto-ID staining of U373 and U87 cells with and without sorafenib or with and without TTFields treatment. ** p < 0.01; (C) cells were stained with Giemsa stain (10% in phosphate-buffered saline), washed, and imaged using a Leica DM IRB light microscope (magnification, 40×). Black arrows indicate vacuoles. ** p < 0.01; (D) autophagy was assessed by transmission electron microscopy in cells, bar = 1 µm; black arrow: autophagic vacuoles. (E) LC3 expression in xenografts was examined by immunohistochemistry. Representative images are presented. * p < 0.05; ** p < 0.01; n = 4; Solid circle: Control; Solid square: Sorafenib; Triangle: Tumor treating fields; Inverted triangle: Sorafenib+TTF.
Figure 5
Figure 5
Sorafenib plus tumor-treating fields (TTFields) inhibits cell cycle progression in glioblastoma cells. (A) U373 and U87 cells were treated with sorafenib (5 µmol/L) and/or 0.9 V/cm TTFields for 24 h. Cell cycle distribution was analyzed quantitatively by flow cytometry. * p < 0.05; ** p < 0.01; (B) phospho-cdc2 and cyclin B1 expression was analyzed by Western blotting. β-Actin served as a loading control. Equal amounts of cell lysate (30 µg) were electrophoresed and analyzed; Band intensities were quantified and normalized to actin intensities (n = 3, mean ± SD).
Figure 6
Figure 6
Effect of combinatorial treatment with Sorafenib and tumor-treating fields (TTFields) on the invasiveness and migration of glioblastoma cells. (A) tumor cell migration was assessed using a Transwell chamber assay. * p < 0.05; ** p < 0.01, bar = 500 µm; (B) tumor cell invasion was assessed using a Matrigel invasion assay. * p < 0.05; ** p < 0.01, bar = 500 µm; (C) cell lysates prepared from sorafenib-, TTFields-, and sorafenib plus TTFields-treated cells were used in Western blotting using antibodies against vimentin and fibronectin; Band intensities were quantified and normalized to actin intensities (n = 3, mean ± SD). (D) tube formation assay using 2H11 cells subjected to the indicated treatments; (E) 3D colony cultures of 2H11 cells treated as indicated. ** p < 0.01.

References

    1. Stupp R., Mason W.P., Van Den Bent M.J., Weller M., Fisher B., Taphoorn M.J., Belanger K., Brandes A.A., Marosi C., Bogdahn U. Radiotherapy plus concomitant and adjuvant temozolomide for glioblastoma. New Engl. J. Med. 2005;352:987–996. doi: 10.1056/NEJMoa043330. - DOI - PubMed
    1. Hainsworth J.D., Ervin T., Friedman E., Priego V., Murphy P.B., Clark B.L., Lamar R.E. Concurrent radiotherapy and temozolomide followed by temozolomide and sorafenib in the first-line treatment of patients with glioblastoma multiforme. Cancer. 2010;116:3663–3669. doi: 10.1002/cncr.25275. - DOI - PubMed
    1. Bleehen N., Stenning S. A Medical Research Council trial of two radiotherapy doses in the treatment of grades 3 and 4 astrocytoma. Bri. J. Cancer. 1991;64:769. doi: 10.1038/bjc.1991.396. - DOI - PMC - PubMed
    1. Levin V., Leibel S., Gutin P. Neoplasms of the central nervous system in Cancer: Principles and Practice of Oncology. 6th ed. Lippincott Williams and Wilkins; Philadelphia, PA, USA: 2001. pp. 2100–2160.
    1. Barbagallo G.M., Paratore S., Caltabiano R., Palmucci S., Parra H.S., Privitera G., Motta F., Lanzafame S., Scaglione G., Longo A. Long-term therapy with temozolomide is a feasible option for newly diagnosed glioblastoma: A single-institution experience with as many as 101 temozolomide cycles. Neurosurg. Focus. 2014;37:E4. doi: 10.3171/2014.9.FOCUS14502. - DOI - PubMed

MeSH terms