. 2018 Nov 23;6(1):127.
doi: 10.1186/s40478-018-0635-9.

Tonic ATP-mediated growth suppression in peripheral nerve glia requires arrestin-PP2 and is evaded in NF1

Affiliations

Tonic ATP-mediated growth suppression in peripheral nerve glia requires arrestin-PP2 and is evaded in NF1

Robert A Coover et al. Acta Neuropathol Commun. .

Abstract

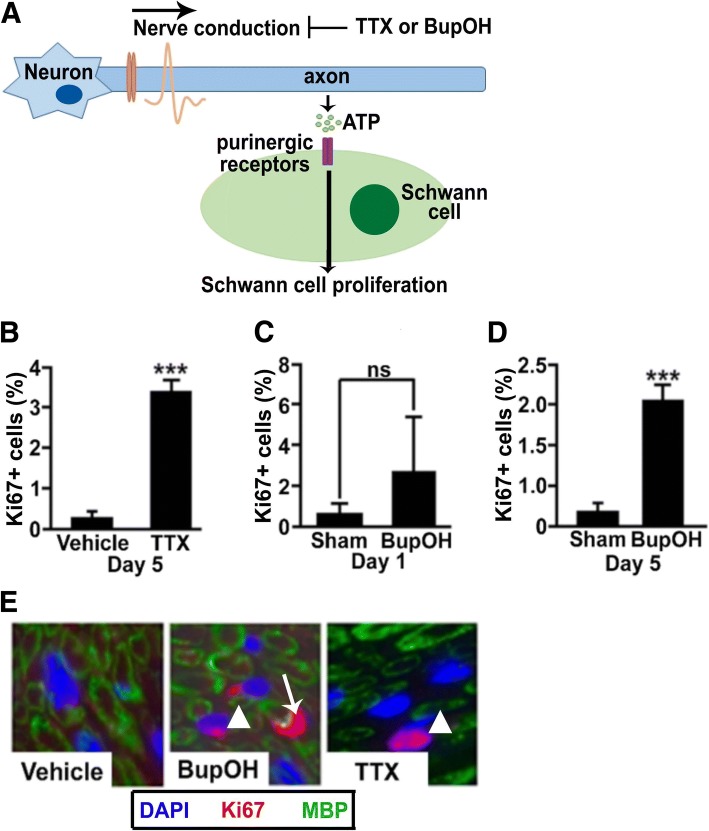
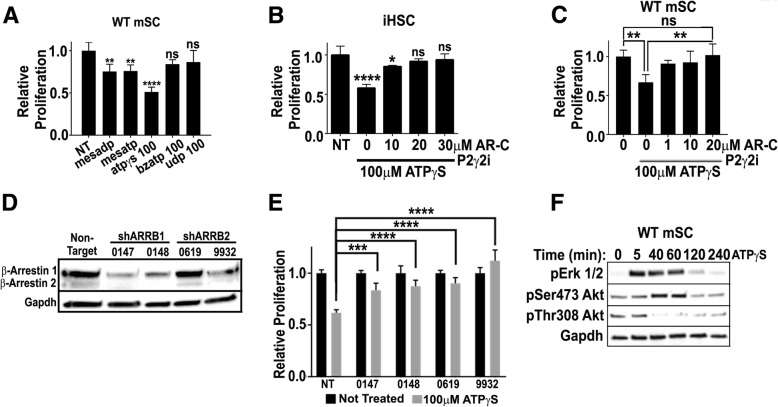
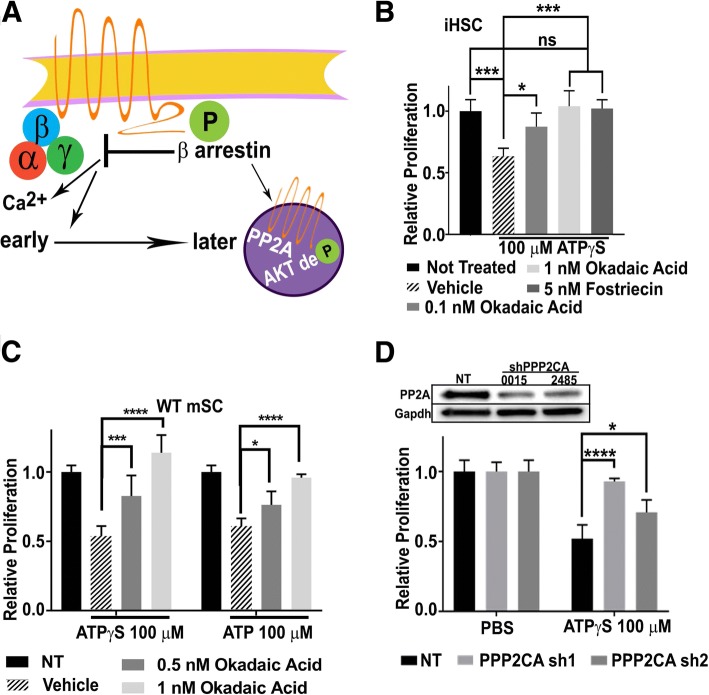
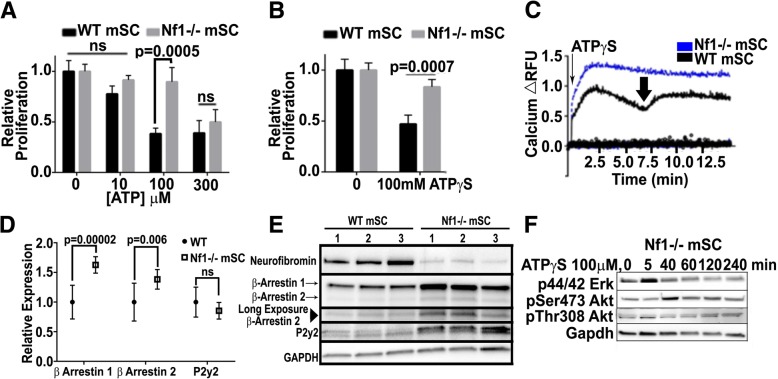
Normal Schwann cells (SCs) are quiescent in adult nerves, when ATP is released from the nerve in an activity dependent manner. We find that suppressing nerve activity in adult nerves causes SC to enter the cell cycle. In vitro, ATP activates the SC G-protein coupled receptor (GPCR) P2Y2. Downstream of P2Y2, β-arrestin-mediated signaling results in PP2-mediated de-phosphorylation of AKT, and PP2 activity is required for SC growth suppression. NF1 deficient SC show reduced growth suppression by ATP, and are resistant to the effects of β-arrestin-mediated signaling, including PP2-mediated de-phosphorylation of AKT. In patients with the disorder Neurofibromatosis type 1, NF1 mutant SCs proliferate and form SC tumors called neurofibromas. Elevating ATP levels in vivo reduced neurofibroma cell proliferation. Thus, the low proliferation characteristic of differentiated adult peripheral nerve may require ongoing, nerve activity-dependent, ATP. Additionally, we identify a mechanism through which NF1 SCs may evade growth suppression in nerve tumors.

Keywords: AKT; ATP; Arrestin; Glia; Neurofibromatosis; P2Y2; PP2A; Purinergic; Schwann.


Conflict of interest statement

Competing interests

The authors declare that they have no competing interests.

Publisher’s Note

Springer Nature remains neutral with regard to jurisdictional claims in published maps and institutional affiliations.

Figures

Fig. 1
Fig. 1
Nerve conduction controls Schwann cell quiescence in adult nerve. (a) Nerve electrical conduction correlates with axonal release of ATP. TTX and BupOH inhibit nerve conduction-mediated ATP release. (b) At Day 5, TTX-blocked WT adult sciatic nerves contained increased proliferating (Ki67+) cells (n = 7/group, p < 0.001). (c) No significant increase in Ki67+ cells was observed at 24 h of BupOH treatment (ns; n = 5/group), while (d) at 5 days of BupOH administration Ki67+ cells increased (n = 6/group, p < 0.001). (e) Cross sections of BupOH and TTX treated sciatic nerves were labeled with anti-myelin basic protein (MBP; green) and Ki67 (red). Cell nuclei are blue. Some Ki67+ nuclei are adjacent to MBP+ myelin sheaths (white arrow), while others were not (arrowheads)
Fig. 2
Fig. 2
ATP is required to suppress proliferation of mature SC. (a) Apyrase, which degrades ATP, was administered every 4 h for 36 h IM. This resulted in increased Ki67+ cells compared to inactivated apyrase controls (n = 5active/6inactive P < 0.0001). (b) In tissue sections, EdU+ Krox20+ cells were present after Apyrase treatment, and many were associated with MBP+ myelin sheaths (b, c) and S100+ myelinating Schwann cell cytoplasm (scale bar = 3 μm) (c). In c, the EdU+ SC nucleus (white) adjacent to S100+ SC cytoplasm, appears to be in telophase. (d) Animals treated twice daily with EdU during 4 days of BupOH exposure and analyzed on Day 4 showed increased EdU+ cells over sham (n = 4/group < 0.01). Animals from this cohort that were sacrificed 3 days after the final dose of EdU (Day 7) showed fewer EdU+ cells (p < 0.05). (e) Broad identification of the total EdU counts reflected from the experiments represented as a percentage of total EdU. (f) Percentage of total EdU+ cells that co labeled with Krox20. (g) Percentage of total Edu + cells that co labeled with Iba1. (h) Confocal images of teased nerves from BupOH treated mice, top shows an EdU+ cell closely associated with an MBP+ myelin sheath and S100+ cytoplasm; bottom shows an EdU+;S100β + cell apparently separating from an adjacent MBP+ fiber
Fig. 3
Fig. 3
ATP-P2Y2 suppresses SC proliferation by modulating PP2A activity. (a) WT mSC were treated with non-hydrolysable purine analogues; ATPγS had the most significant effect on SC growth (p < 0.0001). (b) iHSC growth was suppressed by ATPγS and rescued by the P2Y2 antagonist AR-C 118925XX (AR-C). (c) WT mSC growth suppression by ATPγS was rescued by AR-C. (d) Western blot confirms reduced ARRB1 and ARRB2 protein by shRNA knockdown. (e) iHSCs treated with shRNA ARRB1 and 2 shown reduced growth suppression in response to ATPγS. (f) Western blots of WT mSCs lysates after ATPγS treatment show increases in pERK 1/2 and pSer473 Akt. A decrease in pThr308 AKT was observed by 40 min
Fig. 4
Fig. 4
ATP requires β-arrestins to suppress SC proliferation. (a) Schematic representation of known G-protein-dependent calcium signaling and delayed G-protein-independent arrestin signaling. (b) Growth with PP2A inhibitors okadaic acid or Forstrecin rescue the anti-proliferative effects of ATPγS. (c) Growth suppression of WT mSCs by ATP or ATPγS was also rescued by okadaic acid. (d) iHSCs treated with shRNA to PPP2CA show reduced growth suppression in response to ATPγS
Fig. 5
Fig. 5
ATP is growth suppressive in neurofibroma. (a) Daily administration of ATP (1 mg/g/day; I.P.) for 5d reduced cell proliferation. (b) ATP (50 mg/kg/day; I.P.) was administered from 1 to 6 mo. of age. Representative dissections of GEM-spinal cords with attached nerves and tumors in vehicle (PBS) and ATP-treated (ATP, right) littermate. Tumors are highlighted with red circles. (c) The diameter of tumors, measured at the widest portion parallel to the spinal cord, was reduced in the ATP treated versus vehicle (p = 0.0064). (d) Tumor number was also reduced (p = 0.0405). (e) Total percentage of EdU+ nuclei in PBS or ATP treated tumor bearing mice. (f) Proportion of EdU+ cells that co-labeled with the hematopoietic marker CD45. (g) Proportion of EdU+ cells that co-labeled with the SC marker Sox10. (h) Representative images from TUNEL assay, no difference observed. (i) Representative H&E staining of tumors from each cohort
Fig. 6
Fig. 6
Nf1 deficient SCs are resistant to ATP-dependent growth suppression via arrestins. (a) ATP (100 μM) suppresses WT mSC proliferation; Nf1 −/− mSCs are resistant (p = 0.0005). (b) Non-hydrolyzable ATPγS shows that differential growth suppression in WT versus Nf1−/− mSCs is due to ATP, not breakdown products (p = 0.0007). (c) Calcium signaling in response to ATPγS differs in WT versus Nf1−/− mSCs. Nf1−/− mSCs (blue line) lack the dip in calcium at ~ 7 min which is characteristic in WT mSCs (black line, arrow). (d) qRTPCR analysis of the arrestins and P2Y2 between littermate matched pairs (n = 3/3), both arrestins were upregulated in the Nf1−/− setting; however, P2y2 RNA levels were unchanged. (e) Western blot analysis of arrestin and P2y2 levels in WT and KO mSCs, littermate matched pairs (n = 3/3) (f) After ATPγS treatment, western blot in Nf1−/− mSCs show increases in pERK 1/2 and pSer473 Akt at early time points, similar to but reduced from WT mSCs. No decrease in pThr308 Akt was observed
Fig. 7
Fig. 7
Model of ATP-dependent growth suppression in normal and Nf1 deficient SC. (a) Western blot from ATPγS-treated wt mSCs or (b) Nf1 −/− mSCs (1 h) with vehicle (veh; PBS) or inhibitors (Meki = PD0325901901, P2y2i = AR-C, Arrestini = barbadin, PP2i = Okadaic acid). Nf1 −/− mSCs fail to decrease pERK or pAkt in response to barbadin. (c) ATP binds to the P2y2 receptor, causing phosphorylation and recruitment of β-arrestin(s). The β-arrestin(s) form complexes; one results in the activation of Erk. A second complex contains PP2A, which de-phosphorylates Akt, correlating with growth suppression. (D) When Nf1 is inactivated ATP no longer potently suppresses SC growth. Signaling at the level of the P2Y2 receptor occurs normally, as evidenced by increased calcium on ATP stimulation. NF1−/− SC do not show the transient decrease in calcium characteristic of β-arrestin mediated suppression of G-protein-mediated signaling, or decrease phosphorylation of pThr308AKT

References

    1. Anastasaki C, Gutmann DH. Neuronal NF1/RAS regulation of cyclic AMP requires atypical PKC activation. Hum Mol Genet. 2014;23(25):6712–21. doi: 10.1093/hmg/ddu389. - DOI - PMC - PubMed
    1. Antonioli L, Blandizzi C, Pacher P, Haskó G. Immunity, inflammation and cancer: a leading role for adenosine. Nat Rev Cancer. 2013;13(12):842–857. doi: 10.1038/nrc3613. - DOI - PubMed
    1. Atanasoski S, Notterpek L, Lee H-Y, Castagner F, Young P, Ehrengruber MU, Meijer D, Sommer L, Stavnezer E, Colmenares C. The protooncogene ski controls Schwann cell proliferation and myelination. Neuron. 2004;43(4):499–511. doi: 10.1016/j.neuron.2004.08.001. - DOI - PubMed
    1. Bagchi S, Liao Z, Gonzalez FA, Chorna NE, Seye CI, Weisman GA, Erb L. The P2Y2 nucleotide receptor interacts with αv integrins to activate go and induce cell migration. J Biol Chem. 2005;280(47):39050–39057. doi: 10.1074/jbc.M504819200. - DOI - PubMed
    1. Beaulieu JM, Marion S, Rodriguiz RM, Medvedev IO, Sotnikova TD, Ghisi V, Wetsel WC, Lefkowitz RJ, Gainetdinov RR, Caron MG. A beta-arrestin 2 signaling complex mediates lithium action on behavior. Cell. 2008;132(1):125–136. doi: 10.1016/j.cell.2007.11.041. - DOI - PubMed

Publication types

MeSH terms