. 2018 Dec 3;215(12):3075-3093.
doi: 10.1084/jem.20180818. Epub 2018 Nov 23.

Bone marrow-derived fibroblasts are a functionally distinct stromal cell population in breast cancer

Affiliations

Bone marrow-derived fibroblasts are a functionally distinct stromal cell population in breast cancer

Yael Raz et al. J Exp Med. .

Abstract

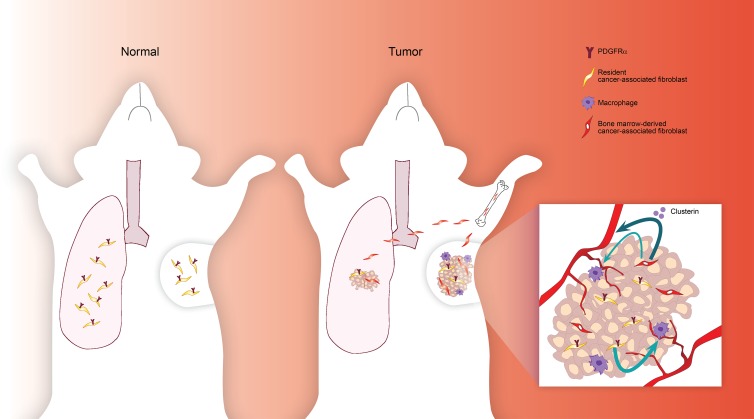
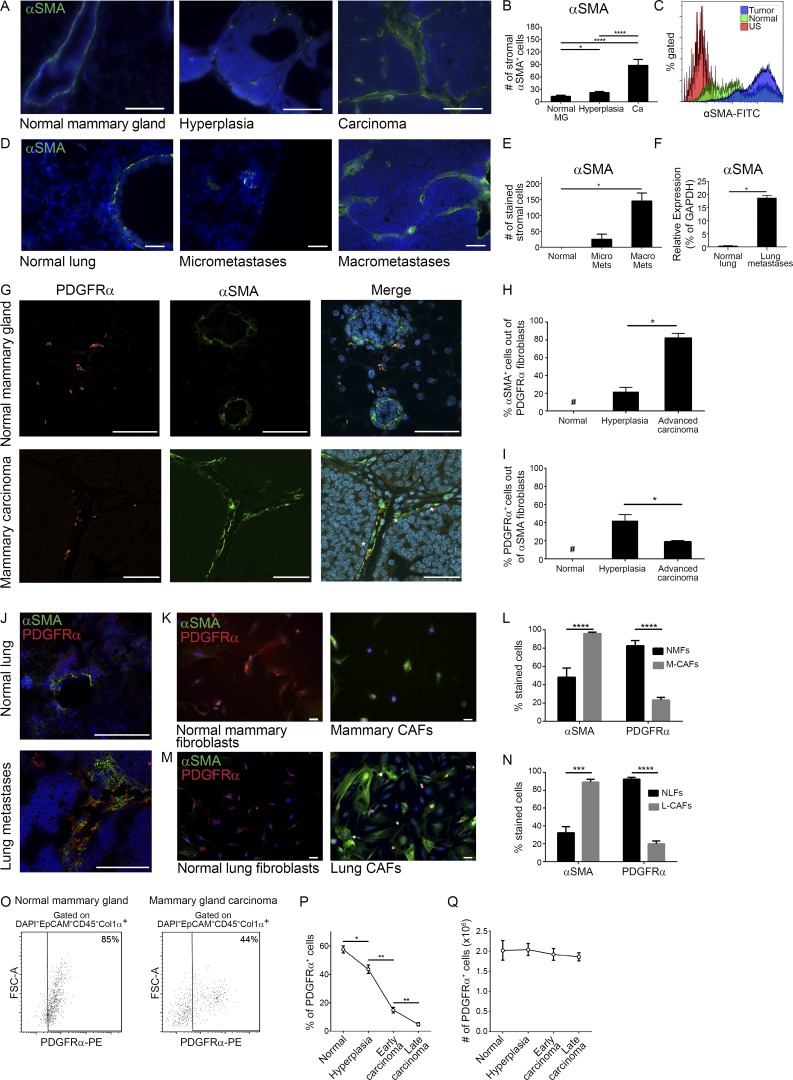
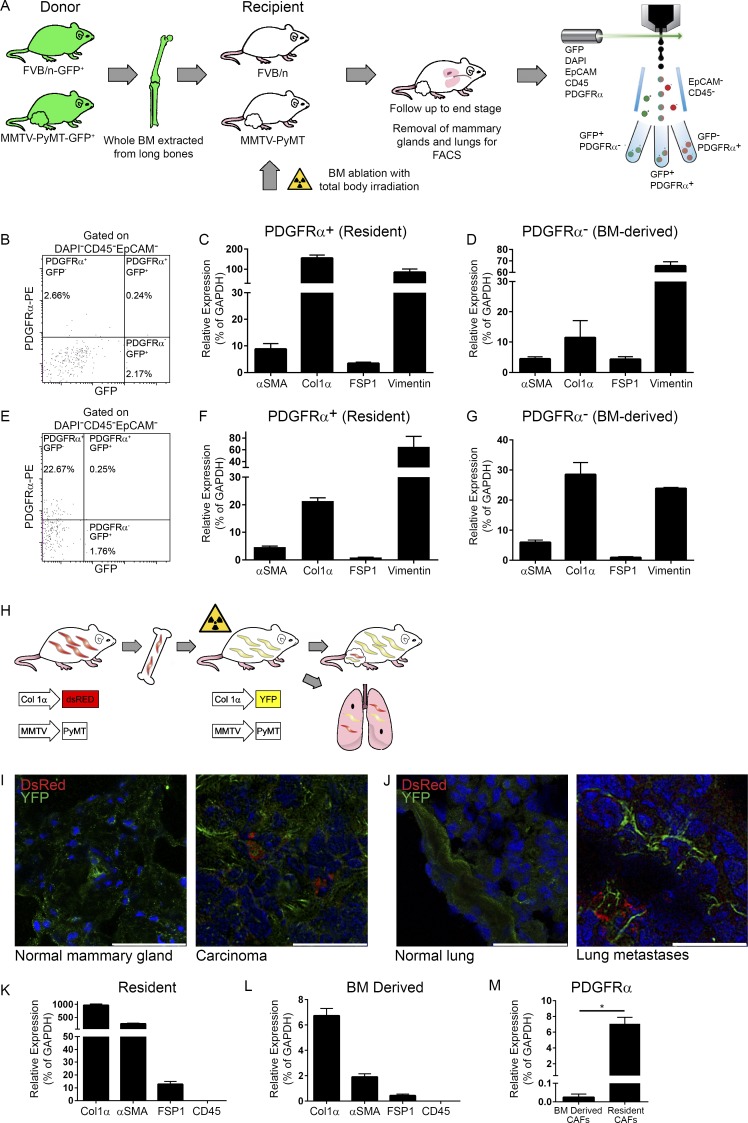
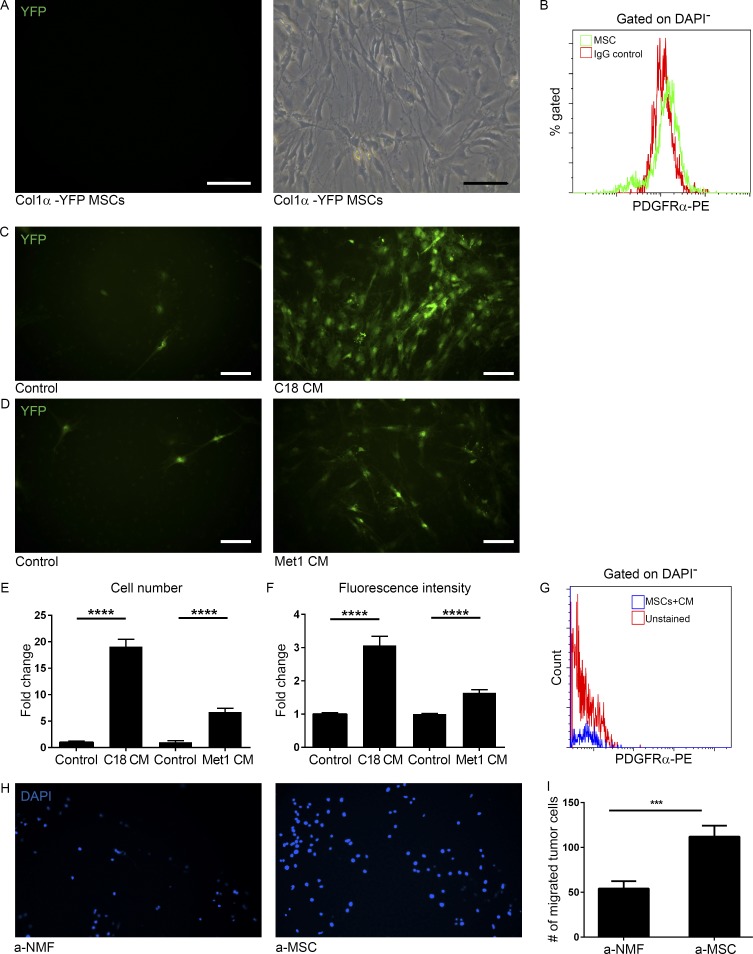
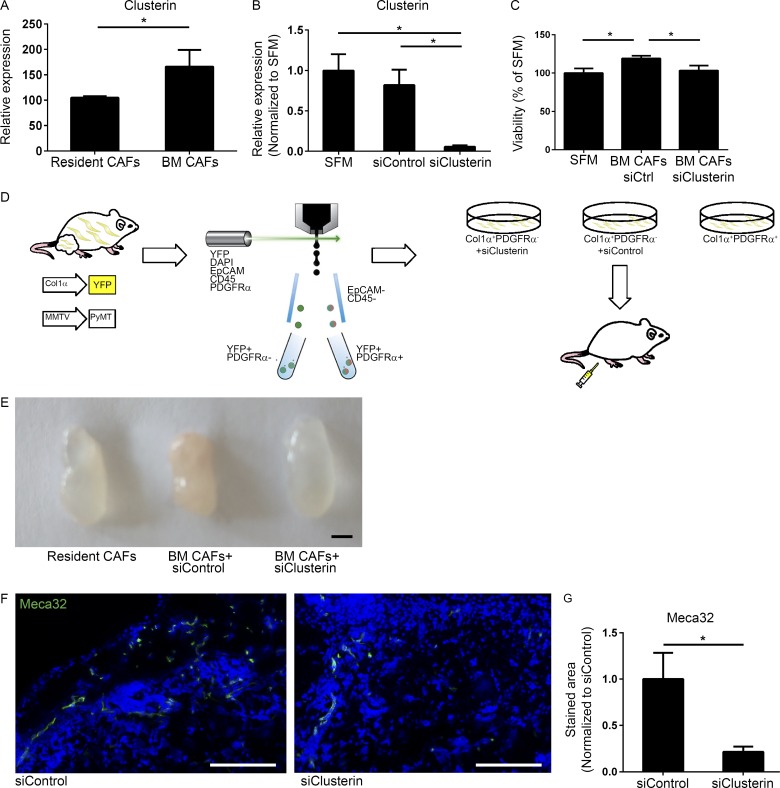
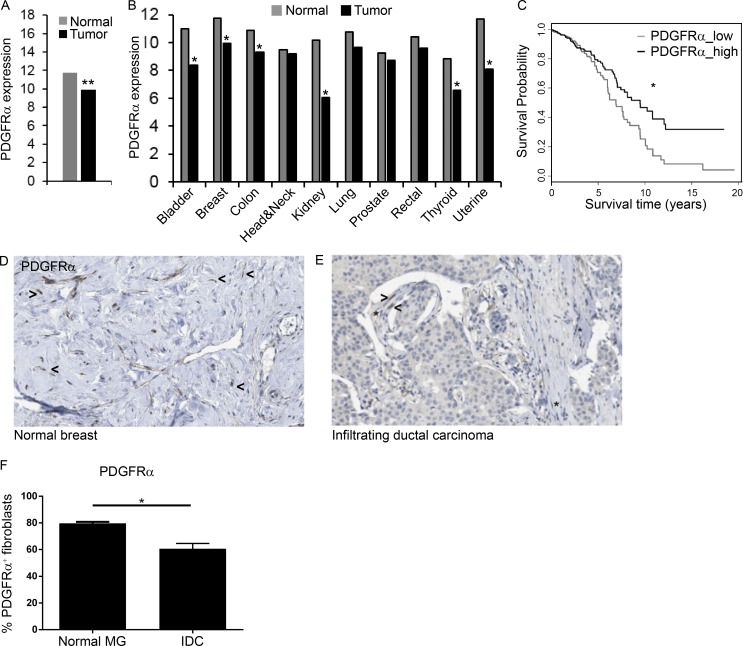
Cancer-associated fibroblasts (CAFs) are highly prominent in breast tumors, but their functional heterogeneity and origin are still largely unresolved. We report that bone marrow (BM)-derived mesenchymal stromal cells (MSCs) are recruited to primary breast tumors and to lung metastases and differentiate to a distinct subpopulation of CAFs. We show that BM-derived CAFs are functionally important for tumor growth and enhance angiogenesis via up-regulation of Clusterin. Using newly generated transgenic mice and adoptive BM transplantations, we demonstrate that BM-derived fibroblasts are a substantial source of CAFs in the tumor microenvironment. Unlike resident CAFs, BM-derived CAFs do not express PDGFRα, and their recruitment resulted in a decrease in the percentage of PDGFRα-expressing CAFs. Strikingly, decrease in PDGFRα in breast cancer patients was associated with worse prognosis, suggesting that BM-derived CAFs may have deleterious effects on survival. Therefore, PDGFRα expression distinguishes two functionally unique CAF populations in breast tumors and metastases and may have important implications for patient stratification and precision therapeutics.


Figures

None
Graphical abstract
Figure 1.
Figure 1.
Mammary and lung fibroblasts are activated during tumor progression. (A) Immunofluorescence of αSMA at distinct stages of mammary carcinogenesis in the MMTV-PyMT model. n = 4 mice at each stage; four sections/mouse were analyzed. Bars, 100 µm. Cell nuclei, DAPI; αSMA, FITC. (B) Quantification of A. Results show mean ± SEM; *, P = 0.02; ****, P < 0.0001; two-tailed Mann-Whitney test. Ca, carcinoma; MG, mammary gland. (C) FACS analysis of αSMA in normal mammary glands and mammary tumors from FVB/n Col1α-DsRed or PyMT;Col1α-DsRed female mice, respectively. Representative of three independent experiments. US, unstained. (D) Immunofluorescence of αSMA in normal lungs (staining mostly around bronchi) and lungs bearing micro- or macrometastases. Representative images of multiple fields analyzed from four mice in two independent experiments. Bars, 100 µm. (E) Quantification of D. Results show mean ± SEM; *, P = 0.028; two-tailed Mann-Whitney test. Mets, metastases. (F) qRT-PCR of PDGFRα+ lung CAFs, FACS sorted from a pool of end stage MMTV-PyMT mice (n = 5) and normal lung fibroblasts pooled from normal mice (n = 6). Error bars represent SD of technical repeats. *, P = 0.05; one-tailed Mann-Whitney test. (G) Co-staining of αSMA and PDGFRα in normal mammary gland or carcinoma. Bars, 50 µm. Asterisks mark double-labeled cells. (H and I) Quantification of αSMA+ cells percentage within PDGFRα+ stromal cells (H) and of PDGFRα+ cells percentage within αSMA+ stromal cells (I) in normal mammary glands and in hyperplasic or end-stage MMTV-PyMT tumors. Results show mean ± SEM. *, P = 0.028; one-tailed Mann-Whitney test. n = 4 mice at each stage; 4 high-power fields were analyzed for each mouse (24 high-power fields total). #, not detectable. (J) Co-staining of αSMA and PDGFRα in normal lungs and lung macrometastases. Bars, 100 µm. n = 2 mice at each stage. (K) Immunocytochemistry of αSMA and PDGFRα in normal mammary fibroblasts or in mammary CAFs. Bars, 50 µm. (l) Quantification of K. Multiple fields (at least six) from four different experiments were analyzed. Results show mean ± SEM; ****, P < 0.0001 for PDGFRα and P = 0.0002 for αSMA; two-tailed Mann-Whitney test. M-CAFs, mammary CAFs; NMFs, normal mammary fibroblasts. (M) Staining as in K of normal lung fibroblasts or lung CAFs. Bars, 50 µm. (N) Quantification of M. Multiple fields (at least seven) from three different experiments were analyzed. Results show the mean ± SEM; ***, P = 0.002; ****, P < 0.0001; two-tailed Mann-Whitney test. (O) FACS analysis of PDGFRα in normal mammary glands and mammary tumors pooled from three mice per group. Representative of two independent experiments. (P and Q) The percentage of PDGFRα+ cells out of CD45 cells (P) and absolute number of these cells (Q) in normal mammary gland and mammary tumors from MMTV-PyMT mice; n = 5 mice in each time point. Results show mean ± SEM; *, P = 0.03; **, P = 0.0079; two-tailed Mann-Whitney test.
Figure 2.
Figure 2.
A subpopulation of CAFs in mammary tumors and lung metastases are BM derived. (A) Scheme of BM transplantation model. 6-wk-old PyMT and FVB/n female mice were transplanted with fresh whole BM isolated from age-matched GFP-PyMT and GFP female mice, respectively. Mice were sacrificed when PyMT recipients had end-stage advanced carcinoma. BM transplantation was repeated five times. (B–G) PDGFRα is a marker of resident fibroblasts. (B) FACS analysis of mammary tumors derived from a BM-transplanted PyMT mouse. n = 4. (C and D) qRT-PCR analysis of fibroblastic markers in the PDGFRα+GFP (C) and PDGFRαGFP+ (D) cell populations presented in B. Results show mean ± SD of technical repeats. (E) FACS analysis of metastases-bearing lungs from BM-transplanted PyMT mice. n = 2. (F and G) qRT-PCR analysis of fibroblastic markers in the PDGFRα+GFP (F) and PDGFRαGFP+ (G) cell populations presented in E. Error bars represent SD of technical repeats. (H–M) A subpopulation of Col1α+ CAFs in mammary tumors and lung metastases are BM derived. (H) Scheme of BM transplantation model. Following BM ablation with total body irradiation, 6-wk-old PyMT;Col1α-YFP or FVB/n Col1α-YFP female mice were transplanted with fresh whole BM isolated from age-matched PyMT;Col1α-DsRed or FVB/n Col1α-DsRed female mice, respectively. Mice were analyzed when PyMT;Col1α-YFP recipients had advanced carcinoma tumors. BM transplantations were repeated five times (n = 2–4 mice in each cohort). (I) Immunofluorescent staining of resident (YFP) and BM-derived (DsRed) cells in normal mammary glands from FVB/n Col1α-YFP recipients or in mammary tumors from PyMT;Col1α-YFP recipient mice. Bars: 50 µm (left); 25 µm (right). (J) Immunofluorescent staining as in I in normal lungs from FVB/n Col1α-YFP recipients or in lung macrometastases from PyMT;Col1α-YFP recipients. Bars: 50 µm (left); 25 µm (right). For I and J, multiple fields from at least three mice were analyzed. Cell nuclei, DAPI; YFP, Alexa Fluor 488; DsRed, Rhodamine. (K) qRT-PCR analysis of fibroblastic and leukocyte markers in the YFP+ (resident) cells, FACS sorted from mammary tumors in the PyMT;Col1α-YFP recipient mice (n = 2, pooled). Error bars represent SD of technical repeats. (L) qRT-PCR analysis as above in the DsRed+ (BM-derived) cells isolated from recipient mice (n = 2, pooled). Error bars represent SD of technical repeats. (M) qRT-PCR analysis of PDGFRα expression in YFP+ (resident) and DsRed+ (BM-derived) cells isolated from recipient mice (pooled). Error bars represent SD of technical repeats. *, P = 0.05; one-tailed Mann-Whitney test.
Figure 3.
Figure 3.
Tumor cell–secreted factors induce differentiation of BM-derived mesenchymal stem cells to CAFs. (A) Images of cultured mesenchymal stem and progenitor cells (MSCs) produced from total BM of FVB/n Col1α-YFP mice. Light microscopy (right panel) and green fluorescence (left panel). n = 4. Representative of two independent experiments. Bars, 100 µm. (B) FACS analysis of PDGFRα in MSCs. (C and D) Fluorescent microscope images of MSCs that were incubated with C18 CM (C, right) or Met-1 CM (D, right) for 3 wk and compared with controls cultured in 10% FCS medium (left panels). YFP+ cells are shown in green. n = 4. Bars, 100 µm. (E and F) Quantification of YFP+ cell number (E) and fluorescence intensity (F) of images presented in C and D. 30 fields of CM and 10 fields of control were analyzed. Error bars represent SEM. ****, P < 0.0001, two-tailed Mann-Whitney test. (G) FACS analysis of PDGFRα in MSCs incubated with Met-1 CM. (H) Migration transwell assay of Met-1 mammary tumor cells incubated with tumor-activated NMFs (a-NMFs) or MSCs (a-MSCs) for 24 h. Representative images of 24 fields analyzed from duplicate wells. (I) Quantification of data shown in H. Results show mean ± SEM. ***, P = 0.0008; two-tailed Mann-Whitney test.
Figure 4.
Figure 4.
Resident and BM-derived CAFs express distinct immune-related genes. Following BM transplantation, resident and BM-derived CAFs from mammary tumors and lungs bearing macrometastases of recipient mice were tested for the expression of 561 immunology-related genes using the NanoString nCounter gene expression panel. n = 2 mice in each group. (A) Heat map presentation of differentially expressed genes of resident versus BM-derived CAFs in primary tumors (left) and lungs bearing macrometastases (right). (B) Venn diagrams of the 40 most highly expressed genes in each cell population. (C) Hierarchical clustering of total expressed genes in resident and BM-derived CAFs from primary tumors and lungs bearing macrometastases. Scaling method: unit variance scaling; PCA method: single-value decomposition with imputation. (D–I) PDGFRα+-resident CAFs and PDGFRα BM-derived CAFs have distinct tumor-promoting functions. Resident CAFs (EpCAMCD45Col1α+PDGFRα+) and BM-derived CAFs (EpCAMCD45Col1α+PDGFRα) were isolated from mammary tumors of PyMT;Col1α-YFP female mice, cultured, and injected in a Matrigel plug to FVB/n female mice. n = 4. Experiments were repeated twice. (D) Light and fluorescent microscopy of resident CAFs (left) and BM-derived CAFs (right) cultures preinjection. Bars, 30 µm. (E) Representative images of the plugs extracted 3 wk after injection. Bar, 5 mm. (F and H) Immunostaining of Meca32 (F) or F4/80 (H). 5 sections per plug were stained and 5 fields per section were analyzed for a total of 100 fields per cell type. Bars, 30 µm. (G and I) Quantification of staining presented in F and H performed with ImageJ software. Results are normalized to control (PBS-only plugs). Error bars represent SEM. ****, P < 0.0001 (G); **, P = 0.0041 (I); two-tailed Mann-Whitney test.
Figure 5.
Figure 5.
BM-derived CAFs are functionally important for tumor growth. (A) Scheme of transplantation model. Following BM ablation with total body irradiation, 6-wk-old FVB/n Col1α-YFP female mice were transplanted with either HSCs only or HSCs and MSCs isolated and sorted from age-matched FVB/n Col1α-DsRed female mice. 2 wk following transplantation, Met-1 cells were injected into the right inguinal mammary gland of the transplanted mice. Mice were euthanized 24 d after injection and tumors were analyzed. Experiment was repeated twice, n ≥ 3 mice per group for each experiment. (B) qRT-PCR analysis of DsRed expression in FVB/n Col1α-YFP recipient mice of both experiments, transplanted as indicated. Results were normalized to mGUS and to control (HSC-only transplantation). Error bars represent SEM. *, P = 0.003, two-tailed Mann-Whitney test. (C) Growth curve of tumors describes in A. n = 3 mice per group. Error bars represent SEM. *, P = 0.05; one-tailed Mann-Whitney test. (D) Tumor volumes of injected tumors at end-point. *, P = 0.05; one-tailed Mann-Whitney test. (E) FACS analysis of Annexin V in tumors from HSCs only or HSC and MSC–transplanted mice. Percentage from total nonleukocyte (CD45) epithelial (EpCAM+) cells. n = 3 mice per group. Error bars represent SEM. *, P = 0.05; one-tailed Mann-Whitney test. (F) Immunofluorescence of cleaved caspase-3 in tumor sections from transplanted mice. Bars, 50 µm. (G) Quantification of staining presented in F performed with ImageScope software and Aperio Positive Pixel Count Algorithm. 2 whole sections per mouse were analyzed for a total of 12 whole sections per group. Results are normalized to control (HSC-only transplantation). Error bars represent SEM. ****, P < 0.0001, two-tail Mann-Whitney test. (H and J) Immunofluorescence of F4/80 (H) or Meca32 (J) in tumor sections from transplanted mice. Multiple fields were analyzed from each tumor for a total of 40 fields per group per stain. Bars, 50 µm. (I and K) Quantification of staining presented in H and J performed with ImageJ software. Results are normalized to control (HSC-only transplantation). Error bars represent SEM. P = 0.86 (I); *, P = 0.01 (K); two-tailed Mann-Whitney test.
Figure 6.
Figure 6.
BM-derived CAFs enhance angiogenesis via Clusterin. (A) qRT-PCR analysis of Clusterin expression in resident (CD45Col1α+PDGFRα+) and BM-derived (CD45Col1α+PDGFRα) CAFs, FACS sorted from tumors of PyMT;Col1α-YFP mice. Results were normalized to mGUS. Error bars represent SD of technical repeats. n = 3 mice; *, P = 0.05; one-tailed Mann-Whitney test. (B) qRT-PCR analysis of Clusterin expression in BM-derived (CD45Col1α+PDGFRα) CAFs, FACS sorted from tumors of PyMT;Col1α-YFP mouse and cultured with SFM, siClusterin, or siControl. Results were normalized to GAPDH and to control. SFM, serum-free medium. Error bars represent SD of technical repeats. *, P = 0.05; one-tailed Mann-Whitney test. (C) Methylene blue viability assay of endothelial cells incubated with CM of BM-derived CAFs treated with siClusterin or siControl. Data presented as percent of SFM. n = 2 wells per cell type. Error bars represent SD of technical repeats. *, P = 0.0325; one-tailed Mann-Whitney test. (D) Scheme of Matrigel plug experiment. Resident CAFs (EpCAMCD45Col1α+PDGFRα+) and BM-derived CAFs (EpCAMCD45Col1α+PDGFRα) were isolated from mammary tumors of PyMT;Col1α-YFP female mice, cultured and treated with siClusterin or siControl for 48 h, after which they were injected in a Matrigel plug with additional siRNA to 6–8-wk-old FVB/n female mice. n = 2 mice in the control group and 6 mice in the siClusterin group. (E) Representative images of plugs that were extracted 1 wk after injection. Bar, 5 mm. (F) Immunostaining of Meca32 in Matrigel plugs as in E. Representative images (control group: n = 20 sections; siClusterin group: n = 12 sections). Bar, 50 µm. (G) Quantification of F performed with ImageScope software and Aperio Positive Pixel Count Algorithm. Error bars represent SEM. *, P = 0.02, two-tailed Mann-Whitney test.
Figure 7.
Figure 7.
Decreased PDGFRα in human tumors correlates with worse prognosis. Gene expression datasets in 10 diverse cancer types from TCGA and the newer TCGA PANCAN database were analyzed. (A) PDGFRα log2 fragments per kilobase of transcript per million mapped reads expression values in breast cancer patients (n = 649) compared with normal breast tissue (n = 79). **, P < 0.001, Student's t test, and fold-change >1.5. (B) Expression levels of PDGFRα across 10 diverse types of normal and malignant tissues (see Fig. S5 E for details of cohorts). **, P < 0.001, Student's t test, and fold-change >1.5. (C) Kaplan–Meier plot for overall survival rates at high and low expression levels of PDGFRα compared with the median expression (black and gray curves, respectively). Pre-processed and normalized RNA-seq gene expression data from the new TCGA were analyzed (n = 1,215). *, P < 0.05; χ2 test. (D and E) IHC of PDGFRα in tissue sections from human normal breast (n = 2; D) and invasive ductal carcinoma (n = 12; E) retrieved from the Human Protein Atlas. Asterisks, PDGFRα+ fibroblasts; arrowheads, PDGFRα fibroblasts. (F) Quantification of D and E. Error bars represent SEM. **, P = 0.022; two-tailed Mann-Whitney test. IDC, intraductal carcinoma; MG, mammary gland.

Comment in

  • Deciphering cancer fibroblasts.
    Biffi G, Tuveson DA. Biffi G, et al. J Exp Med. 2018 Dec 3;215(12):2967-2968. doi: 10.1084/jem.20182069. Epub 2018 Nov 23. J Exp Med. 2018. PMID: 30470718 Free PMC article.

References

    1. Anderberg C., and Pietras K.. 2009. On the origin of cancer-associated fibroblasts. Cell Cycle. 8:1461–1465. 10.4161/cc.8.10.8557 - DOI - PubMed
    1. Anderberg C., Li H., Fredriksson L., Andrae J., Betsholtz C., Li X., Eriksson U., and Pietras K.. 2009. Paracrine signaling by platelet-derived growth factor-CC promotes tumor growth by recruitment of cancer-associated fibroblasts. Cancer Res. 69:369–378. 10.1158/0008-5472.CAN-08-2724 - DOI - PMC - PubMed
    1. Arina A., Idel C., Hyjek E.M., Alegre M.L., Wang Y., Bindokas V.P., Weichselbaum R.R., and Schreiber H.. 2016. Tumor-associated fibroblasts predominantly come from local and not circulating precursors. Proc. Natl. Acad. Sci. USA. 113:7551–7556. 10.1073/pnas.1600363113 - DOI - PMC - PubMed
    1. Barcellos-de-Souza P., Comito G., Pons-Segura C., Taddei M.L., Gori V., Becherucci V., Bambi F., Margheri F., Laurenzana A., Del Rosso M., and Chiarugi P.. 2016. Mesenchymal Stem Cells are Recruited and Activated into Carcinoma-Associated Fibroblasts by Prostate Cancer Microenvironment-Derived TGF-β1. Stem Cells. 34:2536–2547. 10.1002/stem.2412 - DOI - PubMed
    1. Beer T.M., Hotte S.J., Saad F., Alekseev B., Matveev V., Fléchon A., Gravis G., Joly F., Chi K.N., Malik Z., et al. . 2017. Custirsen (OGX-011) combined with cabazitaxel and prednisone versus cabazitaxel and prednisone alone in patients with metastatic castration-resistant prostate cancer previously treated with docetaxel (AFFINITY): a randomised, open-label, international, phase 3 trial. Lancet Oncol. 18:1532–1542. 10.1016/S1470-2045(17)30605-8 - DOI - PubMed

Publication types

MeSH terms

Substances

Associated data