. 2018 Nov 23;9(1):4945.
doi: 10.1038/s41467-018-07472-8.

Oncogenic KRAS supports pancreatic cancer through regulation of nucleotide synthesis

Affiliations

Oncogenic KRAS supports pancreatic cancer through regulation of nucleotide synthesis

Naiara Santana-Codina et al. Nat Commun. .

Abstract

Oncogenic KRAS is the key driver of pancreatic ductal adenocarcinoma (PDAC). We previously described a role for KRAS in PDAC tumor maintenance through rewiring of cellular metabolism to support proliferation. Understanding the details of this metabolic reprogramming in human PDAC may provide novel therapeutic opportunities. Here we show that the dependence on oncogenic KRAS correlates with specific metabolic profiles that involve maintenance of nucleotide pools as key mediators of KRAS-dependence. KRAS promotes these effects by activating a MAPK-dependent signaling pathway leading to MYC upregulation and transcription of the non-oxidative pentose phosphate pathway (PPP) gene RPIA, which results in nucleotide biosynthesis. The use of MEK inhibitors recapitulates the KRAS-dependence pattern and the expected metabolic changes. Antagonizing the PPP or pyrimidine biosynthesis inhibits the growth of KRAS-resistant cells. Together, these data reveal differential metabolic rewiring between KRAS-resistant and sensitive cells, and demonstrate that targeting nucleotide metabolism can overcome resistance to KRAS/MEK inhibition.


Conflict of interest statement

A.C.K. has financial interests in Vescor Therapeutics, LLC. A.C.K. is an inventor on patents pertaining to KRAS regulated metabolic pathways, redox control pathways in pancreatic cancer, targeting GOT1 as a therapeutic approach, and the autophagic control of iron metabolism. A.C.K. is on the SAB of Cornerstone/Rafael Pharmaceuticals.

Figures

Fig. 1
Fig. 1
KRAS inhibition induces differential metabolic rewiring in PDAC cells. a KRAS inhibition impacts viability differentially after 48 h in complete media, as shown by trypan-blue exclusion assay. Error bars represent s.e.m. of 3 independent experiments. b Scheme representing the main enzymes and metabolites in the glycolytic and the pentose phosphate pathway (PPP). c Fold change of glycolytic intermediates after KRAS inhibition, each shRNA relative to its corresponding shGFP. Error bars represent s.d. of n = 3 technical replicates from independently prepared samples from individual wells. Significance determined for each shRNA vs. shGFP. G6P, glucose 6-phosphate; F6P, fructose 6-phosphate; FBP, fructose 1,6-bisphosphate; Ga3P, glyceraldehyde 3-phosphate; DHAP, dihydroxyacetone phosphate. d Extracellular acidification rate (ECAR) is decreased after KRAS depletion. All values normalized to cell number determined by crystal violet staining and fold change normalized to Panc-1 shGFP. Error bars represent s.e.m. of 4 independent experiments (* shows comparison to each cell line’s shGFP, # shows comparison to Panc1-shGFP). e Fold change of PPP intermediates and pyrimidines after KRAS inhibition, each shRNA normalized to its corresponding shGFP. Error bars represent s.d. of n = 3 technical replicates from independently prepared samples from individual wells. Significance determined for each shRNA vs. shGFP. Pentose-P, Pentose-phosphate; UDP, uridine diphosphate; UTP, uridine triphosphate. f Cell death analyzed by flow cytometry after KRAS depletion in Tu8902 cells in media supplemented with U (uridine) and I (inosine) at 1 mM, respectively. Bars represent relative fold change in cell death vs. shGFP (error bars show s.e.m of 5 independent experiments). For all panels, significance determined with t-test. *p < 0.05, **p < 0.01, ***p < 0.001
Fig. 2
Fig. 2
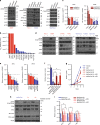
The MAPK-MYC-RPIA pathway defines resistance to KRAS and MEK inhibition. a Immunoblotting of human PDAC cell lines where KRAS was downregulated using 2 lentiviral short hairpin RNAs (shRNAs). b IC50 measurements (y-axis, IC50 mol/L) of PDAC cells (x-axis) treated with the MEK inhibitor AZD8330. c MYC and RPIA mRNA levels assessed by RT-qPCR in cells were KRAS was downregulated. Values are normalized to β-actin and each shRNA normalized to their corresponding shGFP. Error bars represent s.e.m. of at least three independent experiments. d Relative expression of proteins assessed by western blot in human PDAC cells treated with AZD8330 for 16 h (left: KRAS-resistant, right: KRAS-sensitive). e Relative mRNA levels of MYC and RPIA in the presence of AZD8330 for 16 h. All values normalized to β-actin and relative to DMSO treated cells. Error bars represent s.e.m. of independent experiments (CFPAC n = 5, YAPC, 8988 T n = 4, Panc-1, MiaPaCa2, Tu8902, MPanc96 n = 3). f MiaPaCa2 cell lines resistant to MEK inhibition were generated (AZD8330 = 50 nM). Colony number was normalized to MiaPaCa2 with vehicle. Error bars indicate s.d. of 2 technical replicates in 2 independent experiments. g Relative growth normalized to day 0. Error bars represent s.d. of technical replicates (one representative of 3 experiments). h Immunoblot of MiaPaCa2-resistant cells cultured with AZD8330 for 16 h maintained MYC and RPIA expression compared to treated MiaPaCa2 cells. i mRNA expression levels of MYC, RPIA and HK2 in MiaPaCa2 and MiaPaCa2 resistant cells after 16 h of AZD8330 exposure. Values are normalized to β-actin and each condition normalized to MiaPaCa2 with vehicle. Error bars represent s.e.m of at least three independent experiments (*shows comparison to each cell’s line control, # shows comparison to MiaPaCa2-AZD). For all panels, significance determined with t-test. *p < 0.05, **p < 0.01, ***p < 0.001
Fig. 3
Fig. 3
MEK inhibitor-induced metabolic reprogramming is comparable to shKras. a For all metabolomics experiments in this figure, cells were treated with AZD8330 (50 nM) for 72 h in media containing glucose 25 mM and glutamine 4 mM. Values are represented as fold change vs. DMSO-treated cells for glycolysis, PPP and HBP metabolites. Error bars represent s.d. of n = 3 technical replicates from independently prepared samples from individual wells. Significance determined for each cell line treated with AZD8330 vs. vehicle. b Quantification of Extracellular Acidification Rate (ECAR) normalized to cell number determined by crystal violet staining. All values relative to Panc-1 DMSO, error bars ± s.e.m. of independent experiments (* shows comparison to each cell line’s control (DMSO), # shows comparison to Panc1-DMSO). c Fold change of metabolites in the pyrimidine and purine pathways after AZD8330 treatment. UMP, uridine monophosphate; CDP, cytidine diphosphate, CTP, cytidine triphosphate; dCTP, deoxy CTP; dTTP, deoxy thymidine triphosphate; IMP, inosine monophosphate; AMP, adenosine monophosphate; dATP, deoxy adenosine triphosphate; GDP, guanosine diphosphate. Significance determined for each cell line treated with AZD8330 vs. vehicle. d Tracing experiments in Panc-1 and Tu8902 cells treated with AZD8330 (50 nM) in medium containing stable isotope-labeled glutamine (Amide-15N) for 24 h to label incorporation into the purine ring. Bars show fractional labeling vs. unlabeled pool, error bars indicate ± s.d. of n = 3 technical replicates from independently prepared samples from individual wells. e Fold change of metabolites in the tricarboxylic acid (TCA) cycle, transaminase and redox pathways after AZD8330 treatment, error bars indicate ± s.d. of n = 3 technical replicates from independently prepared samples from individual wells. Significance determined for each cell line treated with AZD8330 vs. vehicle. Ala, alanine; SAHomoCys, S-adenosyl-L-homocysteine; GSH, reduced glutathione; GSSG, oxidized glutathione. For all panels, significance determined with t-test. *p < 0.05, **p < 0.01, ***p < 0.001
Fig. 4
Fig. 4
MYC is required for survival of PDAC cells. a Clonogenic growth of PDAC cells expressing a control shRNA (shGFP) or two independent shRNAs targeting MYC. Error bars indicate s.d. of 2 technical replicates in 2 independent experiments. b Evaluation of cell death induction after MYC down-regulation using Annexin V-FITC and propidium iodide flow cytometry. Relative fold change in cell death of averaged experiments (error bars show s.e.m). c Relative mRNA levels of MYC and RPIA after MYC inhibition. Values are normalized to β-actin. Error bars represent s.d. of three technical replicates (1 representative of 3 experiments). d Immunoblot of PDAC cells expressing shGFP or shMYC shRNAs. For all panels, significance determined with t-test. *p < 0.05, **p < 0.01, ***p < 0.001
Fig. 5
Fig. 5
RPIA and nucleotide biosynthesis are essential for PDAC cell survival. a RPIA was targeted using two different shRNAs. Clonogenic growth was assessed in several human PDAC cells compared to the control shGFP. Error bars ± s.d., triplicate wells of a representative experiment (8988 T, MiaPaCa2 n = 4; Panc-1, BxPC3 n = 3; Tu8902 n = 2). b and c Cells depleted of RPIA were cultured in MEM or MEM containing nucleosides (10 mg/L or ≈0.04 mM, each) and cell death was assessed by trypan blue exclusion. Error bars represent s.e.m. of 3 independent experiments (* shows comparison to shGFP, # shows comparison to shRPIA in MEM). d Cell death analyzed by flow cytometry after RPIA depletion in MiaPaCa2 cells in media supplemented with U (uridine) and I (inosine) alone or in combination (1 mM, respectively). Bars represent relative fold change in cell death vs. shGFP of 4 averaged independent experiments (error bars show s.e.m). e Cell death analyzed by flow cytometry after RPIA depletion and mRPIA expression in MiaPaCa2 cells. Bars represent increase in cell death as compared to shGFP (error bars show s.e.m of 4 independent experiments). For all panels, significance determined with t-test. *p < 0.05, **p < 0.01, ***p < 0.001
Fig. 6
Fig. 6
DHODH inhibition blocks pyrimidine synthesis and sensitizes KRAS-resistant cells in vitro and in vivo. a Clonogenic growth (top) and relative proliferation (bottom) of Panc-1 and Tu8902 cells assessed after DHODH depletion using two different shRNAs. Relative colony number is normalized to shGFP control (error bars indicate s.d. of 2 technical replicates in 2 independent experiments). b Cell growth curves for Brequinar treated cells (50 μM). Values are normalized to Day 0. Error bars represent s.d. of triplicate wells from a representative experiment (n = 2). c MiaPaCa2 (left) and MiaPaCa2-resistant cells (right) decreased growth when leflunomide (100 μM) was added to media containing AZD8330. Error bars represent s.d. of quadruplicate wells from a representative experiment (n = 3). d LC-MS/MS metabolomic analysis of Panc-1 and Tu8902 cells treated with leflunomide (100 μM) for 16 h in 25 mM glucose/4 mM glutamine. Fold change relative to vehicle (methanol). Error bars represent s.d. of n = 3 technical replicates from independently prepared samples from individual wells. Significance determined for each cell line treated with AZD8330 vs. vehicle. Carb, carbamoyl; CMP/CTP, cytidine mono/triphosphate; UDP-G, UDP-glucose; UDP-GlcNAc; UDP-N-Acetyl-Glucosamine; IDP, Inosine diphosphate. e Fold change of metabolites in Tu8902 cells after DHODH inhibition (sh#2) relative to shGFP. Error bars represent s.d. of n = 3 technical replicates from independently prepared samples from individual wells. f Leflunomide (50 μM) decreases OCR in Panc-1 (left) and Tu8902 cells (right). AZD, AZD8330; LFL, leflunomide. Error bars show s.d. of 4 independent wells from a representative of 3 experiments. g Tumor growth is impaired after brequinar treatment (50 mg/kg). Error bars represent s.e.m. for 10 tumors per condition,t-tests were performed at each time point. h LC-MS/MS metabolomic analysis of tumors extracted after 4 weeks of treatment. Fold change of BQ-treated relative to vehicle. Error bars represent s.d. of n = 3 tumors per group. i BQ treatment decreases KI67 expression in treated mice vs. vehicle (left): representative field (40×) of 5 quantified fields per animal (8 mice per group, scale bar = 25 µm), (right): proliferation index calculated as number of positive cells vs. total cells, error bars show s.e.m. For all panels, significance determined with t-test. *p < 0.05, **p < 0.01, ***p < 0.001

References

    1. Rahib L, et al. Projecting cancer incidence and deaths to 2030: The unexpected burden of thyroid, liver, and pancreas cancers in the united states. Cancer Res. 2014;74:2913–2921. doi: 10.1158/0008-5472.CAN-14-0155. - DOI - PubMed
    1. National Cancer Institute. M. SEER Cancer Statistics Factsheets: Pancreas Cancer. (National Cancer Institute, Bethesda, 2012).
    1. Ghaneh P, Costello E, Neoptolemos JP. Biology and management of pancreatic cancer. Gut. 2007;56:1134–1152. doi: 10.1136/gut.2006.113068. - DOI - PMC - PubMed
    1. Hidalgo M. Pancreatic Cancer. N. Engl. J. Med. 2010;362:1605–1617. doi: 10.1056/NEJMra0901557. - DOI - PubMed
    1. Ying H, et al. Genetics and biology of pancreatic ductal adenocarcinoma. Genes Dev. 2006;30:355–385. doi: 10.1101/gad.275776.115. - DOI - PMC - PubMed

Publication types

MeSH terms