. 2018 Nov 23;8(1):17300.
doi: 10.1038/s41598-018-35607-w.

Dorsal-zone-specific reduction of sensory neuron density in the olfactory epithelium following long-term exercise or caloric restriction

Affiliations

Dorsal-zone-specific reduction of sensory neuron density in the olfactory epithelium following long-term exercise or caloric restriction

Ayinuer Tuerdi et al. Sci Rep. .

Abstract

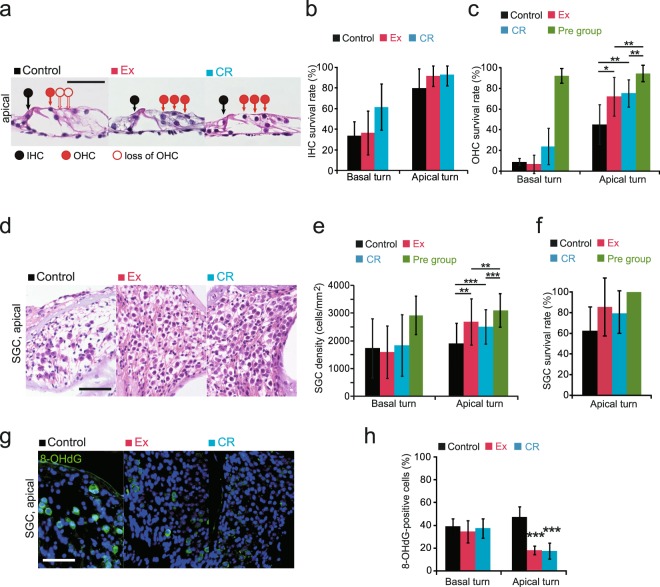
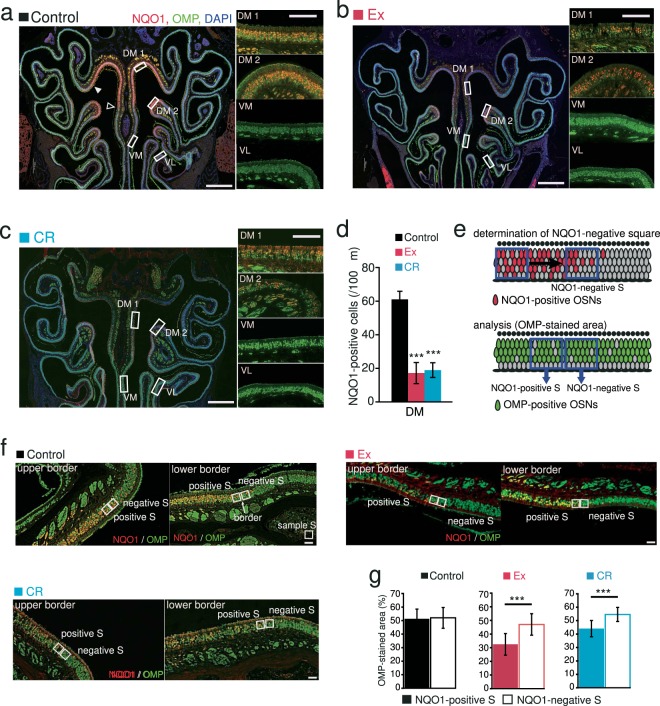
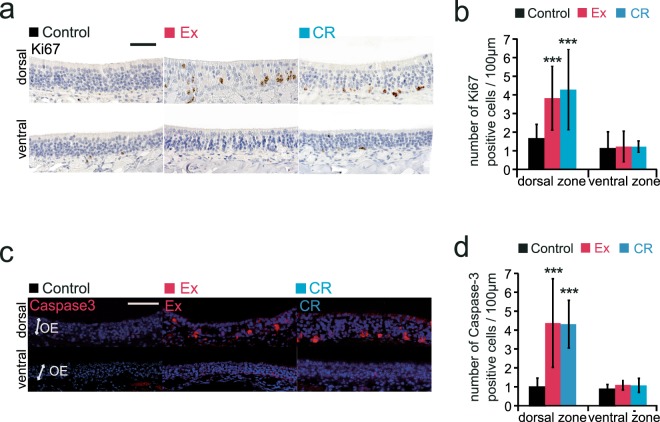
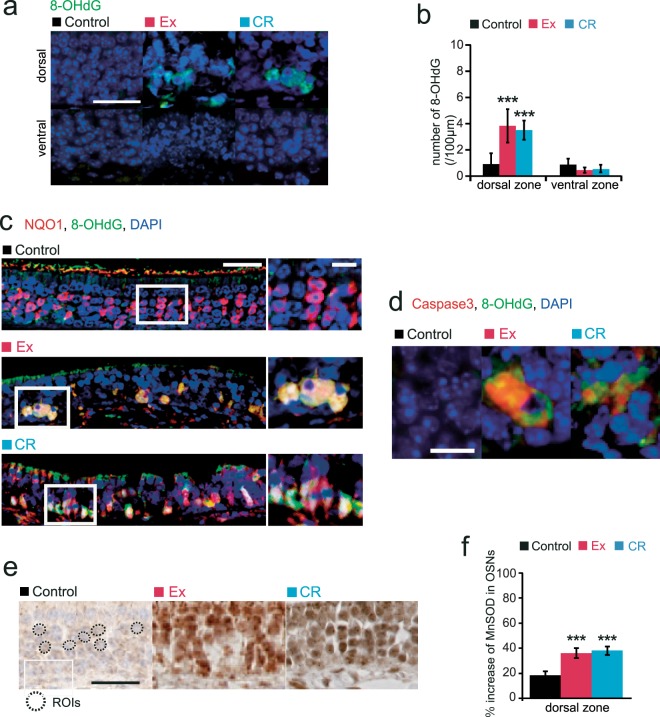
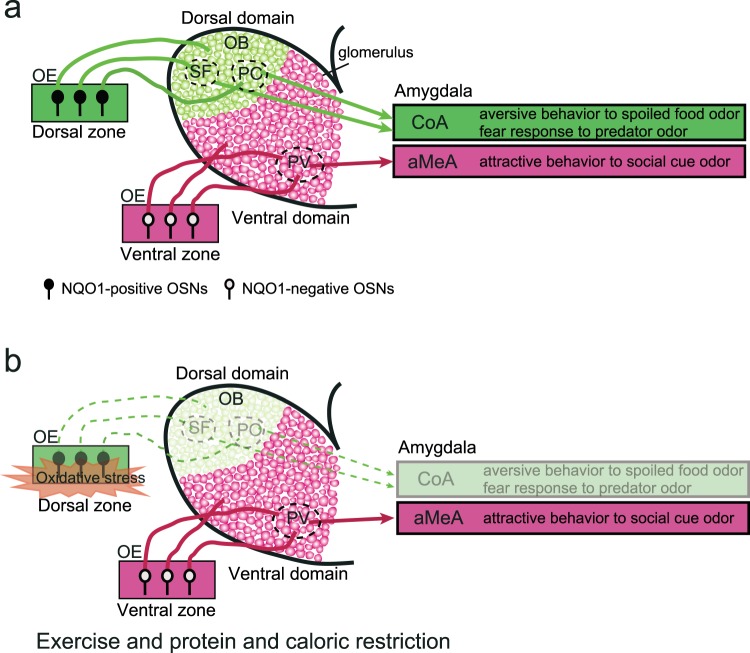
Exercise (Ex) and caloric restriction (CR) reduce oxidative stress and improve organ function. For instance, voluntary Ex or CR is known to reduce age-related cochlear damage in male C57BL/6J mice. However, the effect of Ex and CR on the olfactory system is unknown. In this study, we confirmed the positive effect of Ex and CR on age-related cochlear damage, but found that Ex and CR affected negatively cell dynamics in the olfactory epithelium (OE) by reducing the number of mature olfactory sensory neurons (OSNs) and increasing the number of proliferative basal cells and apoptotic OSNs in the dorsal zone of the olfactory epithelium (OE), which contains neurons expressing NADPH quinone oxido-reductase 1 (NQO1). In addition, these interventions resulted in lower odor-induced c-fos expression in areas of the olfactory bulb receiving projections from dorsal-zone OSNs than in areas receiving ventral-zone projections. Further, we observed substantial oxidative stress in NQO1-positive cells and apoptotic OSNs in the dorsal zone in Ex and CR animals. These results suggest that, in contrast to their positive effects in other organs, Ex and CR facilitate oxidative stress and negatively impact structure and function in dorsal-zone OSNs, probably in association with NQO1 bioactivation.


Conflict of interest statement

The authors declare no competing interests.

Figures

Figure 1
Figure 1
Effects of exercise or calorie restriction on body weight. (a) Study design. At 2 months of age, mice were divided into three groups: Ex, voluntary exercise on a running wheel with the control diet for 10 mo; CR, calorie-restricted diet for 10 mo. All mice were exposed to odors prior to fixation for subsequent measurement of c-fos expression. DOB, date of birth. (b) Time course of wheel-running distance (km/mo) for the 10 mo experimental period (n = 8 mice, mean ± SD). (c) Daily mean wheel-running distance. Wheel-running exercise followed a regular daily cycle. (d) Body weight at 2 mo (pre), 5 mo, and 10 mo in each group (n = 8 mice per group). Body weight in each group significantly increased after 5mo compared with 2mo (pre), and further significantly increased after 10 mo (**p < 0.01; ***p < 0.001; Steel test). (e) Percentage change in body weight from 2 mo (pre) to 5 mo and 10 mo (n = 8 mice per group). There was a significant reduction in percentage body-weight change at 5 mo and 10 mo in Ex and CR mice compared with control mice (*p < 0.05; **p < 0.01; ***p < 0.001; Mann-Whitney U test).
Figure 2
Figure 2
Effects of 10 month Ex, PR, and CR on age-related degenerative changes of inner ear. (a) Hematoxylin and eosin-stained images at the apical turn of the organ of Corti in control, Ex and CR mice. Black circles, IHCs; red circles, OHCs; open circles, loss of HCs; and closed circles, intact HCs. Scale bar, 50 μm. (b) IHC survival rates in control, Ex and CR mice. There were no significant differences in IHC survival rate in Ex or CR mice compared with control mice at either the basal turn or the apical turn (Mann-Whitney U test). (c) OHC survival rates in control, Ex, CR and Pre mice. There was a significant increase in OHC survival rate in Ex and CR mice at the apical turn compared with control mice (*p < 0.05; **p < 0.01; Mann-Whitney U test). The OHC survival rates of Ex and CR mice did not return to those of pre mice (**p < 0.01; Mann-Whitney U test). (d) Representative images of spiral ganglion cells (SGCs) at the apical turn in control, Ex and CR mice. Scale, 50 μm. (e) Summary of SGC density at the basal and apical turns. Mean SGC densities in Ex and CR mice at the apical turn were higher than those in control mice (**p < 0.01; ***p < 0.001; Mann-Whitney U test). The SGC densities in Ex and CR mice did not return to those of pre mice (**p < 0.01; ***p < 0.001; Mann-Whitney U test). (f) SGC survival rates in control, Ex, CR and Pre mice. (g) Representative images of 8-OHdG-positive cells at the apical turn in control, Ex and CR mice. Scale, 50 μm. (h) Summary of 8-OHdG-positive cells at the basal and apical turns. There was a significant decrease in mean 8-OHdG-positive cells in Ex and CR mice at the apical turn compared with control mice (***p < 0.001; Mann-Whitney U test).
Figure 3
Figure 3
Long-term Ex and CR induce a reduction in the number of OSNs in the dorsomedial region of the olfactory epithelium. (a) Time course of the experimental design. Control group: mice were presented with food ad libitum for the first 2 mo of life and were then fed the control diet for a further 10 mo before tissue fixation. Pre group: mice were presented with food ad libitum for the first 2 mo of life and then euthanized for tissue fixation. (b,c) Photomicrographs of representative coronal sections of the olfactory epithelium (OE) in control (B) and Pre mice (C). Left images, lower magnification; middle and right images, higher magnification of the selected rectangular regions with hematoxylin and eosin staining (middle) and anti-OMP staining (right). The unilateral OE was divided into four areas: dorsomedial (DM), dorsolateral (DL), ventromedial (VM), and ventrolateral (VL). Scale bars: 300 µm at low magnification, 50 µm at higher magnification. (d,e) Number of OSNs (D) and OMP-positive cells (E) in each area. There were no significant differences between control and Pre mice in any area (Mann-Whitney U test). (f,g) Photomicrographs of representative coronal sections in Ex and CR mice. Left images, lower magnification; middle and right images, higher magnification of the selected rectangular regions with hematoxylin and eosin staining (middle) and anti-OMP staining (right). Scale bars: 300 µm at low magnification, 50 µm at higher magnification. (h,i) Number of OSNs (H) and OMP-positive cells (I) in each area (DM, DL, VM, and VL) in Ex and CR mice. There were significant changes in the DM area in Ex and CR mice compared with control mice (**p < 0.01; Mann-Whitney U test).
Figure 4
Figure 4
Ex- and CR-induced reduction in OSN numbers occur selectively in the NQO1-positive dorsal zone of the olfactory epithelium. (a–c) Photomicrographs of representative coronal sections in control, Ex and CR mice. The rectangular portions of the OE in the left-hand photographs are enlarged in the right-hand images (red, anti-NQO1; green, anti-OMP; blue, DAPI). DM1, upper nasal septum in the dorsomedial area; DM2, upper concha bullosa in the dorsomedial area. Closed triangle, upper border of the NQO1-positive area; open triangle, lower border of the NQO1-positive area. Scale bars: 300 µm at low magnification, 50 µm at higher magnification. (d) The number of NQO1-positive cells in the dorsal zone in control, Ex and CR mice. The number of NQO1-positive cells was significantly lower in Ex and CR mice than in control mice (***p < 0.001; Mann-Whitney U test). (e) Schematic diagram for the determination of the NQO1-positive and -negative squares. Upper, the NQO1-negative square was defined as the 30 mm square closest to the border with a staining intensity <2 SD below the mean intensity measured in the NQO1-positive area of the OE. The NQO1-positive square (positive S) was defined as the 30 mm square adjacent to the NQO1-negative square. The intensity of OMP staining in NQO1-positive and -negative squares was compared. (f) Photomicrographs of the upper (closed triangle in a) and lower borders (open triangle in a) in control, Ex and CR mice (red, anti-NQO1; green, anti-OMP). The borders between NQO1-positive and -negative areas are shown (arrow). Scale bar, 30 µm. (g) Comparison of OMP-immunostained areas in NQO1-positive and -negative squares in control, Ex and CR mice. The OMP-stained area in the NQO1-positive square was smaller than that in the NQO1-negative square in Ex and CR mice, but not in control mice (***p < 0.001; Mann-Whitney U test).
Figure 5
Figure 5
Ex and CR reduce glomerular size and the neuronal response to odorants selectively in the dorsal domain of the olfactory bulb. (a) Area of analysis in the olfactory bulb (OB). Left, coronal section of the OB stained with anti-NQO1 antibody (red) and DAPI (blue). Right, schematic diagram of the OB showing NQO1-positive and -negative areas. (b) Representative coronal sections stained with anti-OMP (green) in control, Ex and CR mice. Each circled area corresponds to a glomerulus. Scale bar, 50 µm. (c) Summary of the ratio of areas stained and unstained with OMP. The OMP-stained area of NQO1-positive OB was significantly smaller in Ex and CR mice than in control mice (***p < 0.001; Mann-Whitney U test). There were no differences in the OMP-stained area between groups in the NQO1-negative OB (Mann-Whitney U test). (d) The number of glomerulus in control, Ex and CR mice in NQO1-positive and -negative OB. There were no significant differences in the number of glomeruli between groups in NQO1-positive and -negative OB (Mann-Whitney U test). (e) Representative OB coronal sections stained with anti-c-fos antibody for the NQO1-positive and NQO1-negative OB in control, Ex and CR mice. Scale bar, 50 µm. (f) The number of c-fos-positive cells in control, Ex and CR mice in NQO1-positive and -negative OB. The density of c-fos-positive cells in the NQO1-positive OB in Ex and CR mice was lower than that in control mice. There were no differences between groups in the density of c-fos-positive cells in NQO1-negative OB (***p < 0.001; Mann-Whitney U test).
Figure 6
Figure 6
Short-term Ex and CR did not induce a reduction in OSN numbers in the dorsal zone of the olfactory epithelium. (a) Time course of the experimental design. At 2 mo, mice were divided into three groups: control, 4 mo with the control diet; Ex, 4 mo running-wheel exercise with the control diet; CR, 4 mo with the CR diet. (b–d) Photomicrographs of representative coronal sections of the OE in control, Ex and CR mice. The rectangular portions of the OE in the left-hand photographs are enlarged in the right-hand images. Scale bars: 300 µm at low magnification, 50 µm at higher magnification. (e,f) Number of OSNs (e) and OMP-positive cells (f) in the dorsal and ventral zones. There were no significant histological changes between control, Ex and CR mice in either zone (Mann-Whitney U test).
Figure 7
Figure 7
Ex and CR increase the numbers of Ki67-positive cells and apoptotic cells in the dorsal zone of the olfactory epithelium. (a) Representative images of Ki67-positive cells in the dorsal and ventral zones in control, Ex and CR mice. Scale bar, 50 μm. (b) The number of Ki67-positive cells in dorsal and ventral zones in control, Ex and CR mice. In the dorsal zone, the number of Ki67-positive cells was significantly higher in Ex and CR mice than in control mice (***p < 0.001; Mann-Whitney U test), whereas there was no significant difference in the number of Ki67-positive cells in the ventral zone between Ex and CR mice and the controls. (c) Representative images of caspase-3-positive cells in dorsal and ventral zones in control, Ex and CR mice. Scale bar, 50 μm. (d) The number of caspase-3-positive cells in dorsal and ventral zones in control, Ex and CR mice. In the dorsal zone, the number of caspase-3-positive cells was significantly higher in Ex and CR mice than in control mice (***p < 0.001; Mann-Whitney U test). There was no significant difference in the number of caspase-3-positive cells in the ventral zone between Ex and CR mice and the controls.
Figure 8
Figure 8
Ex and CR increase the numbers of 8-OHdG-positive cells in the dorsal zone of the olfactory epithelium. (a) Representative images of 8-OHdG-positive cells in the dorsal zone in control, Ex and CR mice. Scale bar, 50 μm. (b) The number of 8-OHdG-positive cells in the dorsal zone in control, Ex and CR mice. The number of 8-OHdG-positive cells was significantly higher in Ex and CR mice than in control mice (***p < 0.001; Mann-Whitney U test). (c) Representative images anti-8-OHdG (green) and anti-NQO1 (red) staining in control, Ex and CR mice. The rectangular portions of the OE in the left-hand photographs are enlarged in the right-hand images. A significant number of 8-OHdG-positive cells were co-stained with anti-NQO1. Scale bars: 30 µm at low magnification, 10 µm at higher magnification. (d) Representative images stained with anti-8-OHdG (green) and anti-caspase-3 (Casp3, red) in control, Ex and CR mice. A significant number of 8-OHdG-positive cells were co-stained with anti-casp3. Scale bar, 20 µm. (e) Representative images of anti-MnSOD staining in control, Ex and CR mice showing the intensity of anti-MnSOD immunostaining in the OSNs (dotted circles), and axon bundles, and the intensity of immunostaining in OSNs compared with that in the control area. Scale bar, 20 µm. (f) MnSOD immunostaining in the OSNs of axon bundles of control, Ex and CR mice. Relative intensity of staining was significantly higher in the OSNs of Ex and CR mice than in those of control mice (***p < 0.001; Mann-Whitney U test).
Figure 9
Figure 9
Schematic diagram illustrating two parallel olfactory pathways. (a) NQO1-positive OSNs in the dorsal zone of the OE project to the dorsal domain in the main OB. Aversive odor signals are transmitted from the dorsal domain in the main OB (spoiled-food-odor-responsive glomeruli, SF; predator-odor-responsive glomeruli, PO) to the cortical amygdala (CoA), mediating the aversive behavior to spoiled food odors and the fear response to predator odors. NQO1-negative OSNs in the ventral zone project to the ventral domain in the main OB. Attractive social odor signals are transmitted from the posteroventral (PV) part of the main OB to the anterior amygdala (aMeA), mediating attractive behavior to social odor cues. OE, olfactory epithelium; OB, olfactory bulb; OSNs, olfactory sensory neurons. (b) Long-term Ex and CR reduce the number of functional OSNs in the dorsal zone that give rise to the dorsal olfactory pathway. By contrast, long-term Ex and CR have little effect on OSNs in the ventral zone that give rise to the ventral pathway.

Similar articles

Cited by

References

    1. Apel K, Hirt H. Reactive oxygen species: metabolism, oxidative stress, and signal transduction. Annual review of plant biology. 2004;55:373–399. doi: 10.1146/annurev.arplant.55.031903.141701. - DOI - PubMed
    1. Yamasoba T, et al. Current concepts in age-related hearing loss: epidemiology and mechanistic pathways. Hearing research. 2013;303:30–38. doi: 10.1016/j.heares.2013.01.021. - DOI - PMC - PubMed
    1. Kim JD, McCarter RJ, Yu BP. Influence of age, exercise, and dietary restriction on oxidative stress in rats. Aging (Milan, Italy) 1996;8:123–129. - PubMed
    1. Longo VD, Mattson MP. Fasting: molecular mechanisms and clinical applications. Cell metabolism. 2014;19:181–192. doi: 10.1016/j.cmet.2013.12.008. - DOI - PMC - PubMed
    1. Fontana L, Partridge L, Longo VD. Extending healthy life span–from yeast to humans. Science (New York, N.Y.) 2010;328:321–326. doi: 10.1126/science.1172539. - DOI - PMC - PubMed

Publication types

Substances