

Cherenkov imaging for linac beam shape analysis as a remote electronic quality assessment verification tool
- PMID: 30471126
- PMCID: PMC6367052
- DOI: 10.1002/mp.13303
Cherenkov imaging for linac beam shape analysis as a remote electronic quality assessment verification tool
Abstract
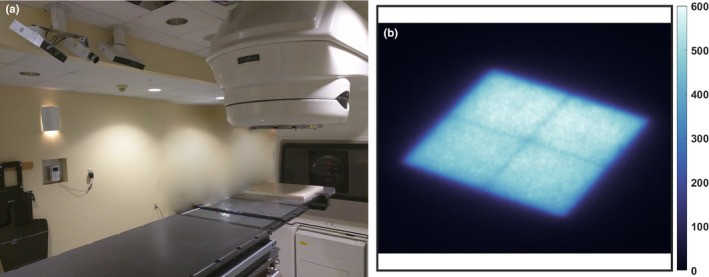
Purpose: A remote imaging system tracking Cherenkov emission was analyzed to verify that the linear accelerator (linac) beam shape could be quantitatively measured at the irradiation surface for Quality Audit (QA).
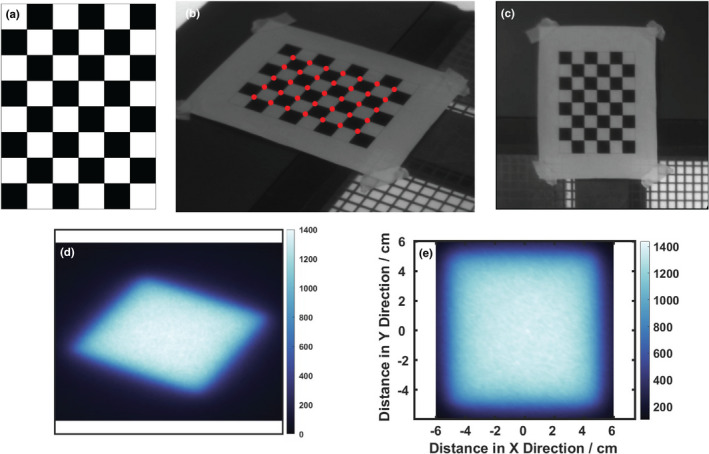
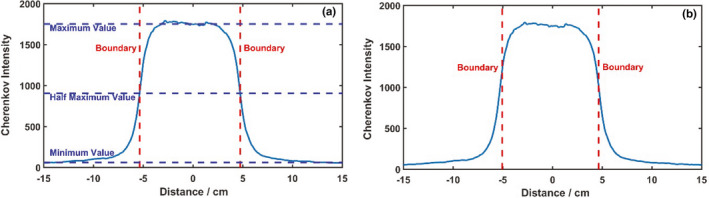
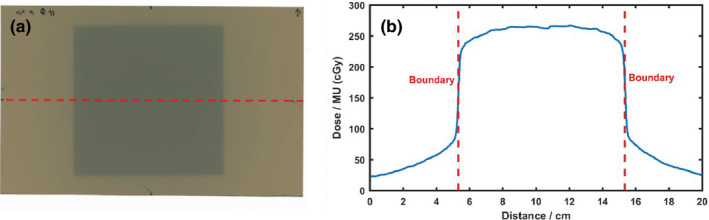
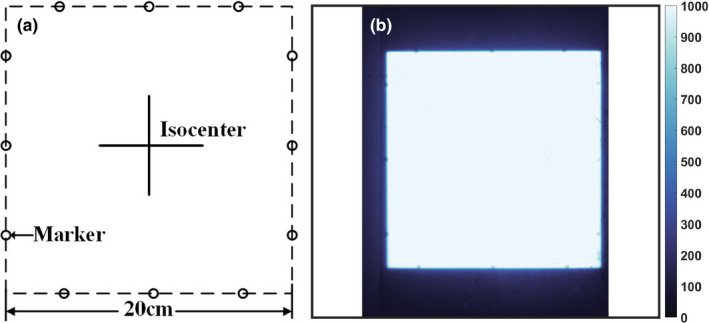
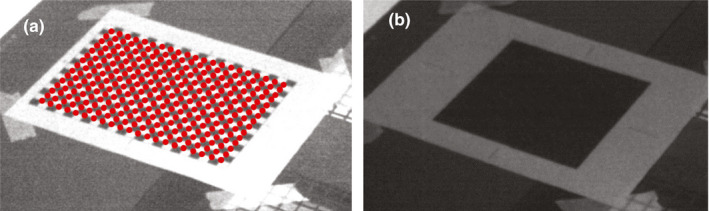
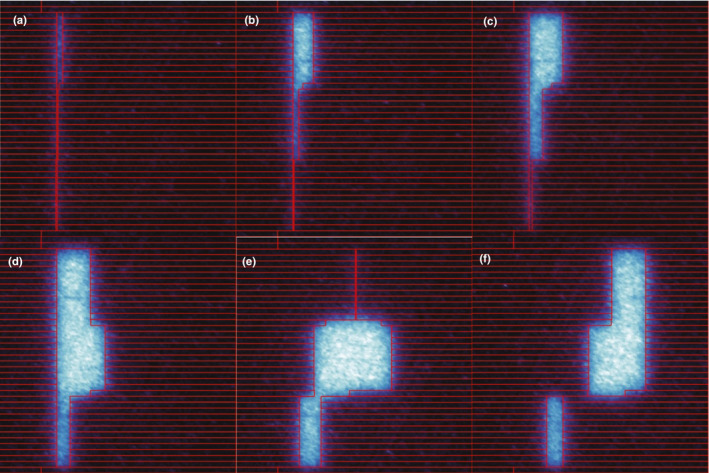
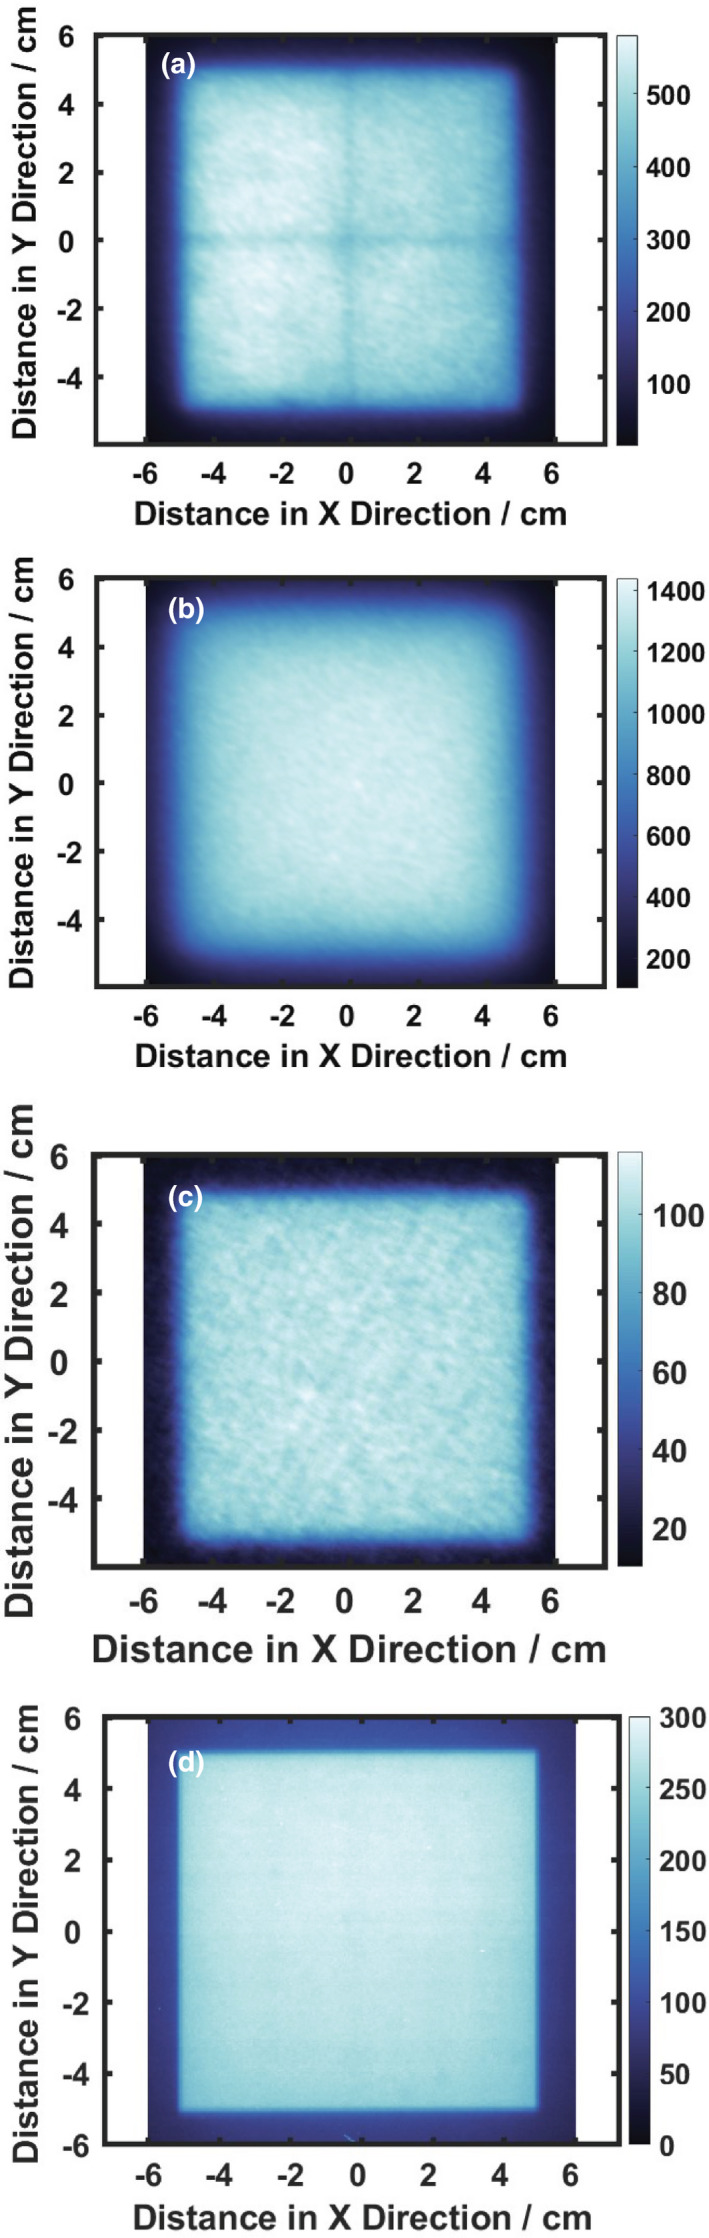
Methods: The Cherenkov camera recorded 2D dose images delivered on a solid acrylonitrile butadiene styrene (ABS) plastic phantom surface for a range of square beam sizes, and 6 MV photons. Imaging was done at source to surface distance (SSD) of 100 cm and compared to GaF film images and linac light fields of the same beam sizes, ranging over 5 × 5 cm2 up to 20 × 20 cm2 . Line profiles of each field were compared in both X and Y jaw directions. Each measurement was repeated on two different Clinac2100 machines. An interreader comparison of the beam width interpretation was completed using procedures commonly employed for beam to light field coincidence verification. Cherenkov measurements are also done for beams of complex treatment plan and isocenter QA.
Results: The Cherenkov image widths matched with the measured GaF images and light field images, with accuracy in the range of ±1 mm standard deviation. The differences between the measurements were minor and within tolerance of geometrical requirement of standard linac QA procedures conducted by human setup verification, which had a similar error range. The measurement made by the remote imaging system allowed for beam shape extraction of radiation fields at the SSD location of the beam.
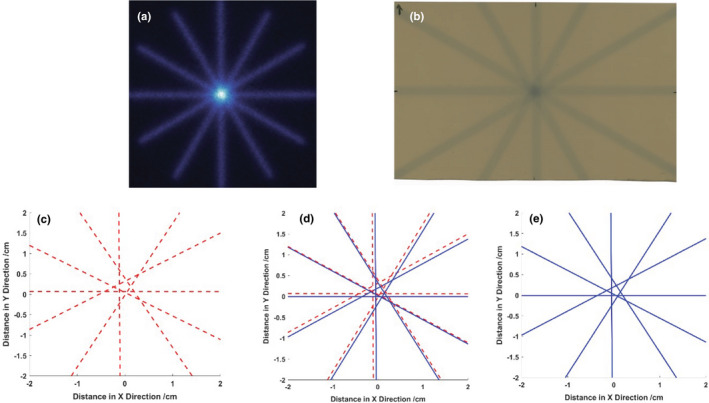
Conclusions: The proposed Cherenkov image acquisition system provides a valid way to remotely confirm radiation field sizes and provides similar information to that obtained from the linac light field or GaF film estimates of the beam size. The major benefit of this approach is that with a fixed installation of the camera, testing could be done completely under software control with automated image analysis, potentially simplifying conventional QA procedures with appropriate calibration of boundary definitions, and the natural extension to capturing dynamic treatment beamlets at SSD could have future value, such as verification of beam plans with complex beam shapes, like IMRT or "star-shot" QA for the isocenter.
Keywords: QA; Cerenkov; dosimetry; light field; linear accelerator; radiotherapy.
© 2018 American Association of Physicists in Medicine.
Conflict of interest statement
Authors Brian Pogue, Michael Jermyn, Venkataramanan Krishnaswamy, and William Ware all disclose that they are employed and financially involved with the company DoseOptics LLC, whose camera and software were used in acquisition of data in this manuscript. Author Petr Bruza has sponsored research financially supported by DoseOptics LLC, through his employment at Dartmouth College to disclose. Authors Tianshun Miao, Frank Rafie, David Gladstone, and Benjamin Williams have no financial interests to disclose related to this work.
Figures
References
-
- Nath R, Biggs PJ, Bova FJ, et al. AAPM code of practice for radiotherapy accelerators: report of AAPM radiation therapy task group No. 45. Med Phys. 1994;21:1093–1121. - PubMed
-
- Kutcher GJ, Coia L, Gillin M, et al. Comprehensive QA for radiation oncology: report of AAPM radiation therapy committee task group 40. Med Phys. 1994;21:581–618. - PubMed
-
- Klein EE, Hanley J, Bayouth J, et al. Task Group 142 report: quality assurance of medical accelerators. Med Phys. 2009;36:4197–4212. - PubMed
-
- American Association of Physicists in Medicine . Basic Quality Control in Diagnostic Radiology. Alexandria, VA: American Association of Physicists in Medicine; 1978.
MeSH terms
Grants and funding
LinkOut - more resources
Full Text Sources
Other Literature Sources
