. 2019 Jan;28(1):66-85.
doi: 10.1111/mec.14957.

The population genomics of multiple tsetse fly (Glossina fuscipes fuscipes) admixture zones in Uganda

Affiliations

The population genomics of multiple tsetse fly (Glossina fuscipes fuscipes) admixture zones in Uganda

Norah P Saarman et al. Mol Ecol. 2019 Jan.

Abstract

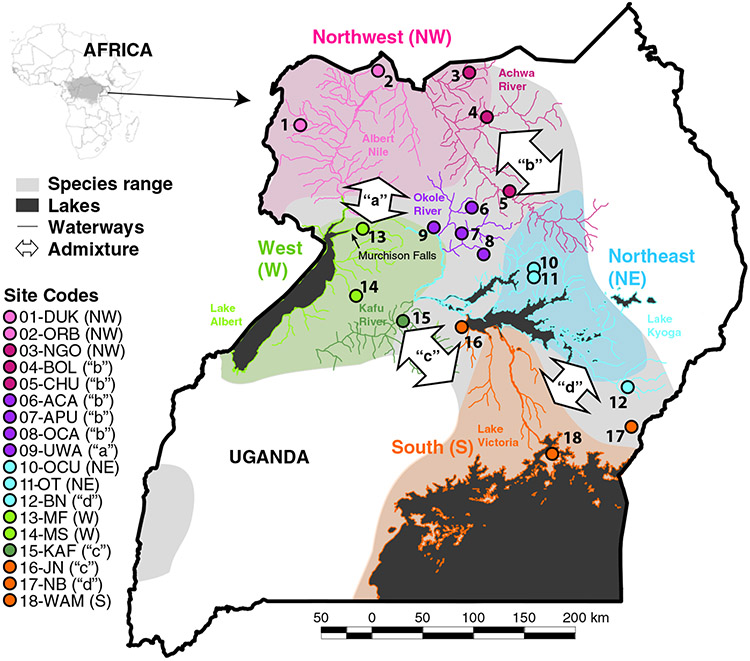
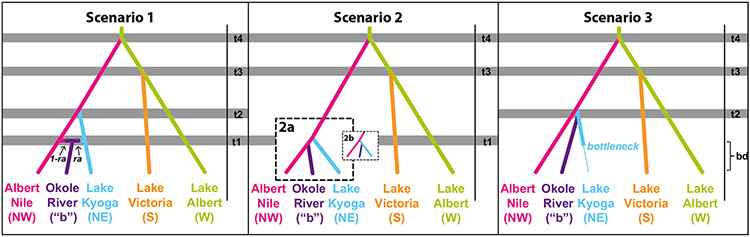
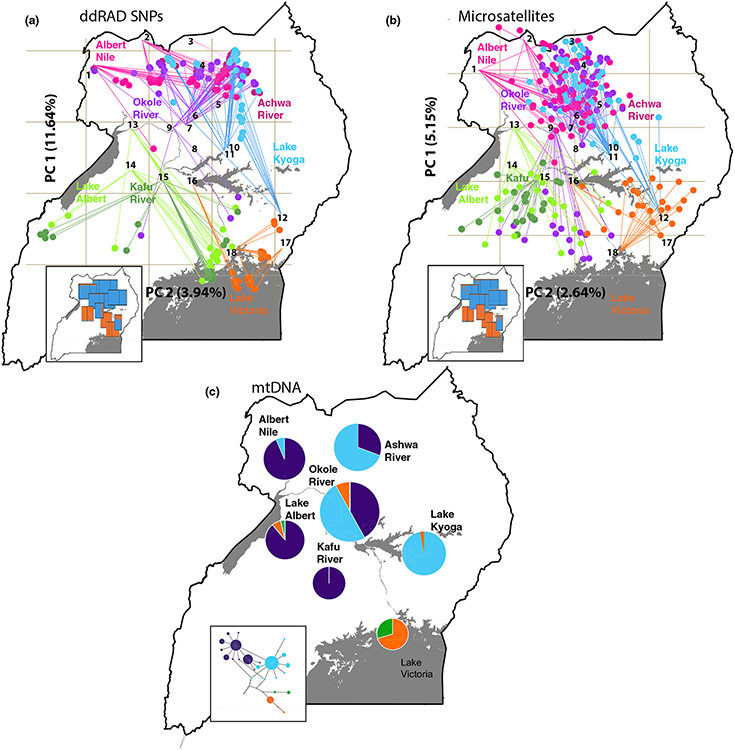
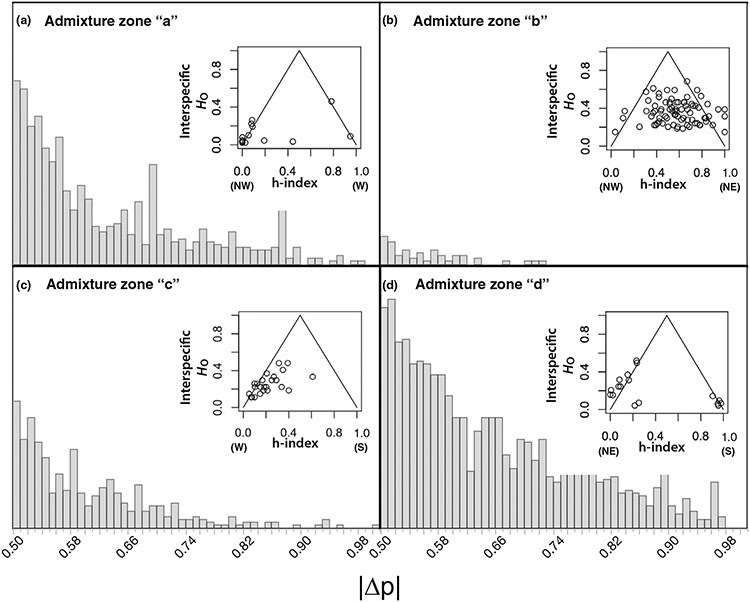
Understanding the mechanisms that enforce, maintain or reverse the process of speciation is an important challenge in evolutionary biology. This study investigates the patterns of divergence and discusses the processes that form and maintain divergent lineages of the tsetse fly Glossina fuscipes fuscipes in Uganda. We sampled 251 flies from 18 sites spanning known genetic lineages and the four admixture zones between them. We apply population genomics, hybrid zone and approximate Bayesian computation to the analysis of three types of genetic markers: 55,267 double-digest restriction site-associated DNA (ddRAD) SNPs to assess genome-wide admixture, 16 microsatellites to provide continuity with published data and accurate biogeographic modelling, and a 491-bp fragment of mitochondrial cytochrome oxidase I and II to infer maternal inheritance patterns. Admixture zones correspond with regions impacted by the reorganization of Uganda's river networks that occurred during the formation of the West African Rift system over the last several hundred thousand years. Because tsetse fly population distributions are defined by rivers, admixture zones likely represent both old and new regions of secondary contact. Our results indicate that older hybrid zones contain mostly parental types, while younger zones contain variable hybrid types resulting from multiple generations of interbreeding. These findings suggest that reproductive barriers are nearly complete in the older admixture zones, while nearly absent in the younger admixture zones. Findings are consistent with predictions of hybrid zone theory: Populations in zones of secondary contact transition rapidly from early to late stages of speciation or collapse all together.

Keywords: ddRAD; hybridization; population genomics; speciation; trypanosomiasis; vector.


Figures

FIGURE 1
FIGURE 1
Map of Uganda and the location of the 18 sampling sites of Glossina fuscipes fuscipes used in this study. Each sampling site marker indicates its placement relative to the distribution of the four pure genetic backgrounds (northwest: shaded pink, northeast: shaded blue, west: shaded green, south: shaded orange), and is color-coded by the watershed it falls within (Albert Nile: pink, Achwa River: magenta, Okole River: purple, Lake Kyoga: blue, Lake Albert: light green, Kafu River: dark green, Lake Victoria: orange). The species distribution of G. f. fuscipes beyond the distribution of the four pure genetic backgrounds is shown in light grey, and admixture zones (“a”, “b”, “c” and “d”) within this shading are indicated with arrows pointing to the genetic backgrounds in putative secondary contact in each zone.
FIGURE 2
FIGURE 2
Schematic of competing scenarios 1–3 tested in diyabc (Cornuet et al., 2014) to evaluate the relative probability of (a) divergence followed by secondary contact (Scenario 1), (b) ongoing gene flow or very recent and incomplete divergence (Scenario 2) with the alternative topologies 2a and 2b, (c) and the role of a bottleneck (shown with the transition from a thick to thin line; Scenario 3) in shaping the patterns of genetic variation observed in G. f. fuscipes populations in Uganda. Each panel shows the topology and population fluctuations specified in the scenario, wherein Ne was free to vary 100–30,000, or 100–5,000 during a bottleneck. Time priors are shown in shading (not to scale) and are labeled on the right of each scenario (t4 = 340–360 ka, t3 = 20–40 ka, t2 = 10–20 ka, t1 = 5–135 years ago). “ra” refers to rate of admixture, and was allowed to vary from 0 to 1. “bd” refers to the bottleneck duration, and was allowed to vary from 1.25 to 5,000 years ago (Supporting Information Table S3), which corresponds to a final desiccation event that was thought to occur in the Lake Kyoga region (Danley et al., 2012).
FIGURE 3
FIGURE 3
Genetic structure of Glossina fuscipes fuscipes in Uganda, including (a) principle components analysis (PCA) plots for 55,267 ddRAD SNPs, (b) PCA plots for 16 microsatellites, and (c) the frequency of groups of related mtDNA COI-COII haplotypes. In (a) and (b) each individual is indicated with a point connected by a line to the site of origin, and are colored by watershed of origin (Albert Nile in pink, Ashwa River in magenta, Okole River in purple, Lake Kyoga in blue, Lake Albert in light green, Kafu River in dark green and Lake Victoria in orange; see Supporting Information Table S4) for PCA plots of PC1-PC4 without the map), and the insets display structure version 2.3.4 (Pritchard & Stephens, 2000) results at K=2 (see Supporting Information Table S6) for full size). In (c), groups of related haplotypes are shown in the same colors (Haplogroup A in purple, Haplogroup B in blue, Haplogroup C in orange, and Haplogroup D in green), and the inset displays the TCS haplotype network (see Supporting Information Table S11) for full size).
FIGURE 4
FIGURE 4
Characterization of the Glossina fuscipes fuscipes admixture zones in Uganda using INTROGRESS v. 1.2.3 (Gompert & Buerkle, 2009) for (a) admixture zone “a”, (b) admixture zone “b”, (c) admixture zone “c”, and (d) admixture zone “d”. The main plots show the histograms of the absolute allele frequency difference (∣Δp∣) estimated from 33,057 unlinked ddRAD SNPs. Insets show triangle plots of the “interspecific” heterozygosity (HO) against “hybrid index” (h-index) estimated with a subset of SNPs with high ∣Δp∣ (0.8 for admixture zones “a”, “c”, and “d”; 0.5 for admixture zone “b”), wherein first generation hybrids appear at the apex, advanced generation hybrids occur in the center, and parental types occur in the bottom left/right, with the genetic cluster that represents that parental type indicated with abbreviations: northwest (NW), northeast (NE), west (W), south (S).

References

    1. Abila PP, Slotman MA, Parmakelis A, Dion KB, Robinson AS, Muwanika VB, … Caccone A (2008). High levels of genetic differentiation between Ugandan Glossina fuscipes fuscipes populations separated by Lake Kyoga. PLoS Neglected Tropical Diseases, 2(5), e242. 10.1371/journal.pntd.0000242 - DOI - PMC - PubMed
    1. Adamack AT, & Gruber B (2014). PopGenReport: Simplifying basic population genetic analyses in R. Methods in Ecology and Evolution, 5(4), 384–387. 10.1111/2041-210X.12158 - DOI
    1. Aksoy S, Caccone A, Galvani AP, & Okedi LM (2013). Glossina fuscipes populations provide insights for Human African Trypanosomiasis transmission in Uganda. Trends in Parasitology, 29, 394–406. doi.org/10.1016/j.pt.2013.06.005 - DOI - PMC - PubMed
    1. Alam U, Hyseni C, Symula RE, Brelsfoard C, Wu Y, Kruglov O, … Aksoy S (2012). Implications of microfauna-host interactions for trypanosome transmission dynamics in Glossina fuscipes fuscipes in Uganda. Applied and Environmental Microbiology, 78, 4627–4637. 10.1128/AEM.00806-12 - DOI - PMC - PubMed
    1. Barton NH (2001). The role of hybridization in evolution. Molecular Ecology, 10, 551–568. 10.1046/j.1365-294x.2001.01216.x - DOI - PubMed

Publication types

Substances

Associated data