

DeepSeeNet: A Deep Learning Model for Automated Classification of Patient-based Age-related Macular Degeneration Severity from Color Fundus Photographs
- PMID: 30471319
- PMCID: PMC6435402
- DOI: 10.1016/j.ophtha.2018.11.015
DeepSeeNet: A Deep Learning Model for Automated Classification of Patient-based Age-related Macular Degeneration Severity from Color Fundus Photographs
Abstract
Purpose: In assessing the severity of age-related macular degeneration (AMD), the Age-Related Eye Disease Study (AREDS) Simplified Severity Scale predicts the risk of progression to late AMD. However, its manual use requires the time-consuming participation of expert practitioners. Although several automated deep learning systems have been developed for classifying color fundus photographs (CFP) of individual eyes by AREDS severity score, none to date has used a patient-based scoring system that uses images from both eyes to assign a severity score.
Design: DeepSeeNet, a deep learning model, was developed to classify patients automatically by the AREDS Simplified Severity Scale (score 0-5) using bilateral CFP.
Participants: DeepSeeNet was trained on 58 402 and tested on 900 images from the longitudinal follow-up of 4549 participants from AREDS. Gold standard labels were obtained using reading center grades.
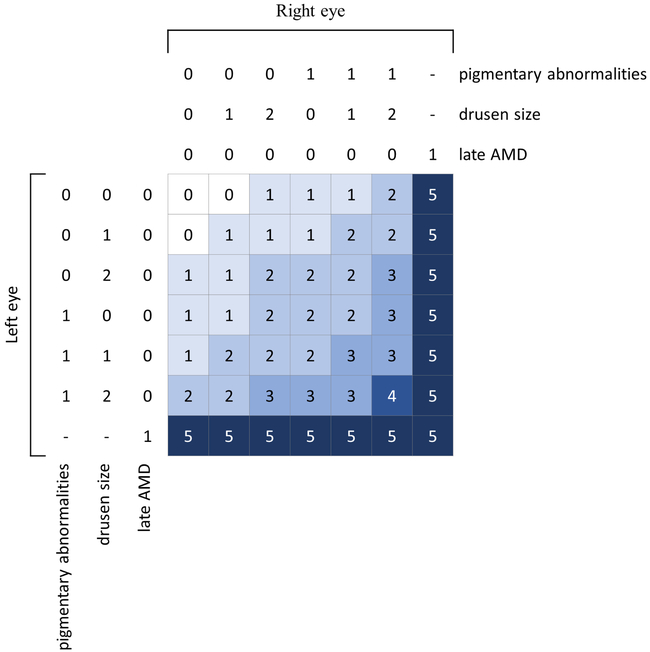
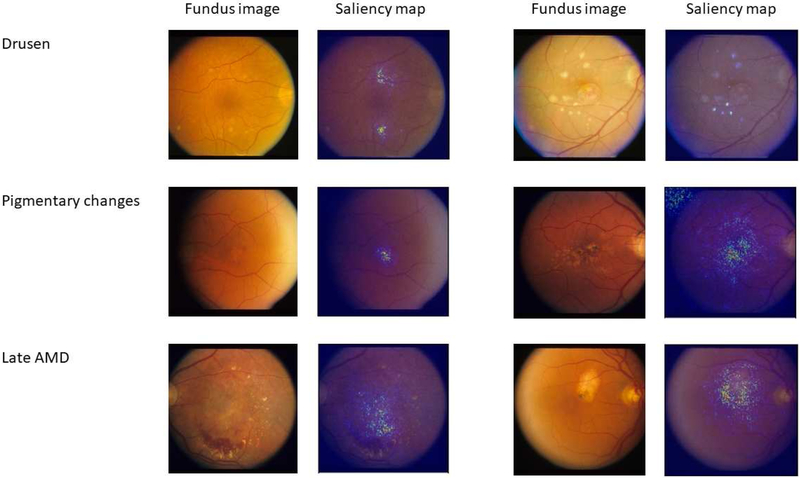
Methods: DeepSeeNet simulates the human grading process by first detecting individual AMD risk factors (drusen size, pigmentary abnormalities) for each eye and then calculating a patient-based AMD severity score using the AREDS Simplified Severity Scale.
Main outcome measures: Overall accuracy, specificity, sensitivity, Cohen's kappa, and area under the curve (AUC). The performance of DeepSeeNet was compared with that of retinal specialists.
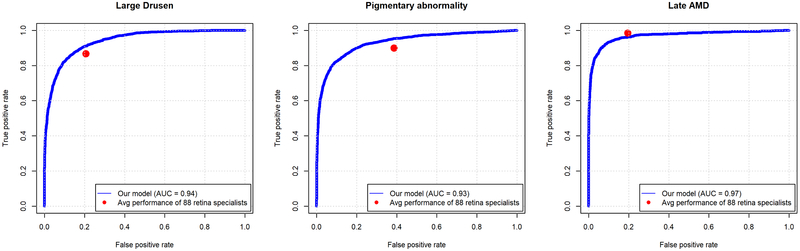
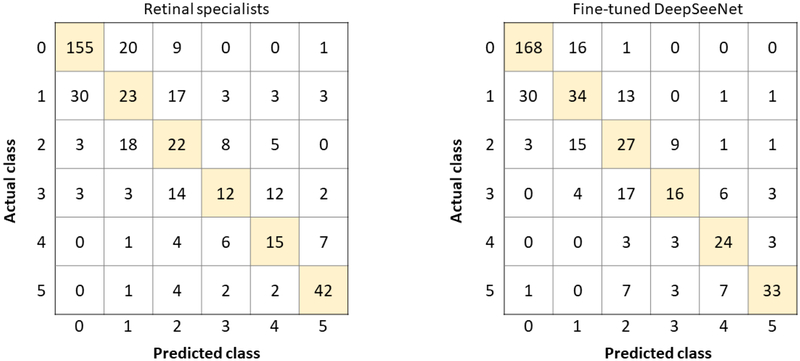
Results: DeepSeeNet performed better on patient-based classification (accuracy = 0.671; kappa = 0.558) than retinal specialists (accuracy = 0.599; kappa = 0.467) with high AUC in the detection of large drusen (0.94), pigmentary abnormalities (0.93), and late AMD (0.97). DeepSeeNet also outperformed retinal specialists in the detection of large drusen (accuracy 0.742 vs. 0.696; kappa 0.601 vs. 0.517) and pigmentary abnormalities (accuracy 0.890 vs. 0.813; kappa 0.723 vs. 0.535) but showed lower performance in the detection of late AMD (accuracy 0.967 vs. 0.973; kappa 0.663 vs. 0.754).
Conclusions: By simulating the human grading process, DeepSeeNet demonstrated high accuracy with increased transparency in the automated assignment of individual patients to AMD risk categories based on the AREDS Simplified Severity Scale. These results highlight the potential of deep learning to assist and enhance clinical decision-making in patients with AMD, such as early AMD detection and risk prediction for developing late AMD. DeepSeeNet is publicly available on https://github.com/ncbi-nlp/DeepSeeNet.
Copyright © 2018 American Academy of Ophthalmology. Published by Elsevier Inc. All rights reserved.
Conflict of interest statement
Figures
References
-
- Congdon N, O'Colmain B, Klaver CC, et al. Causes and prevalence of visual impairment among adults in the United States. Archives of ophthalmology. 2004;122(4):477–485. - PubMed
-
- Wong WL, Su X, Li X, et al. Global prevalence of age-related macular degeneration and disease burden projection for 2020 and 2040: a systematic review and meta-analysis. Lancet Glob Health. 2014;2(2):e106–116. - PubMed
-
- Rudnicka AR, Jarrar Z, Wormald R, Cook DG, Fletcher A, Owen CG. Age and gender variations in age-related macular degeneration prevalence in populations of European ancestry: a meta-analysis. Ophthalmology. 2012;119(3):571–580. - PubMed
Publication types
MeSH terms
Grants and funding
LinkOut - more resources
Full Text Sources
Other Literature Sources
Miscellaneous
