

Patients Allergic to Fish Tolerate Ray Based on the Low Allergenicity of Its Parvalbumin
- PMID: 30471362
- PMCID: PMC7060078
- DOI: 10.1016/j.jaip.2018.11.011
Patients Allergic to Fish Tolerate Ray Based on the Low Allergenicity of Its Parvalbumin
Abstract
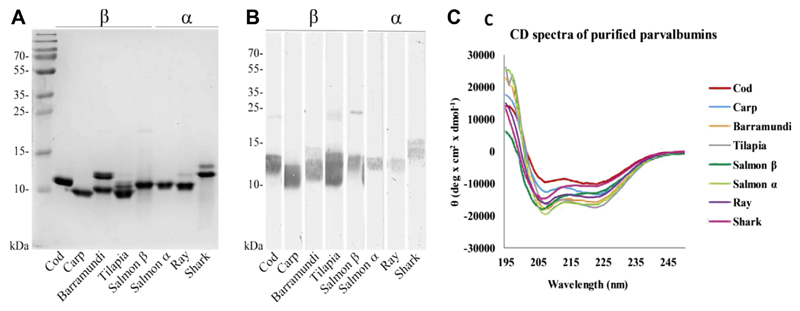
Background: Clinical reactions to bony fish species are common in patients with allergy to fish and are caused by parvalbumins of the β-lineage. Cartilaginous fish such as rays and sharks contain mainly α-parvalbumins and their allergenicity is not well understood.
Objective: To investigate the allergenicity of cartilaginous fish and their α-parvalbumins in individuals allergic to bony fish.
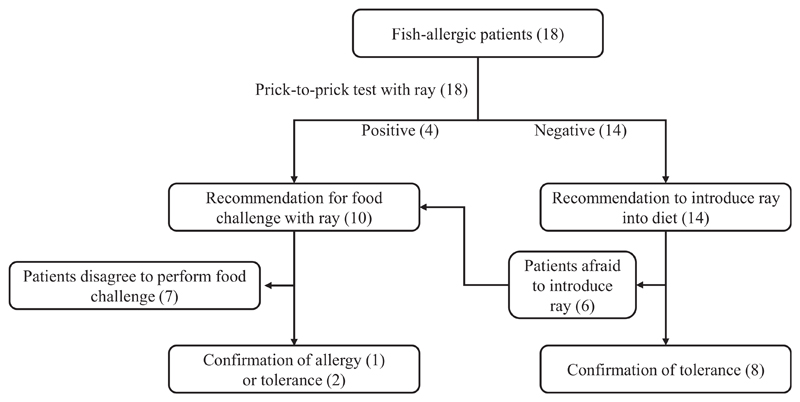
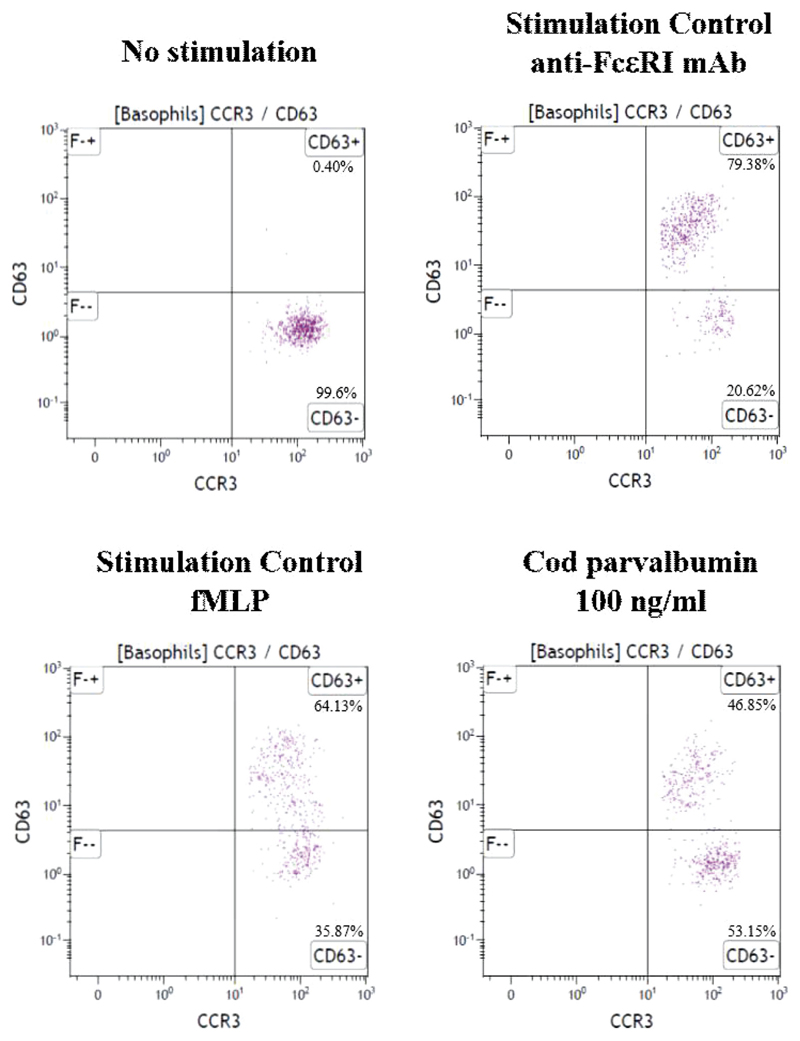
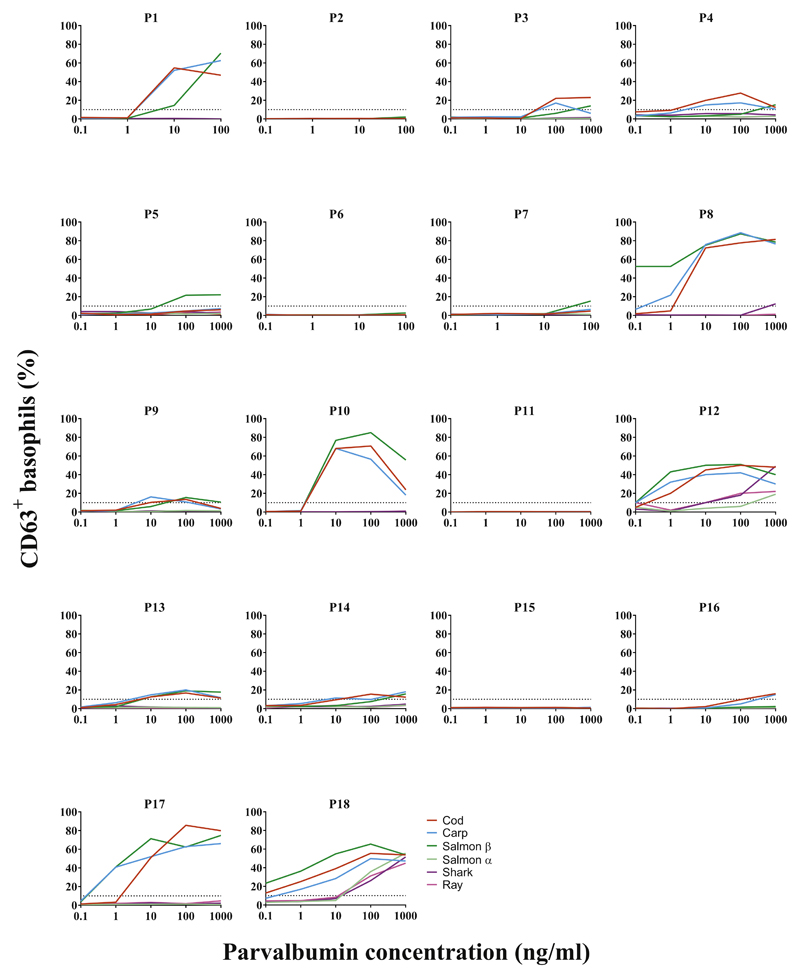
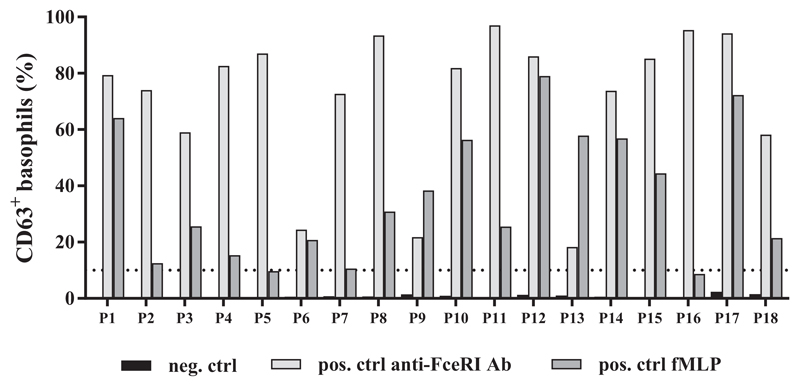
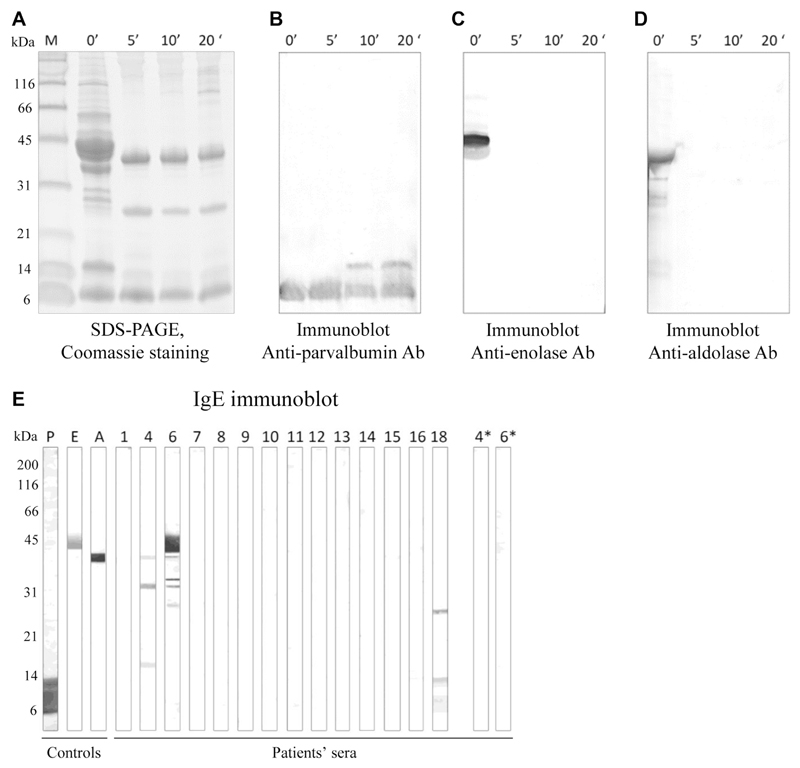
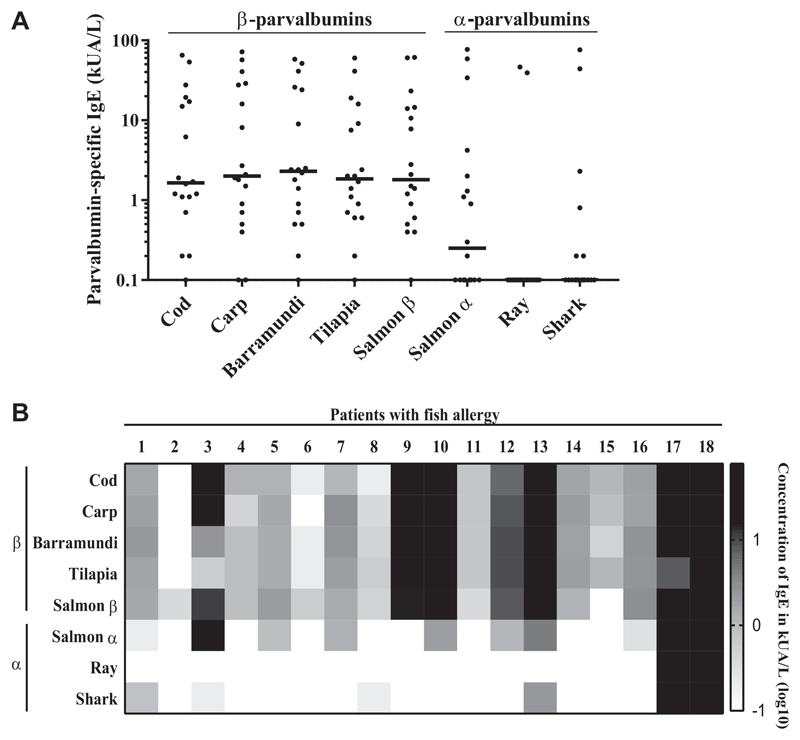
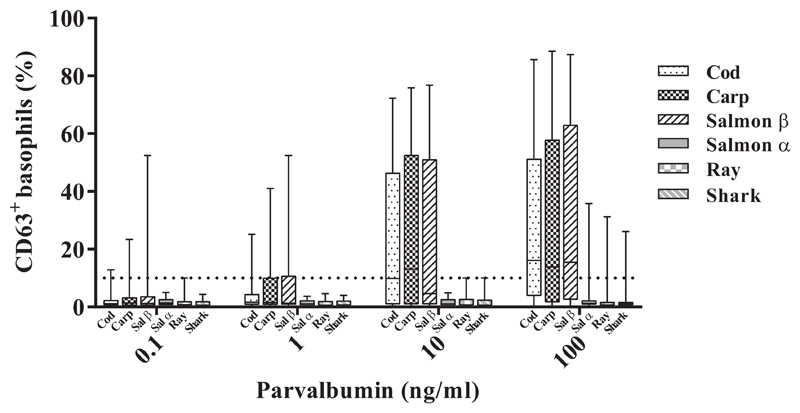
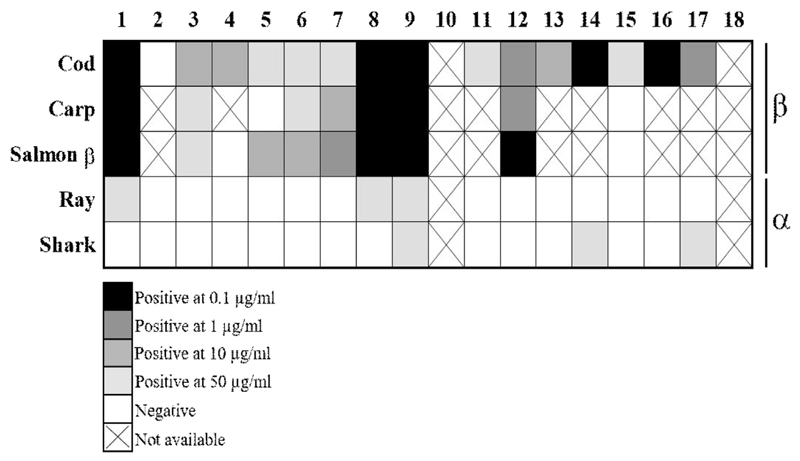
Methods: Sensitization to cod, salmon, and ray among patients allergic to cod, salmon, or both (n = 18) was explored by prick-to-prick testing. Clinical reactivity to ray was assessed in 11 patients by food challenges or clinical workup. IgE-binding to β-parvalbumins (cod, carp, salmon, barramundi, tilapia) and α-parvalbumins (ray, shark) was determined by IgE-ELISA. Basophil activation tests and skin prick tests were performed with β-parvalbumins from cod, carp, and salmon and α-parvalbumins from ray and shark.
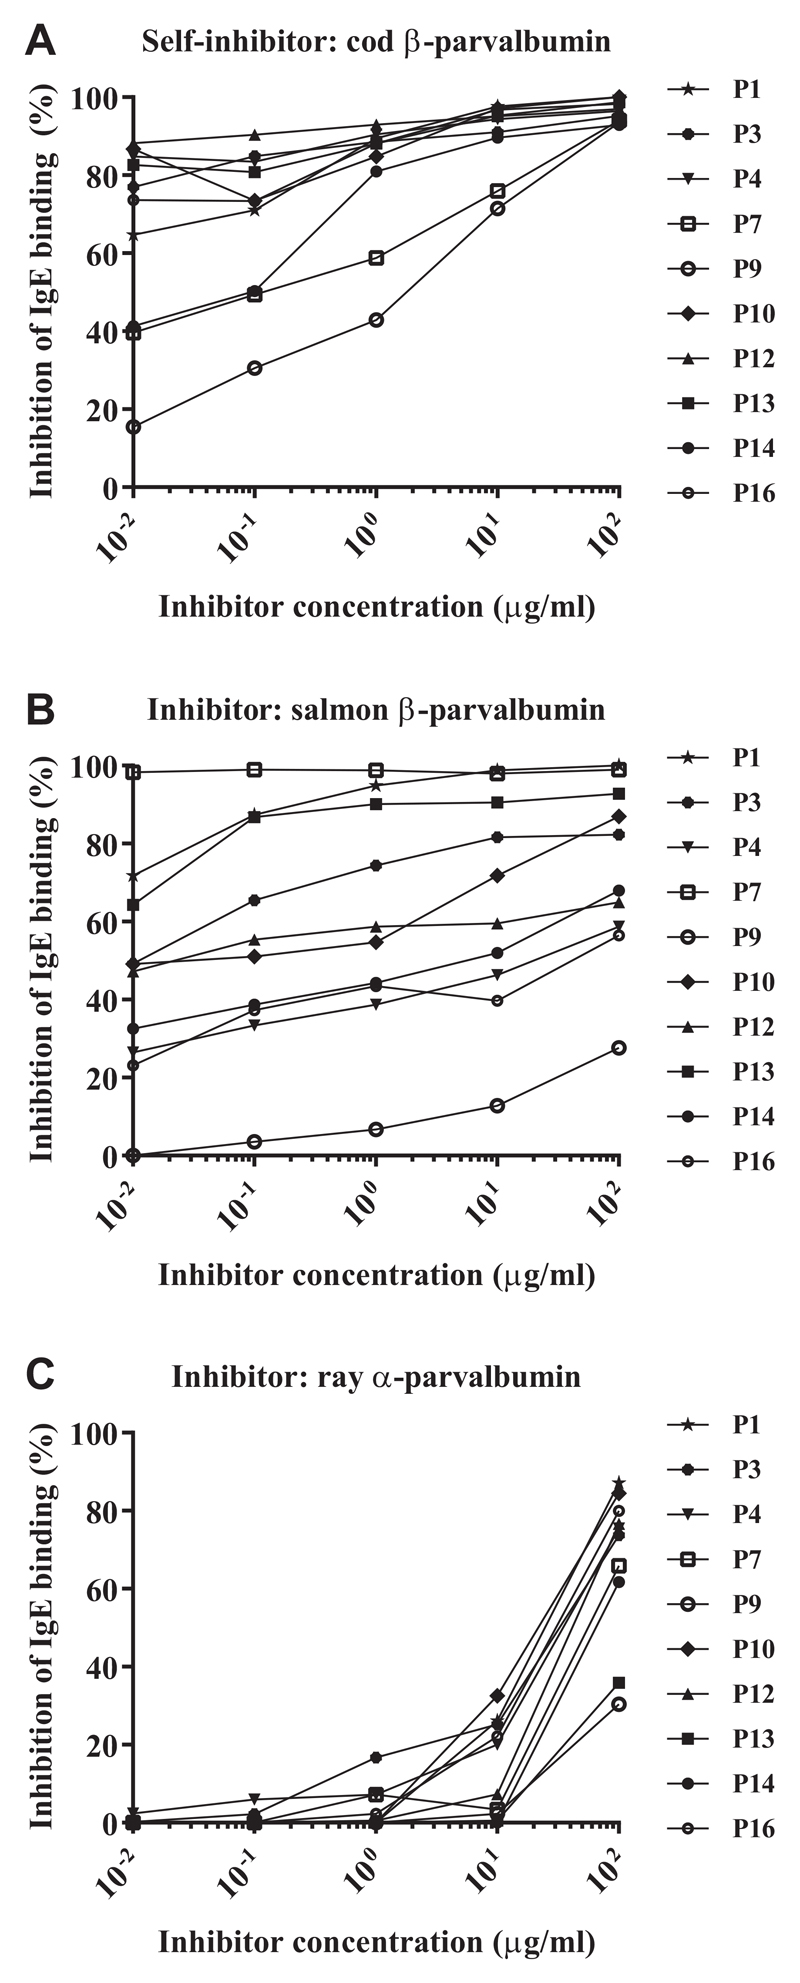
Results: Tolerance of ray was observed in 10 of 11 patients. Prick-to-prick test reactions to ray were markedly lower than to bony fish (median wheal diameter 2 mm with ray vs 11 mm with cod and salmon). IgE to α-parvalbumins was lower (median, 0.1 kU/L for ray and shark) than to β-parvalbumins (median, ≥1.65 kU/L). Furthermore, α-parvalbumins demonstrated a significantly reduced basophil activation capacity compared with β-parvalbumins (eg, ray vs cod, P < .001; n = 18). Skin prick test further demonstrated lower reactivity to α-parvalbumins compared with β-parvalbumins.
Conclusions: Most patients allergic to bony fish tolerated ray, a cartilaginous fish, because of low allergenicity of its α-parvalbumin. A careful clinical workup and in vitro IgE-testing for cartilaginous fish will improve patient management and may introduce an alternative to bony fish into patients' diet.
Keywords: Basophil activation; Cod; Fish allergy; Food challenge; IgE; Parvalbumin; Ray; Skin prick test.
Copyright © 2018 The Authors. Published by Elsevier Inc. All rights reserved.
Conflict of interest statement
Conflicts of interest: The authors declare that they have no relevant conflicts of interest.
Figures
References
-
- Matricardi PM, Kleine-Tebbe J, Hoffmann HJ, Valenta R, Hilger C, Hofmaier S, et al. EAACI Molecular Allergology User’s Guide. Pediatr Allergy Immunol. 2016;27:1–250. - PubMed
-
- Sharp MF, Lopata AL. Fish allergy: in review. Clin Rev Allergy Immunol. 2014;46:258–71. - PubMed
-
- Inoue JG, Miya M, Lam K, Tay BH, Danks JA, Bell J, et al. Evolutionary origin and phylogeny of the modern holocephalans (Chondrichthyes: Chimaer-iformes): a mitogenomic perspective. Mol Biol Evol. 2010;27:2576–86. - PubMed
-
- Stephen JN, Sharp MF, Ruethers T, Taki A, Campbell DE, Lopata AL. Allergenicity of bony and cartilaginous fish—molecular and immunological properties. Clin Exp Allergy. 2017;47:300–12. - PubMed
-
- Calderon-Rodriguez S, Pineda F, Perez R, Munoz C. Tolerability to dogfish in children with fish allergy. Allergol Immunopathol (Madr) 2016;44:167–9. - PubMed
Publication types
MeSH terms
Substances
Grants and funding
LinkOut - more resources
Full Text Sources
Other Literature Sources
Medical
Research Materials
