

Particle emissions from fused deposition modeling 3D printers: Evaluation and meta-analysis
- PMID: 30471608
- PMCID: PMC8350970
- DOI: 10.1016/j.scitotenv.2018.11.070
Particle emissions from fused deposition modeling 3D printers: Evaluation and meta-analysis
Abstract
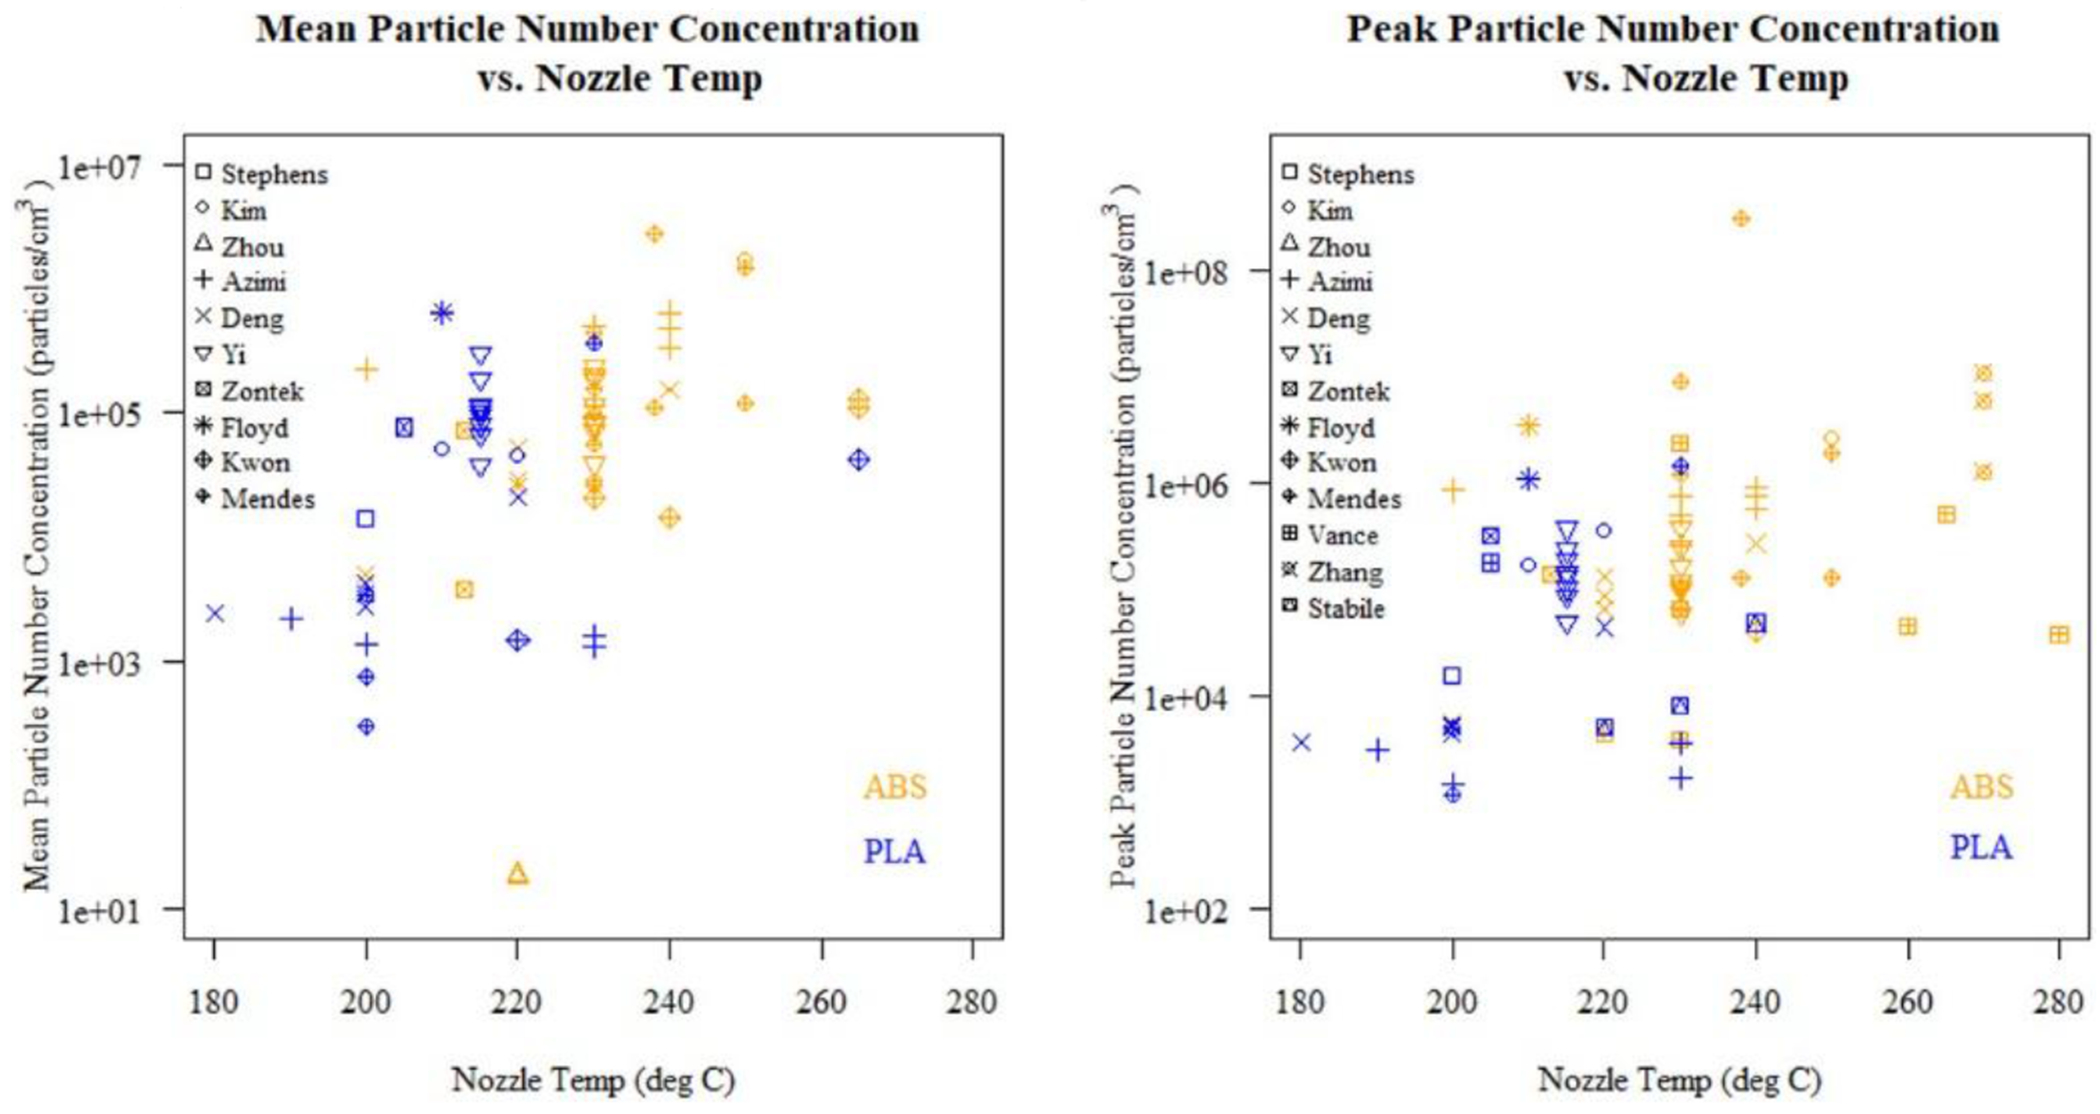
Fused deposition modeling (FDM) 3D printers, the most popular choice among home hobbyists, have been shown to release volatile organic chemicals (VOCs) and billions of airborne particles per minute, indicating the potential for consumer inhalation exposure and consequent health risks. Publications on FDM 3D printer emissions however, contain large heterogeneity of testing methods and analytical procedures making it difficult to reach overall conclusions for particle characteristics or particle number emission rates across the field. In this publication, data were collected over the printing time from 3D printer emission studies including particle count diameters (PCDs) (nanometers), particle number concentrations (PNCs) (particles/cm3), and particle number emission rates (PNERs) (particles min-1). Despite heterogeneity in methods, the majority of particles released were reported as ultrafine in size (i.e., <100 nm) indicating that using both acrylonitrile butadiene styrene (ABS) and poly-lactic acid (PLA) may present a risk of exposure to respirable particles. Mean PNC emitted in 3D printing tests ranged over several orders of magnitude across publications with overall means of 300,980 particles/cm3 for ABS and 65,482 particles/cm3 for PLA. Although mean PNC data were available from only 7 of the 16 papers reviewed, ABS resulted in greater particle numbers than PLA suggesting increased exposure to ultrafine particles. A linear mixed model was fitted for mean PNCs to further explore the impact of nozzle temperature and filament material. Finally, the PNER calculation method especially regarding losses, varied widely across studies, and directly impacted the PNERs reported. To strengthen direct comparability of results going forward, it is recommended that standard emissions testing protocols be developed for FDM 3D printers and particle influxes and losses be more uniformly calculated.
Keywords: ABS; Emission rate; Filament; PLA; Ultrafine.
Copyright © 2018 Elsevier B.V. All rights reserved.
Conflict of interest statement
Conflicts of interest
The authors have no conflict of interest.
Figures


References
-
- Azimi P, Zhao D, Pouzet C, Crain NE, Stephens B, 2016. Emissions of ultrafine particles and volatile organic compounds from commercially available desktop threedimensional printers with multiple filaments. Environ. Sci. Technol 50 (3), 1260–1268. - PubMed
-
- Barthel M, Seeger S, Rothhardt M, Wilke O, Horn W, Juritsch E, … Jann O, 2013. Measurement of Fine and Ultrafine Particles From Office Devices During Printing in Order to Develop a Test Method for the Blue Angel Ecolabel for Office-based Printing Devices.
-
- Coré-Baillais Marine, Bensoussan H, Richardot A, Kusnadi H, 2017. The State of 3D Printing Edition 2017.
-
- Dempster A, Patel C, Selwyn M, Roth A, 1984. Statistical and computational aspects of mixed model analysis. Appl. Stat 33 (2), 203–214.
Grants and funding
LinkOut - more resources
Full Text Sources
Miscellaneous
