. 2019 Jan 15;50(1):253-271.e6.
doi: 10.1016/j.immuni.2018.11.004. Epub 2018 Nov 21.

Single-Cell RNA Sequencing of Microglia throughout the Mouse Lifespan and in the Injured Brain Reveals Complex Cell-State Changes

Affiliations

Single-Cell RNA Sequencing of Microglia throughout the Mouse Lifespan and in the Injured Brain Reveals Complex Cell-State Changes

Timothy R Hammond et al. Immunity. .

Abstract

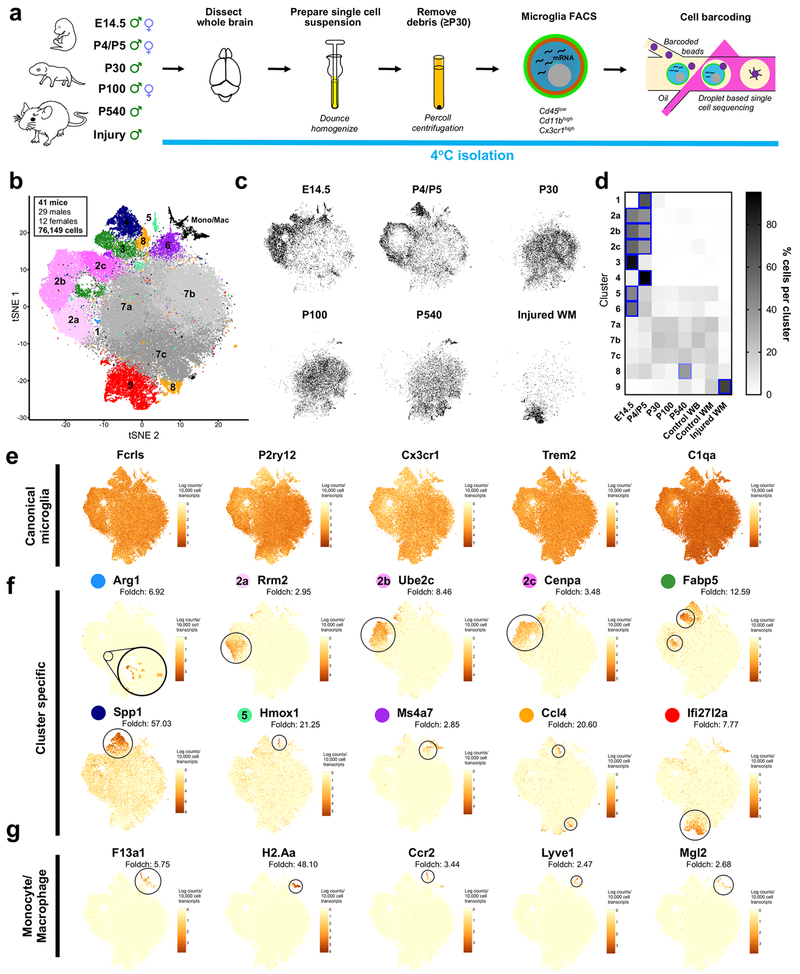
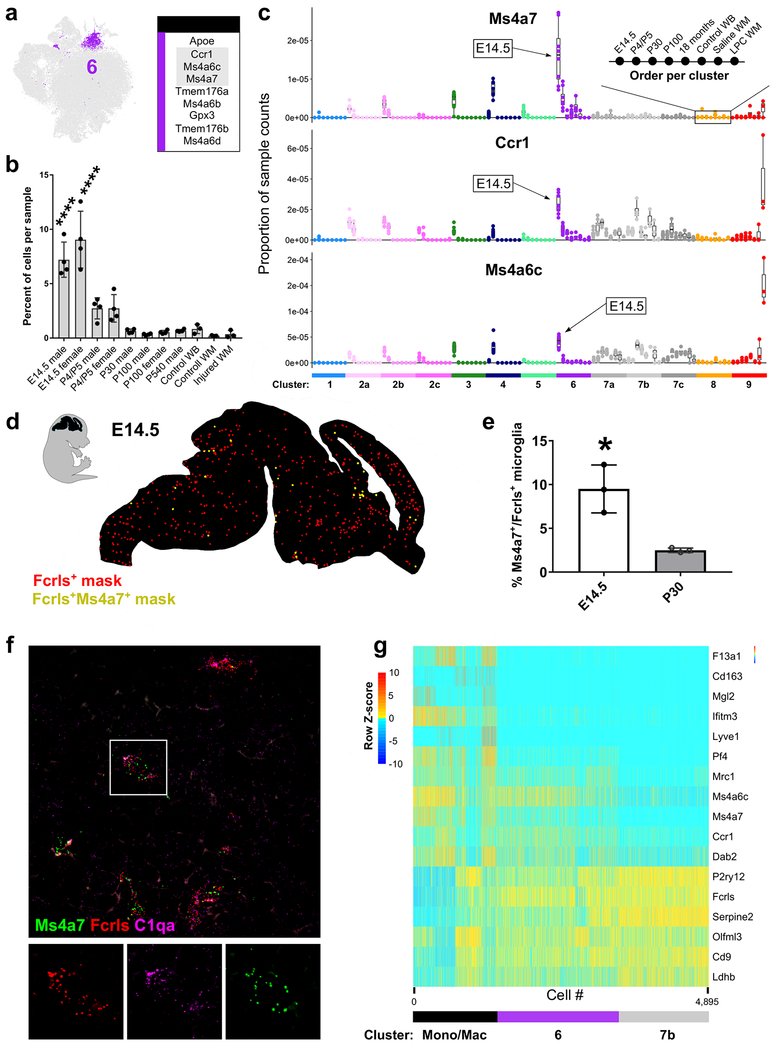
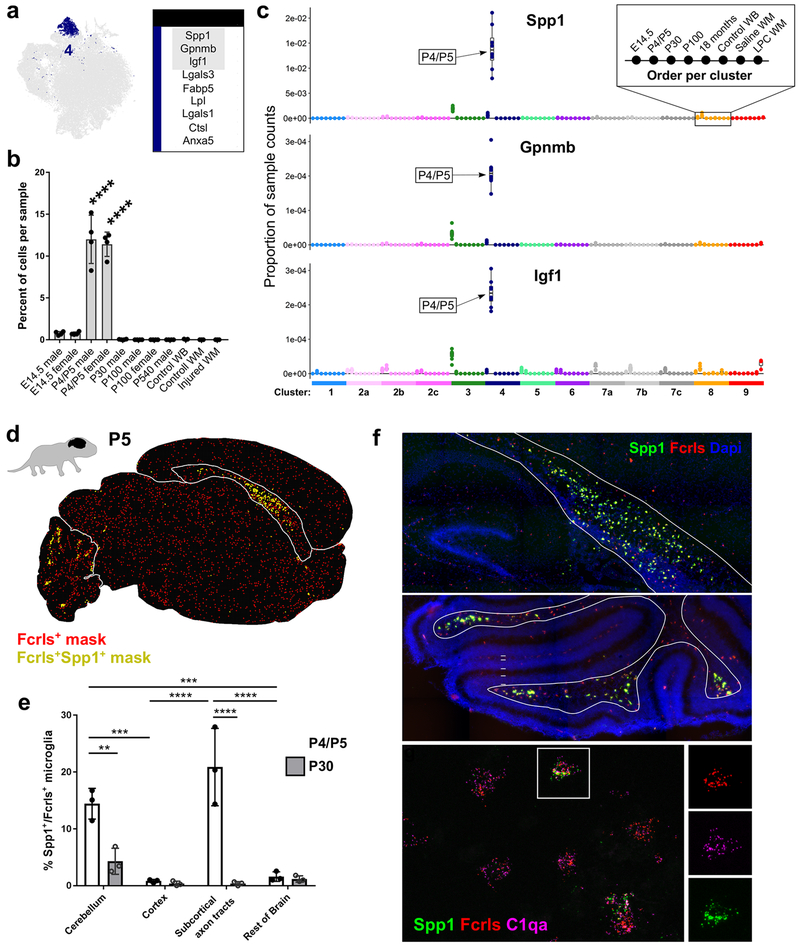
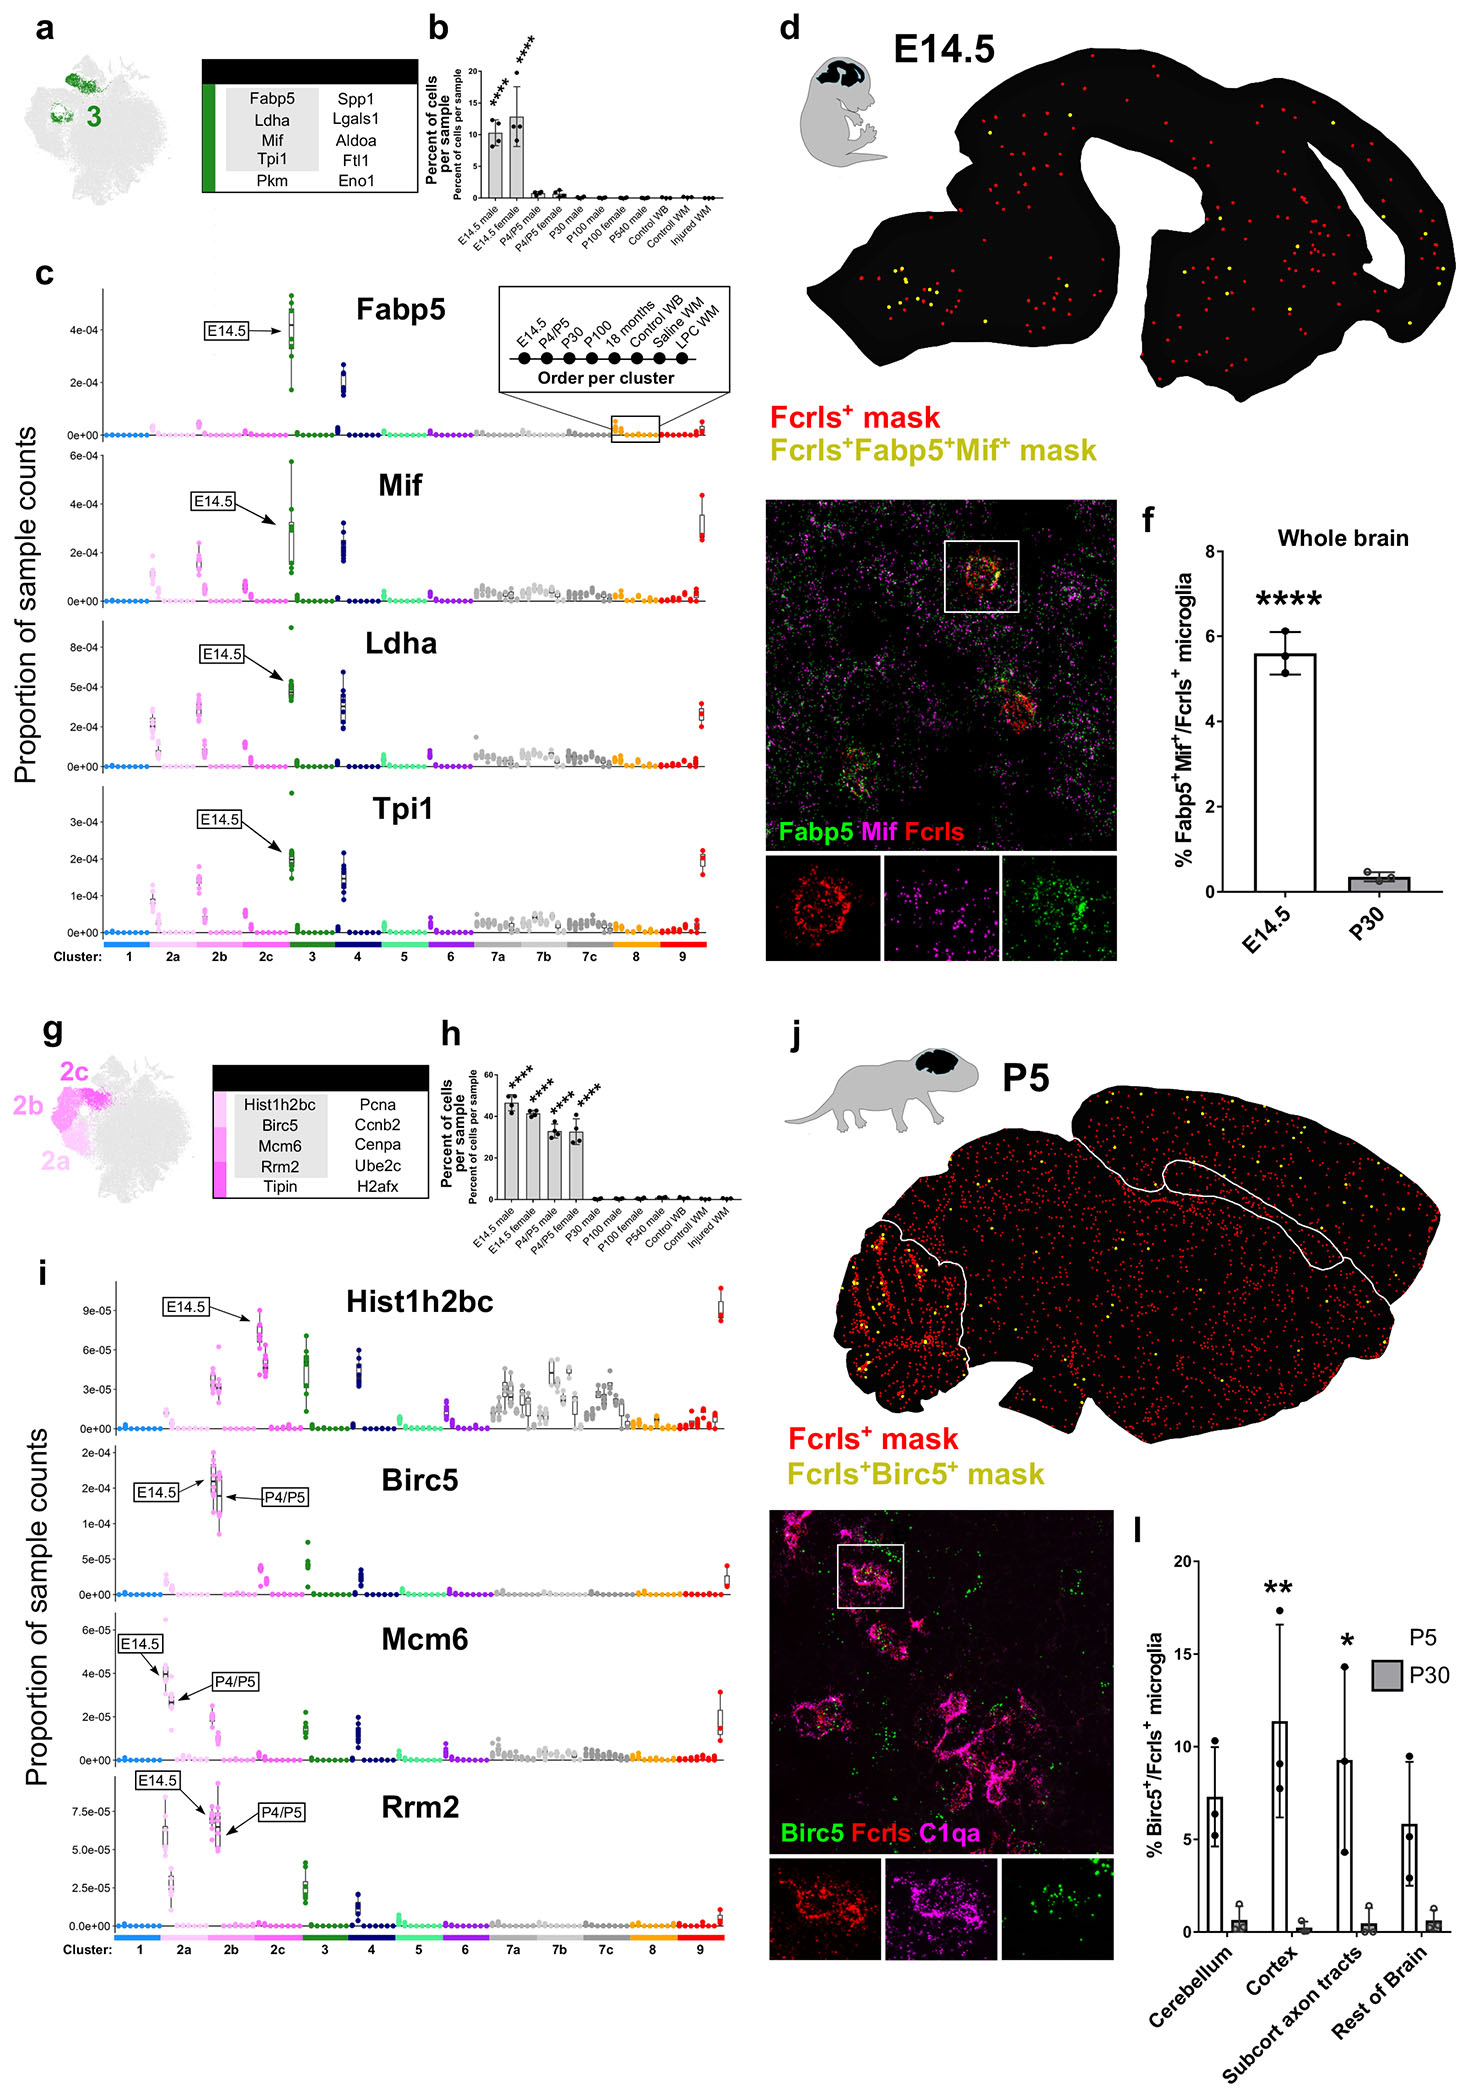
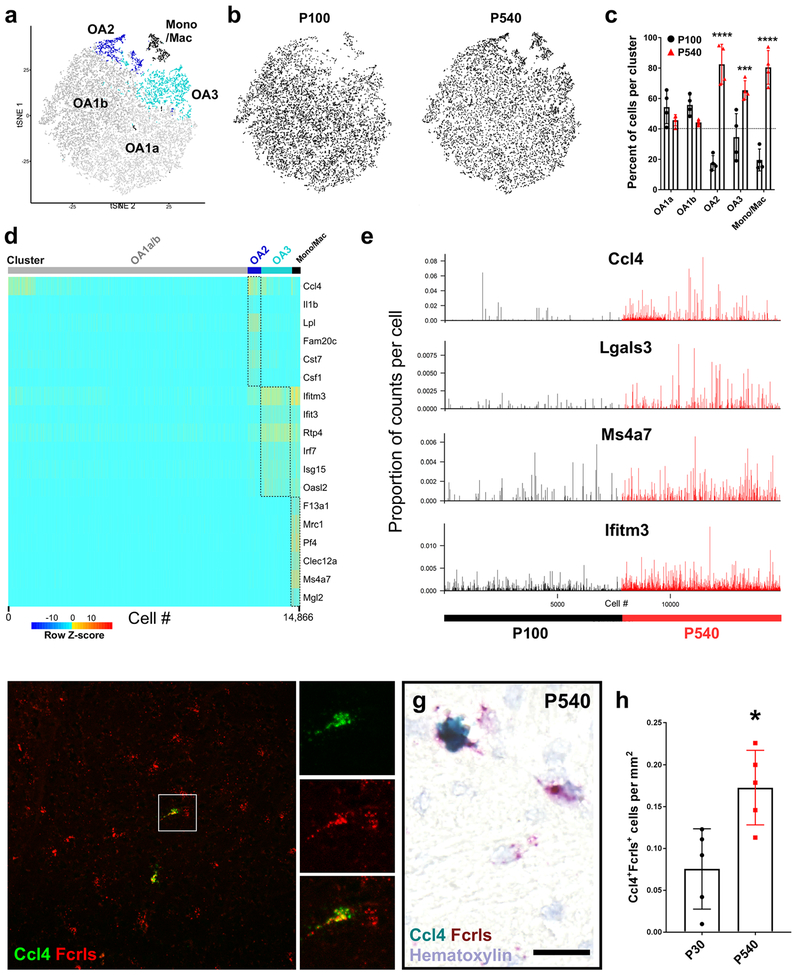
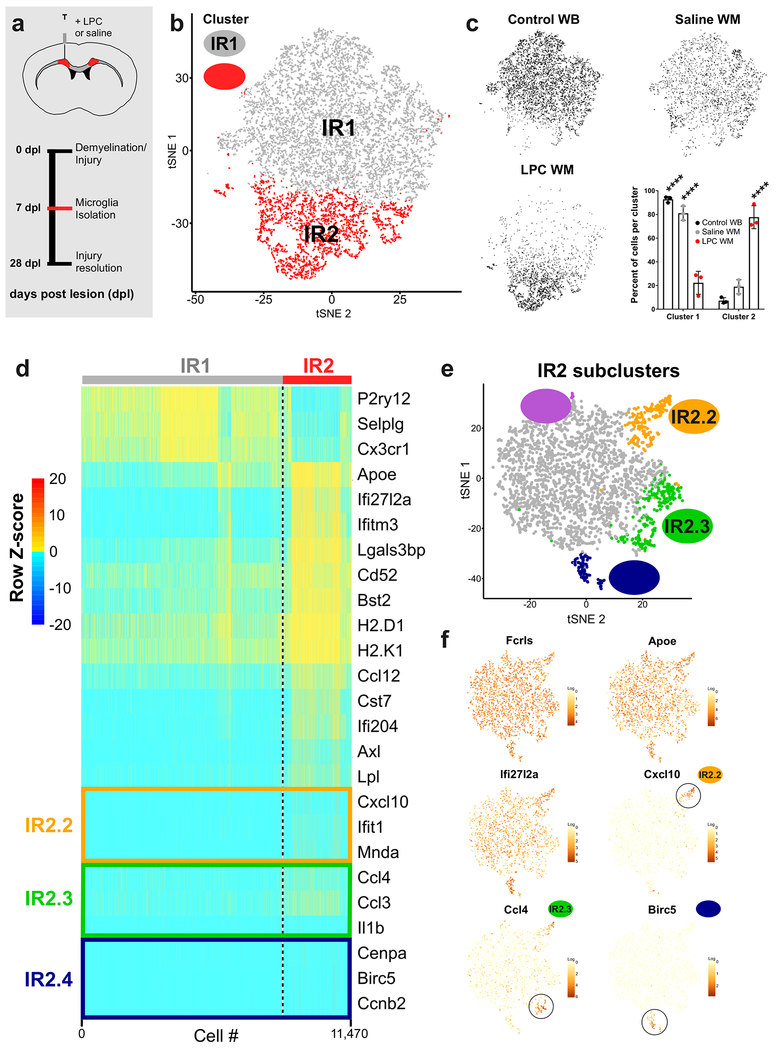
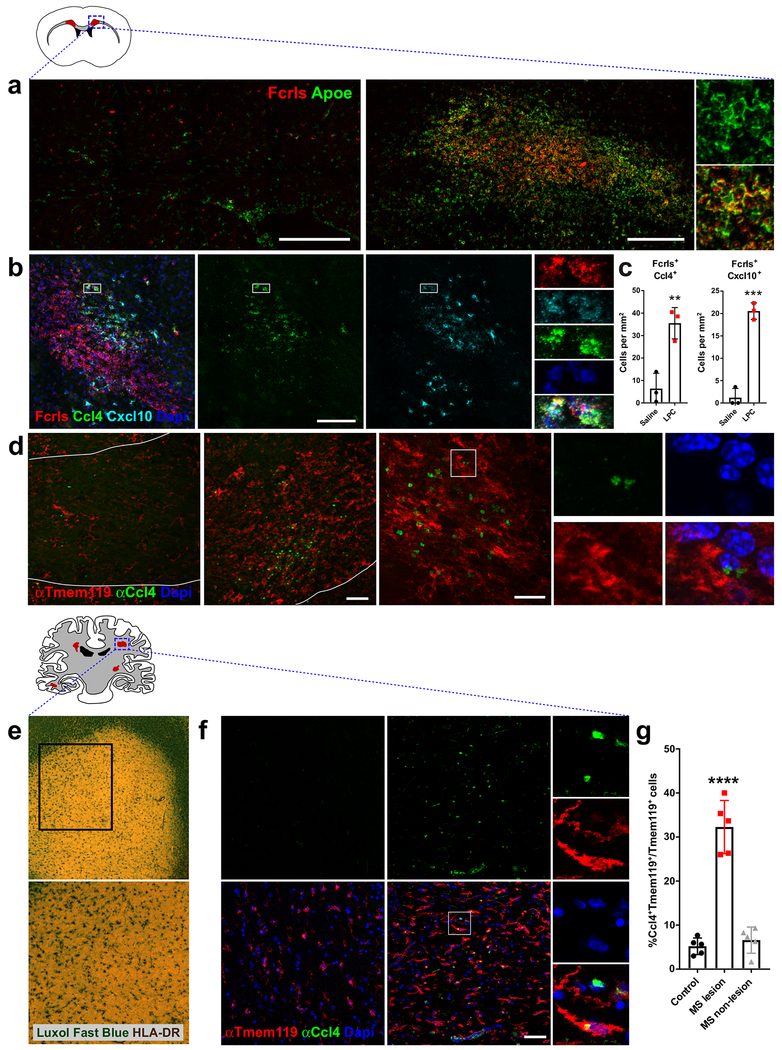
Microglia, the resident immune cells of the brain, rapidly change states in response to their environment, but we lack molecular and functional signatures of different microglial populations. Here, we analyzed the RNA expression patterns of more than 76,000 individual microglia in mice during development, in old age, and after brain injury. Our analysis uncovered at least nine transcriptionally distinct microglial states, which expressed unique sets of genes and were localized in the brain using specific markers. The greatest microglial heterogeneity was found at young ages; however, several states-including chemokine-enriched inflammatory microglia-persisted throughout the lifespan or increased in the aged brain. Multiple reactive microglial subtypes were also found following demyelinating injury in mice, at least one of which was also found in human multiple sclerosis lesions. These distinct microglia signatures can be used to better understand microglia function and to identify and manipulate specific subpopulations in health and disease.

Keywords: activation; brain; demyelination; development; diversity; glia; heterogeneity; injury; microglia; single-cell RNA seq.


Conflict of interest statement

Declaration of interests

The authors declare no competing interests.

Figures

Figure 1.
Figure 1.. Molecularly distinct subpopulations of microglia peak in number during early development, expand in aging, and emerge following injury. See also Figures S1 and S2.
(a) Microglia were isolated from the whole brains of mice from E14.5 until P540 and from focal demyelinated white matter lesions (Injury). Microglia were isolated under cold conditions to limit ex vivo activation. FACS purified, and single cell sequenced. (b) tSNE plot of 76,149 cells. In total, nine microglia clusters and one monocyte/macrophage (Mono/Mac)-containing cluster were identified. N=41 mice. (c) tSNE plots of cells from each age and condition. Only male samples were plotted. (d) Heatmap of the normalized percent of cells from each sample assigned to each cluster. Blue squares = increase in cells for a given age/condition (P<0.0001). Two-way ANOVA with Tukey’s post-hoc analysis. (e) tSNE plot colored for expression (log-transformed UMI counts per 10,000 transcripts) of canonical microglial genes. (f) tSNE plot of expression for genes specifically upregulated in each of the microglial clusters. (g) tSNE plot of expression for genes specifically upregulated in the monocyte and macrophage cluster.
Figure 2.
Figure 2.. Identification of Ms4a7-expressing microglia in the embryonic brain that resemble brain border macrophages See also Figures S4 and S5.
(a) tSNE plot of Cluster 6 microglia and a table of the top nine upregulated genes in that cluster. Gray outlined genes are plotted in (c). (b) Plot of the percent of cells per sample that were assigned to Cluster 6. ****P<0.0001. ANOVA with Tukey’s posthoc analysis. (c) Plot of the proportion of normalized UMI counts per sample (summed cell counts) for cells assigned to each cluster for the top genes in Cluster 6. Sample order per cluster is listed in the inset. (d) Representive image of masked microglia from high-throughput smFISH analysis in a E14.5 saggital brain section. Fcrls+ only, red or Fcrls+Ms4a7+, yellow. Hb=hindbrain, Mb=midbrain, Fb=forebrain, Nctx=neocortex. (e) Quantification of the percent of Fcrls+ microglia that also expressed Ms4a7 from smFISH analysis. N= 3 mice . *P<0.05, Unpaired t-test. (f) High-magnification confocal image of E14.5 brain section of the intermediate zone of the telencephalon stained by smFISH with probes Fcrls, C1qa and, Ms4a7. Scale bar = 20 μm. (g) Heatmap of gene expression from 4,895 cells in the Mono/Mac cluster, Cluster 6, and a subset of 1500 mature/homeostatic microglia from Cluster 7b. Z-score represents the number of standard deviations from the mean following row scaling.
Figure 3.
Figure 3.. Spp1-expressing axon tract-associated microglia (ATM) densely occupy the early postnatal brain. See also Figures S4 and S5.
(a) tSNE plot of Cluster 4 microglia and a table of the top nine upregulated genes in that cluster. Gray outlined genes are plotted in (c). (b) Plot of the percent of cells per sample that were assigned to Cluster 4. ****P<0.0001. ANOVA with Tukey’s post-hoc analysis. (c) Plot of the proportion of normalized UMI counts per sample (summed cell counts) for cells assigned to each cluster for the top genes in Cluster 4. Sample order per cluster is listed in the inset. (d) Representive image of masked microglia from high-throughput smFISH analysis in a P5 saggital brain section. Fcrls+ only,red or Fcrls+Spp1+ ,yellow. Cbm=cerebellum, Rob=rest of brain, Cc=Corpus callosum, Ctx=cortex. (e) Quantification of the percent of Fcrls+ microglia that also expressed Spp1 from smFISH analysis. N=3 mice and four brain regions were analyzed. ****P<0.0001, ***P<0.001, Two-way ANOVA, Tukey’s post-hoc analysis. (f) Images of the P5 cerebellum and subcortical axon tracts of the corpus callosum stained by smFISH. Top two panels were stained with probes Fcrls and Spp1. Nuclei are marked by DAPI. Top panel, Hpc=hippocampus, Cp=choroid plexus, Lv=lateral ventricle, Cc=corpus callosum, Ctx=cortex. Middle panel, Men=meninges, Egl=external granular layer, Pcl=Purkinje cell layer, Igl=internal granular layer, Axtr=axon tracts. Lower panel was stained with probes Fcrls, C1qa and Spp1.. Scale = 200 μm (top panels), 20 μm (lower panel).
Figure 4.
Figure 4.. Metabolically active and proliferative microglial subpopulations dominate early brain development. See also Figures S4 and S5.
(a) tSNE plot of Cluster 3 microglia and a table of the top ten upregulated genes in that cluster. Gray outlined genes are plotted in (c). (b) Plot of the percent of cells per sample that were assigned to Cluster 3. ****P<0.0001. ANOVA with Tukey’s posthoc analysis. (c) Plot of the proportion of normalized UMI counts per sample (summed cell counts) for cells assigned to each cluster for the top genes in Cluster 3. Sample order per cluster is listed in the inset. The age where Cluster 3 counts are most elevated are labeled with an arrow. (d) Representive image of masked microglia from high-throughput smFISH analysis in an E14.5 saggital brain section. Fcrls+ only, red) or Fcrls+Fabp5+Mif+, yellow. Hb=hindbrain, Mb=midbrain, Fb=forebrain, Nctx=neocortex. (e) High-magnification confocal image of the P5 ventral pallium stained by smFISH with probes Fcrls, C1qa, Fabp5, and Mif. Scale bar = 20 μm. (f) Quantification of the percent of Fcrls+ microglia that also expressed Fabp5 and Mif from smFISH analysis. N=3 mice. ****P<0.0001, ***P<0.001, Two-way ANOVA, Tukey’s post-hoc analysis. (g) tSNE plot of Cluster 2 (a-c) microglia and a table of the top ten upregulated genes in those clusters. Gray outlined genes are plotted in (c). (h) Plot of the percent of cells per sample that were assigned to Cluster 2. ****P<0.0001. ANOVA with Tukey’s post-hoc analysis. (i) Plot of the proportion of normalized UMI counts per sample (summed cell counts) for cells assigned to each cluster for the top genes in Cluster 2. Sample order per cluster is listed in the inset. (j) Representive image of masked microglia from high-throughput smFISH analysis in a P5 saggital brain section. Fcrls+ only, red Fcrls+Birc5+, yellow. Cbm=cerebellum, Rob=rest of brain, Cc=Corpus callosum, Ctx=cortex. (k) High-magnification confocal image of the P5 cerebellum stained by smFISH with probes Fcrls, C1qa, and Birc5. Scale bar = 20 μm. (l) Quantification of the percent of Fcrls+ microglia that also expressed Birc5 from smFISH analysis. N=3 mice. ****P<0.0001, ***P<0.001, Two-way ANOVA, Tukey’s post-hoc analysis.
Figure 5.
Figure 5.. Aging drives varied inflammatory states in microglia subpopulations.
(a) tSNE plot of 14,866 microglia from P100 and P540 (18 month) male mice (n = 4 per age) shows four microglia clusters (OA 1a, 1b, 2, 3) and one cluster of brain border macrophages (Mono/Mac). (b) Locations of cells from each age on the same tSNE plot as in (a). (c) Plot of the normalized percent of cells from each cluster derived from each age. ****P<0.0001, ***P<0.001, Twoway ANOVA, Tukey’s post-hoc analysis. (d) Heatmap of gene expression in each of 14,886 cells in each of the clusters from (a). Plotted genes are some of the top genes for each cluster. Z-score represents the number of standard deviations from the mean following row scaling. (e) Plot of the number of log-transformed UMI counts per 10,000 cell transcripts in all 14,886 microglia isolated from P100 and P540 samples. (f) Representative low-magnification flourescent smFISH image of Fcrls+ (red) and Ccl4+ (green) cells in the P540 hindbrain. Scale bar = 25 μm. (g) Representative high-magnification chromogenic ISH image of Fcrls+ (red) and Fcrls+Ccl4+ (red and turquoise) cells in the P540 hindbrain. Scale bar = 25 μm. (h) Quantification of Ccl4+Fcrls+ microglia per square millimeter in the P30 and P540 brain. N=5 mice. *P<0.05. unpaired t-test.
Figure 6.
Figure 6.. Injury-responsive microglia in demyelinated lesions exhibit multiple activation states. See also Figures S7.
(a) The subcortical white matter of adult mice was injected with the demyelinating agent lysolecithin (LPC) or saline and microdissected after 7 days post lesion/injection (dpl). Microglia were then isolated and sequenced (as is Fig 1a) (b) tSNE plot of 11,470 microglia from LPC-injected white matter, saline-injected white matter, or whole-brain adult (P100) samples reveals two microglia clusters (IR1, IR2). N=3 mice per condition. (c) tSNE plots of cells from each condition and a plot of the normalized percent of cells from each sample assigned to each cluster. ****P<0.0001, Two-way ANOVA, Tukey’s post-hoc analysis. (d) Heatmap of gene expression in each of 11,470 cells in each of the clusters from (b). Plotted genes were grouped by genes that were downregulated (P2ry12, Selplg, Cx3cr1) in Cluster IR2 or those that defined each of the subclusters in Fig. 6e. Z-score represents the number of standard deviations from the mean following row scaling. (e) Cells from Cluster IR2 were subclustered to identify different subpopulations of activated microglia. tSNE plot shows four subclusters of Cluster 2 microglia (2.1-2.4). (f) tSNE plots of subclustered cells colored for expression (log-transformed counts per 10,000 transcripts) of genes that were expressed by the majority of Cluster IR2 microglia (Fcrls, Apoe, Ifi27l2a), or Cluster IR2 subpopulations (Ccl4 (IR2.3, IR2.3), Cxcl10 (IR2.2), and Birc5 (IR2.4).
Figure 7.
Figure 7.. Different subpopulations of activated microglia are found in spatially restricted areas of mouse demyelinated lesions and human MS lesions.
(a) Confocal images of saline- and LPC-injected white matter in adult mice stained by smFISH for the microglial probe Fcrls and activation marker Apoe. Str=striatum, Cg=cingulum, Lv=lateral ventricle, Cc=corpus callosum. Injection site/lesion outlined with white dotted line. Scale bar = 250 μm. (b) Confocal image of LPC-injected demyelinated lesion stained by smFISH for the probes Fcrls, Ccl4, and Cxcl10. Scale bar = 100 μm. (c) smFISH quantification of the percent of Fcrls+ microglia in saline- and LPC-injected white matter that co-expressed markers Ccl4 and Cxcl10. N=3 mice, ***P<0.001, **P<0.01, unpaired t-test. (d) Confocal images of saline- and LPC-injected white matter stained with antibodies to recognize Ccl4 and resident microglia marker Tmem119. Left scale bar =50 μm, right scale bar=20 μm. (e) Low-magnification images of demyelinated active MS lesions stained with Luxol Fast Blue (myelin) and anti-HLADR antibody (microglia/immune cells). (f) Confocal images of control and human MS white matter stained with antibodies to recognize Ccl4 and resident microglia marker Tmem119 and DAPI+ cell nuclei. Scale bar = 50 μm. (g) Quantification of the percent of Ccl4+Tmem119+ microglia in control patients, active MS lesions, and unaffected white matter in MS patients. N=5 patients per condition, ****P<0.0001, one-way ANOVA, Tukey’s post-hoc analysis

Comment in

References

    1. Baruch K, Deczkowska A, David E, Castellano JM, Miller O, Kertser A, Berkutzki T, Barnett-Itzhaki Z, Bezalel D, Wyss-Coray T, et al. (2014). Aging. Aging-induced type I interferon response at the choroid plexus negatively affects brain function. Science 346, 89–93. - PMC - PubMed
    1. Bennett FC, Bennett ML, Yaqoob F, Mulinyawe SB, Grant GA, Hayden Gephart M, Plowey ED, and Barres BA (2018). A Combination of Ontogeny and CNS Environment Establishes Microglial Identity. Neuron. - PMC - PubMed
    1. Bennett ML, Bennett FC, Liddelow SA, Ajami B, Zamanian JL, Fernhoff NB, Mulinyawe SB, Bohlen CJ, Adil A, Tucker A, et al. (2016). New tools for studying microglia in the mouse and human CNS. Proc Natl Acad Sci U S A 113, E1738–1746. - PMC - PubMed
    1. Butler A, Hoffman P, Smibert P, Papalexi E, and Satija R (2018). Integrating single-cell transcriptomic data across different conditions, technologies, and species. Nat Biotechnol 36, 411–420. - PMC - PubMed
    1. Butovsky O, Jedrychowski MP, Moore CS, Cialic R, Lanser AJ, Gabriely G, Koeglsperger T, Dake B, Wu PM, Doykan CE, et al. (2014). Identification of a unique TGF-beta-dependent molecular and functional signature in microglia. Nat Neurosci 17, 131–143. - PMC - PubMed

Publication types