. 2018 Dec 3;28(23):3736-3747.e3.
doi: 10.1016/j.cub.2018.09.055. Epub 2018 Nov 21.

Hypothalamic Neurons that Regulate Feeding Can Influence Sleep/Wake States Based on Homeostatic Need

Affiliations

Hypothalamic Neurons that Regulate Feeding Can Influence Sleep/Wake States Based on Homeostatic Need

Nitsan Goldstein et al. Curr Biol. .

Abstract

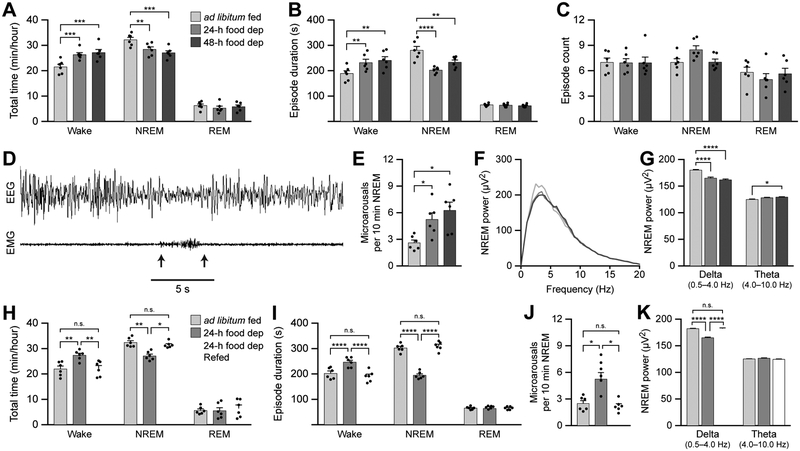
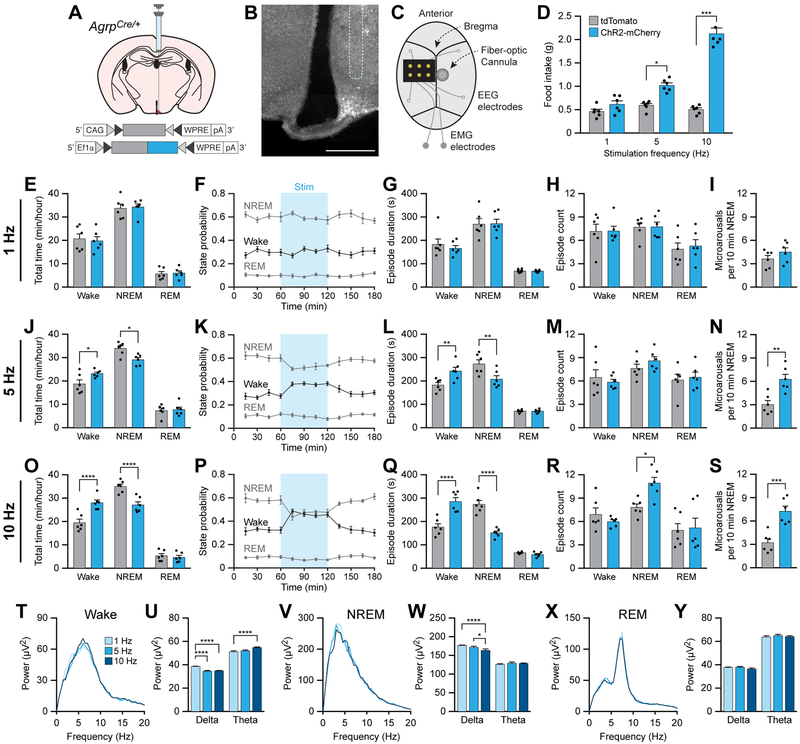
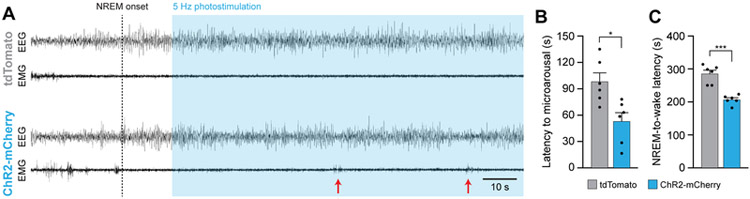
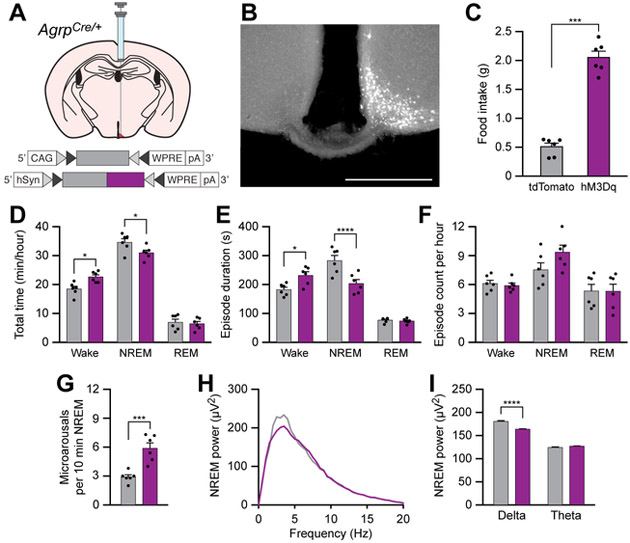
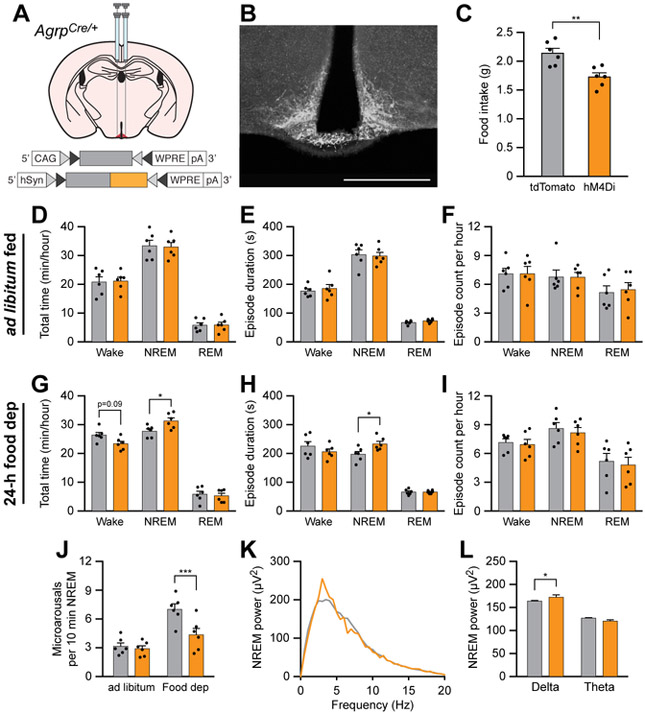
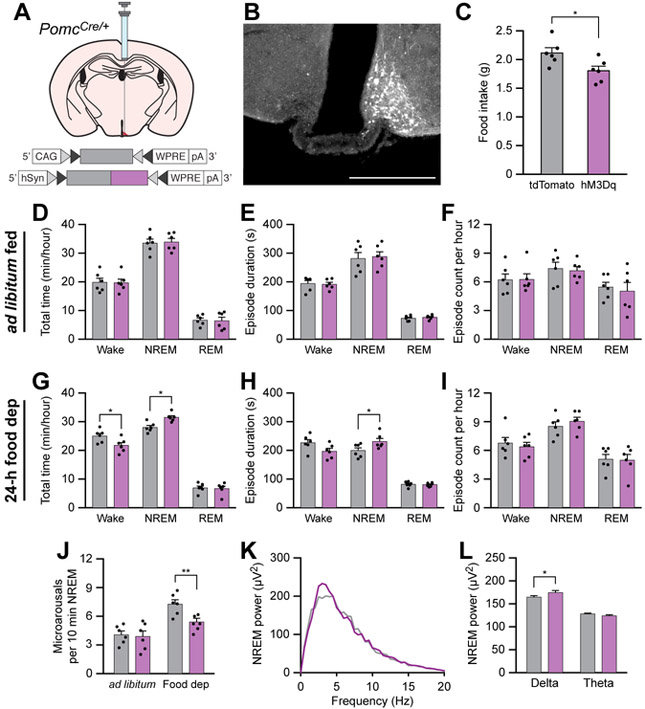
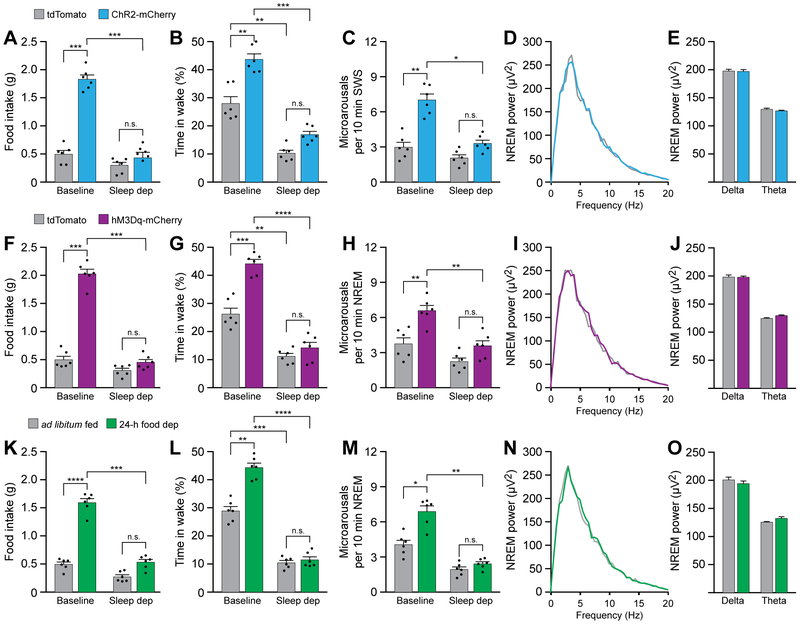
Eating and sleeping represent two mutually exclusive behaviors that satisfy distinct homeostatic needs. Because an animal cannot eat and sleep at the same time, brain systems that regulate energy homeostasis are likely to influence sleep/wake behavior. Indeed, previous studies indicate that animals adjust sleep cycles around periods of food need and availability. Furthermore, hormones that affect energy homeostasis also affect sleep/wake states: the orexigenic hormone ghrelin promotes wakefulness, and the anorexigenic hormones leptin and insulin increase the duration of slow-wave sleep. However, whether neural populations that regulate feeding can influence sleep/wake states is unknown. The hypothalamic arcuate nucleus contains two neuronal populations that exert opposing effects on energy homeostasis: agouti-related protein (AgRP)-expressing neurons detect caloric need and orchestrate food-seeking behavior, whereas activity in pro-opiomelanocortin (POMC)-expressing neurons induces satiety. We tested the hypotheses that AgRP neurons affect sleep homeostasis by promoting states of wakefulness, whereas POMC neurons promote states of sleep. Indeed, optogenetic or chemogenetic stimulation of AgRP neurons in mice promoted wakefulness while decreasing the quantity and integrity of sleep. Inhibition of AgRP neurons rescued sleep integrity in food-deprived mice, highlighting the physiological importance of AgRP neuron activity for the suppression of sleep by hunger. Conversely, stimulation of POMC neurons promoted sleep states and decreased sleep fragmentation in food-deprived mice. Interestingly, we also found that sleep deprivation attenuated the effects of AgRP neuron activity on food intake and wakefulness. These results indicate that homeostatic feeding neurons can hierarchically affect behavioral outcomes, depending on homeostatic need.

Keywords: AgRP; POMC; agouti-related protein; appetite; chemogenetics; homeostasis; optogenetics; pro-opiomelanocortin; sleep.


Figures

Figure 1.
Figure 1.. Food deprivation increases wakefulness and disrupts sleep integrity.
(A-C) The total time (A), episode duration (B), and episode count (C) of wake, NREM sleep, and REM sleep states in ad libitum fed mice and 24-h and 48-h food deprived mice. (D) Representative recording of a microarousal event during NREM sleep. Arrows represent the onset and offset of the microarousal. (E) Frequency of microarousals during NREM sleep in ad libitum fed mice and 24-h and 48-h food deprived mice. (F) Power spectra of EEG recorded during NREM sleep. (G) The average EEG power density in the delta (0.5-4 Hz) and theta (4-10 Hz) bands. (H-I) The total time (H) and episode duration (I) of wake, NREM sleep, and REM sleep states in ad libitum fed mice, 24-h food deprived mice, and 24-h food deprived mice allowed to re-feed for 2 h. (J) Frequency of microarousals during NREM sleep. (K) The average EEG power density in the delta (0.5-4 Hz) and theta (4-10 Hz) bands. Data represent the mean ± standard error of the mean (SEM). Dots represent individual experimental animals. Post hoc comparisons: n.s. = not significant (p>0.05); *p<0.05, **p<0.01, ***p<0.001, ****p<0.0001; also see Table S1 for additional statistical information.
Figure 2.
Figure 2.. Optogenetic stimulation of AgRP neurons increases wakefulness and disrupts sleep integrity.
(A) Diagram showing viral injection strategy to unilaterally target AgRP neurons with tdTomato or ChR2-mCherry. (B) Representative photomicrograph showing AgRP neurons expressing ChR2-mCherry. Dashed line shows approximate location of cannula track. Scale bar, 500 μm. (C) Diagram showing placement of EEG/EMG implant, EEG electrodes, and fiber-optic cannula on the skull. EMG electrodes were placed within the nuchal musculature. (D) Optogenetic stimulation of AgRP neurons for 1 h at 5 or 10 Hz increases food intake. (E-I) Optogenetic stimulation of AgRP neurons for 1 h at 1 Hz does not affect (E) the total time (F) state probability, (G) episode duration, or (H) episode count of wake, NREM sleep, and REM sleep states, nor does it affect (I) the frequency of microarousal events during NREM sleep. (J-N) Optogenetic stimulation of AgRP neurons for 1 h at 5 Hz (J,K) increases total time in wakefulness and decreases total time in NREM sleep, (L) increases wake and decreases NREM sleep episode duration, and (N) increases the frequency of microarousal events during NREM sleep, but (M) does not affect the number of wake, NREM sleep, or REM sleep episodes. (O-S) Optogenetic stimulation of AgRP neurons for 1 h at 10 Hz (O,P) increases total time in wakefulness and decreases total time in NREM sleep, (Q) increases wake and decreases NREM sleep episode duration, (R) increases the number of NREM sleep episodes, and (S) increases the frequency of microarousal events during NREM sleep. (T and U) Power spectra of EEG recorded during wakefulness (T), and (U) the average EEG power density in the delta and theta bands. (V and W) Power spectra of EEG recorded during NREM sleep (V), and (W) the average EEG power density in the delta and theta bands. (X and Y) Power spectra of EEG recorded during REM sleep (X), and (Y) the average EEG power density in the delta and theta bands. Data represent the mean ± standard error of the mean (SEM). Dots represent individual experimental animals. T-tests and post hoc comparisons: *p<0.05, **p<0.01, ***p<0.001, ****p<0.0001; also see Table S1.
Figure 3.
Figure 3.. Acute optogenetic stimulation of AgRP neurons increases microarousals during NREM sleep and decreases the NREM sleep -to-wake latency.
(A) Representative EEG/EMG traces from an AgrpCre/+ animal transduced with tdTomato (top) or ChR2-mCherry (bottom). Vertical dashed line shows the onset of NREM sleep. Blue shading depicts period of 5 Hz photostimulation for 1 s every 3 s. Red arrows show microarousal events. (B) Latency to the first microarousal event following the onset of photostimulation. (C) Latency to the first full transition from NREM sleep to wakefulness following the onset of photostimulation. Data represent the mean ± standard error of the mean (SEM). Dots represent individual experimental animals. T-tests: *p<0.05, ***p<0.001; also see Table S1.
Figure 4.
Figure 4.. Chemogenetic stimulation of AgRP neurons increases wakefulness and disrupts sleep integrity.
(A) Diagram showing viral injection strategy to unilaterally target AgRP neurons with tdTomato or hM3Dq-mCherry. (B) Representative photomicrograph showing AgRP neurons expressing hM3Dq-mCherry. Scale bar, 500 μm. (C) Chemogenetic stimulation of AgRP neurons for 1 h increases food intake. (D-F) Chemogenetic stimulation of AgRP neurons (D) increases wakefulness and decreases NREM sleep, (E) increases wake and decreases NREM sleep episode duration, and (F) does not affect the number of wake, NREM sleep, or REM sleep episode counts. (G) Chemogenetic stimulation of AgRP neurons increases the frequency of microarousals during NREM sleep. (H-I) Chemogenetic stimulation of AgRP neurons decreases the delta power spectra of EEG recorded during NREM sleep. Data represent the mean ± standard error of the mean (SEM). Dots represent individual experimental animals. T-tests and post hoc comparisons: *p<0.05, ***p<0.001, ****p<0.0001; also see Table S1
Figure 5.
Figure 5.. Chemogenetic inhibition of AgRP neurons rescues sleep integrity in food-deprived animals.
(A) Diagram showing viral injection strategy to bilaterally target AgRP neurons with tdTomato or hM4Di-mCherry. (B) Representative photomicrograph showing AgRP neurons expressing hM4Di-mCherry. Scale bar, 500 μm. (C) Chemogenetic inhibition of AgRP neurons for 4 h decreases food intake in ad libitum fed mice. (D-F) Chemogenetic inhibition of AgRP neurons for 1 h in ad libitum fed mice does not affect (D) the total time, (E) episode duration, or (F) episode count of wake, NREM sleep, and REM sleep states. (G-I) Chemogenetic inhibition of AgRP neurons for 1 h in 24-h food deprived mice (G) decreases wakefulness and increases NREM sleep, (H) increases NREM sleep episode duration, and (I) does not affect the number of wake, NREM sleep, or REM sleep episodes. (J) Chemogenetic inhibition of AgRP neurons for 1 h decreases the frequency of microarousals in 24-h food deprived mice. (K and L) Chemogenetic inhibition of AgRP neurons increases the delta power spectra of EEG recorded during NREM sleep of 24-h food deprived mice. Data represent the mean ± standard error of the mean (SEM). Dots represent individual experimental animals. T-tests and post hoc comparisons: *p<0.05, ***p<0.001; also see Table S1.
Figure 6.
Figure 6.. Chemogenetic stimulation of POMC neurons rescues sleep integrity in food-deprived animals.
(A) Diagram showing viral injection strategy to unilaterally target POMC neurons with tdTomato or hM3Dq-mCherry. (B) Representative photomicrograph showing POMC neurons expressing hM3Dq-mCherry. Scale bar, 500 μm. (C) Chemogenetic stimulation of POMC neurons for 4 h decreases food intake in ad libitum fed mice. (D-F) Chemogenetic stimulation of POMC neurons for 1 h in ad libitum fed mice does not affect (D) the total time, (E) episode duration, or (F) episode count of wake, NREM sleep, and REM sleep states. (G-I) Chemogenetic stimulation of POMC neurons for 1 h in 24-h food deprived mice (G) decreases wakefulness and increases NREM sleep, (H) increases NREM sleep episode duration, and (I) does not affect the number of wake, NREM sleep, or REM sleep episodes. (J) Chemogenetic stimulation of POMC neurons for 1 h decreases the frequency of microarousals in 24-h food deprived mice. (K and L) Chemogenetic stimulation of POMC neurons increases the delta power spectra of EEG recorded during NREM sleep of 24-h food deprived mice. Data represent the mean ± standard error of the mean (SEM). Dots represent individual experimental animals. T-tests and post hoc comparisons: *p<0.05, ***p<0.001; also see Table S1.
Figure 7.
Figure 7.. Sleep deprivation attenuates AgRP neuron-mediated promotion of feeding and wakefulness.
(A-E) 6 h sleep deprivation attenuates the effects of optogenetic stimulation of AgRP neurons on feeding and sleep/wake architecture. (A) 6 h sleep deprivation blocks AgRP neuron-mediated increases in feeding. (B) 6 h sleep deprivation blocks increases in wakefulness and (C) the frequency of microarousals in NREM sleep. (D and E) 6 h sleep deprivation also blocks AgRP neuron-mediated changes in power density during NREM sleep. (F-J) 6 h sleep deprivation attenuates the effects of chemogenetic stimulation of AgRP neurons on feeding and sleep/wake architecture. (F) 6 h sleep deprivation blocks AgRP neuron-mediated increases in feeding. (G) 6 h sleep deprivation blocks increases in wakefulness and (H) the frequency of microarousals in NREM sleep. (I and J) 6 h sleep deprivation also blocks AgRP neuron-mediated changes in power density during NREM sleep. (K-O) 6 h sleep deprivation attenuates the effects of food deprivation on feeding and sleep/wake architecture. (F) 6 h sleep deprivation blocks 24-h food deprivation-mediated increases in feeding. (G) 6 h sleep deprivation blocks increases in wakefulness and (H) the frequency of microarousals in NREM sleep. (I and J) 6 h sleep deprivation also blocks 24-h food deprivation-mediated changes in power density during NREM sleep. Data represent the mean ± standard error of the mean (SEM). Dots represent individual experimental animals. T-tests and post hoc comparisons: n.s. = not significant (p>0.05), **p<0.01, ***p<0.001, ****p<0.0001; also see Table S1.

References

    1. Andermann ML, and Lowell BB (2017). Toward a Wiring Diagram Understanding of Appetite Control. Neuron 95, 757–778. - PMC - PubMed
    1. Sternson SM, and Eiselt AK (2017). Three Pillars for the Neural Control of Appetite. Annual review of physiology 79, 401–423. - PubMed
    1. Saper CB, and Fuller PM (2017). Wake-sleep circuitry: an overview. Curr Opin Neurobiol 44, 186–192. - PMC - PubMed
    1. Weber F, and Dan Y (2016). Circuit-based interrogation of sleep control. Nature 538, 51–59. - PubMed
    1. Zimmerman CA, Leib DE, and Knight ZA (2017). Neural circuits underlying thirst and fluid homeostasis. Nat Rev Neurosci 18, 459–469. - PMC - PubMed

Publication types