. 2018 Dec 11;11(6):1479-1492.
doi: 10.1016/j.stemcr.2018.10.018. Epub 2018 Nov 21.

MYC Induces a Hybrid Energetics Program Early in Cell Reprogramming

Affiliations

MYC Induces a Hybrid Energetics Program Early in Cell Reprogramming

Javier Prieto et al. Stem Cell Reports. .

Abstract

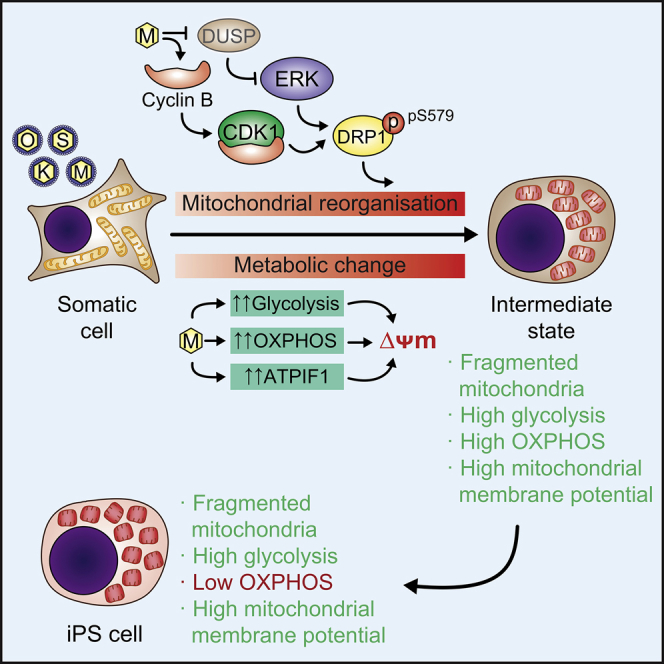
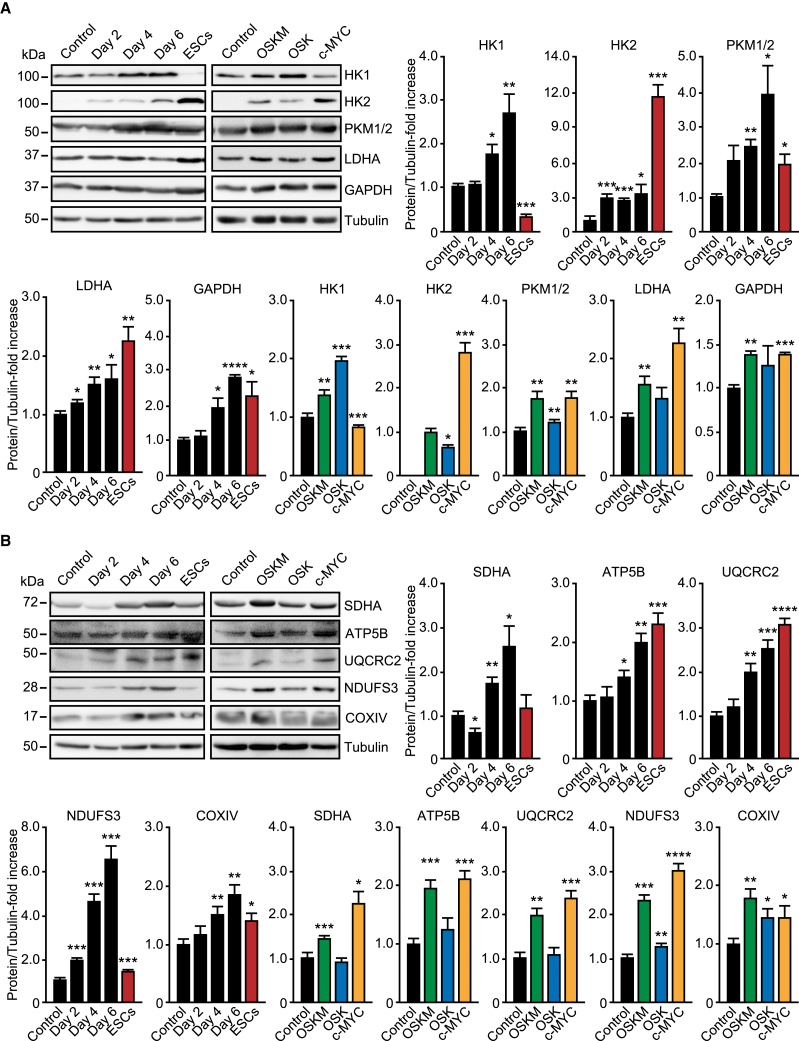
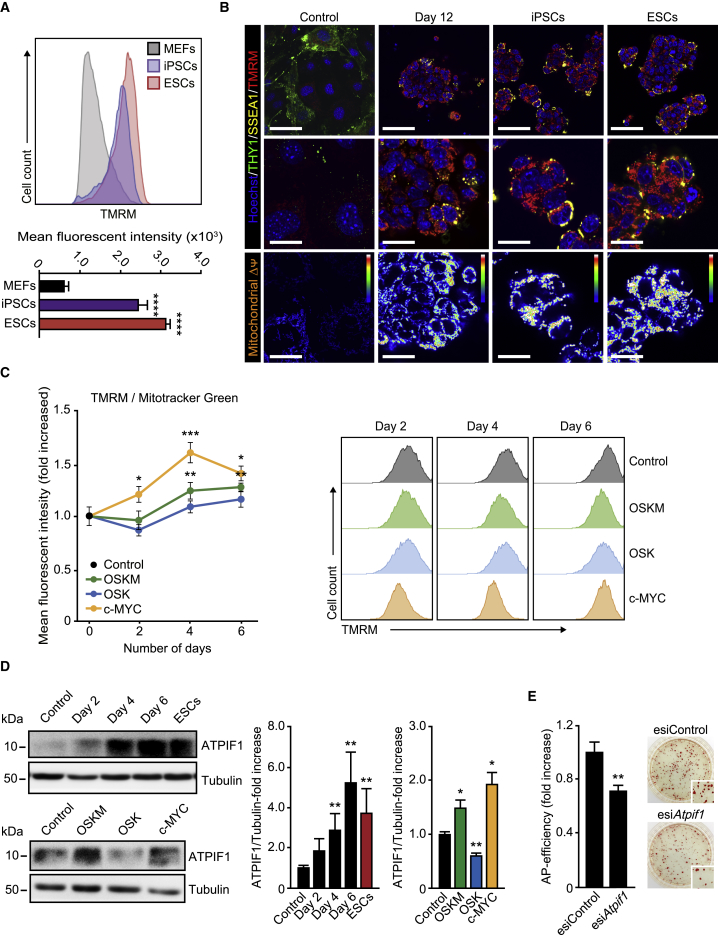
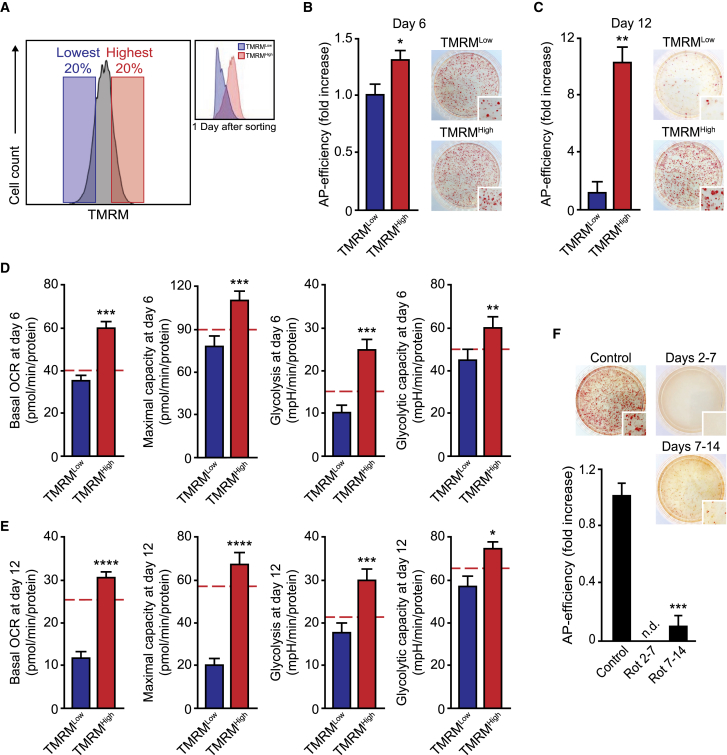
Cell reprogramming is thought to be associated with a full metabolic switch from an oxidative- to a glycolytic-based metabolism. However, neither the dynamics nor the factors controlling this metabolic switch are fully understood. By using cellular, biochemical, protein array, metabolomic, and respirometry analyses, we found that c-MYC establishes a robust bivalent energetics program early in cell reprogramming. Cells prone to undergo reprogramming exhibit high mitochondrial membrane potential and display a hybrid metabolism. We conclude that MYC proteins orchestrate a rewiring of somatic cell metabolism early in cell reprogramming, whereby somatic cells acquire the phenotypic plasticity necessary for their transition to pluripotency in response to either intrinsic or external cues.

Keywords: cell reprogramming; cell signaling; metabolism; mitochondrial dynamics.


Figures

None
Graphical abstract
Figure 1
Figure 1
Role of c-MYC in Cell Reprogramming-Induced Mitochondrial Fission (A) Representative bright-field images after alkaline phosphatase (AP) staining of plates containing MEFs after 25 days of either OSK (right panels) or OSKM (left panels) retroviral delivery in the presence of DMSO (control) or the MYC inhibitor 10058-F4 (ic-MYC, 10 μM). Inset shows a magnification of a selected area from the AP-stained plates. Data on the bottom left-hand side of the pictures represent the mean ± SEM of three independent experiments. (B) MEFs were mock-infected (control) or transduced with the indicated factors. At day 4 post transduction, cells were fixed and mitochondrial morphology assessed by immunofluorescence. Left panels: representative confocal images of MEFs stained with anti-TOM20 antibodies (red) before (control) or after expressing the indicated factors. Inset shows a black-and-white magnification of the pictures. DAPI (blue) was used as a nuclear counterstaining. Graph on the right shows the quantification of the different mitochondrial morphologies. (C) Representative confocal images of MEFs before (Control) or 4 days after OSKM, OSK, or c-MYC expression stained with anti-DRP1 (green) or anti-TOM20 (red) antibodies. DAPI (blue) was used as a nuclear counterstaining. Middle panels show a magnification of the pictures displayed in the upper panels. Bottom images are color map representations of the pictures in the middle panels to display co-localized pixels between both fluorophores according to the color bar shown on the upper-right corner of the pictures. Warm colors depict pixels with highly correlated intensity and spatial overlap while cold colors are indicative of random or anti-correlation. Graph on the right shows the quantification of the Pearson's correlation coefficient (PCC) to display the degree of co-localization between DRP1 and TOM20 in cells transduced with the indicated factors. Red dashed line indicates the levels of DRP1 and TOM20 co-localization found in ESCs. (D) Lysates of MEFs control or expressing OSKM, OSK, or c-MYC for 4 days were analyzed by immunoblotting using the indicated antibodies. Graphs on the right show the quantification of the data. Data represent mean ± SEM, one-tailed unpaired t test (n = 3): p < 0.05; ∗∗p < 0.01; ∗∗∗p < 0.001; ∗∗∗∗p < 0.0001. Scale bars, 24 μm in (B) and upper panels of (C); 12 μm in middle and bottom panels of (C). See also Figure S1.
Figure 2
Figure 2
Role of CDK1 in c-MYC-Induced DRP1-S579 Phosphorylation (A) Left panels: lysates from OSKM or c-MYC-transduced MEFs for 3.5 days that were incubated during 10 hr with DMSO (as vehicle control) or the CDK1 inhibitor RO-3306 (1 μM) were analyzed by immunoblotting using the indicated antibodies. Right graph shows the quantification of ERK1/2 or DRP1 phosphorylation ratios in cells treated with either DMSO (black bars) or RO-3306 (yellow bars). (B) OSKM-transduced cells for 3.5 days were incubated with DMSO (as vehicle control) or the CDK1 inhibitor RO-3306 (1 μM) for 10 hr (iCDK1). Cells were then fixed and mitochondrial morphology assessed by immunofluorescence. Left panels: representative confocal images of MEFs stained with anti-TOM20 antibodies (red). Inset shows a black-and-white magnification of the pictures. DAPI (blue) was used as a nuclear counterstaining. Graph on the right shows the quantification of the different mitochondrial morphologies observed. (C) Left panels show representative confocal images of MEFs expressing OSKM, together with DRP1 wild-type (DRP1WT) or the phosphomimetic S579D mutation (DRP1S579D), during 3.5 days. Cells were then treated, fixed, and stained as in (B). Graph on the right shows the quantification of the indicated mitochondrial morphologies observed in the cells transduced and treated as indicated. (D) Graphs showing the number of AP-positive colonies scored in MEFs after 25 days of OSKM retroviral delivery in the presence of DMSO (as vehicle control) or the CDK1 inhibitor RO-3306 (1 μM) (iCDK1) (panels on the right). Right panels: representative bright-field images from the plates of the indicated cultures after AP staining. Inset shows a magnification of a selected area from the AP-stained plates. Data represent mean ± SEM, one-tailed unpaired t test (n = 3): p < 0.05; ∗∗p < 0.01; ∗∗∗p < 0.001. Scale bars, 24 μm in (B) and (C). See also Figure S2.
Figure 3
Figure 3
Glycolysis and OXPHOS Are Induced by c-MYC Early in Cell Reprogramming (A) Principal Component 1 and 2 (PC1, PC2) projections of extracellular metabolite variations in conditioned medium taken from cells at day 4 post transduction with the indicated factors. PC1: R2 = 0.88, Q2 = 0.84; PC2: R2 = 0.08, Q2 = 0.07. (B) Graph displaying the loadings of metabolite variations along PC1 axis. (C) Time-course assessment of lactate accumulation (right graph) or glucose dissipation (left graph) in culture medium from ESCs or MEFs transduced with the indicated factors. (D) Graph displaying the basal oxygen consumption rate (OCR) in MEF control or expressing the indicated factors for the days shown. Red dashed line indicates basal OCR values in ESCs. Data represent mean ± SEM, one-tailed unpaired t test (n = 5 in A–C; n = 3 in D); all results were statistically significant (p < 0.05). See also Figures S3 and S4.
Figure 4
Figure 4
Induction of Glycolytic and OXPHOS Enzymes by c-MYC (A and B) Lysates of ESCs, MEFs control, or expressing OSKM for the specified days (left panels, black and red bars), or the indicated factors for 4 days (right panels, colored bars), were analyzed by immunoblotting using antibodies against the glycolytic (A) or OXPHOS (B) enzymes shown. Graphs show the quantification of the data. Data represent mean ± SEM, one-tailed unpaired t test (n = 3): p < 0.05; ∗∗p < 0.01; ∗∗∗p < 0.001; ∗∗∗∗p < 0.0001. See also Figure S5.
Figure 5
Figure 5
Increased Mitochondria Polarization during Cell Reprogramming (A) Representative flow-cytometry histograms of MEFs, induced pluripotent stem cells (iPSCs), and ESCs stained with TMRM to assess mitochondrial membrane potential. Graph underneath shows the quantification of the mean fluorescence intensity of the histograms shown above. (B) Representative confocal images of live MEFs before (Control) or 12 days after OSKM expression (Day 12), iPSCs, and ESCs stained with anti-THY1 (green) or anti-SSEA1 (yellow) antibodies, combined with the cell-permeable TMRM dye (red). Hoechst 33342 (blue) was used as a nuclear counterstaining. Lower pictures are color map representations of the pictures in the middle panels showing TMRM intensity according to the displayed color bar. Scale bars, 24 μm (upper images) and 12 μm (middle and bottom images). (C) Right: histograms of TMRM staining in MEFs expressing the indicated factors for the days shown. Left graph represents the TMRM/MitoTracker green ratio dynamics along the indicated days. (D) Lysates of MEF control, expressing OSKM for the specified days or ESCs (upper panels, black and red bars in the right graph), or the indicated factors for 4 days (lower panels, colored bars in the right graph) were analyzed by immunoblotting using the shown antibodies. Graphs on the right show the quantification of the data. (E) MEFs transduced with OSKM factors were transfected with esiRNAs targeting either eGFP (Control) or Atpif1 at day 1 post transduction. Graph shows the number of AP-positive colonies obtained after 25 days of retroviral delivery. Panels on the right show representative bright-field images from the plates of the indicated cultures after AP staining; inset shows magnification of a selected area from the AP-stained plates. Data represent mean ± SEM, one-tailed unpaired t test (n = 3): p < 0.05; ∗∗p < 0.01; ∗∗∗p < 0.001; ∗∗∗∗p < 0.0001. See also Figure S6.
Figure 6
Figure 6
Cells Prone to Reprogramming Display a Hybrid Metabolism (A) Flow-cytometry histograms illustrating the windows used for sorting OSKM-expressing cells based on their TMRM staining intensity (left histograms) and the TMRM profiles following overnight culture of the sorted cells at the indicated days post transduction (right histograms). (B and C) Graphs showing the number of AP-positive colonies scored in MEFs after 25 days of OSKM retroviral delivery that were sorted based on their TMRM loading intensity (TMRMLow or TMRMHigh) at day 6 (B) or day 12 (C) post transduction. Right panels: representative bright-field images from the plates of the indicated cultures after AP staining. Inset shows magnification of a selected area from the AP-stained plates. (D and E) Graphs displaying basal oxygen rate (OCR), maximal respiratory capacity, glycolytic flux (Glycolysis), or the glycolytic capacity of OSKM-transduced cells sorted as above at day 6 (D) or day 12 (E) post transduction. Dashed red lines show the values of the mean, corresponding to non-transduced MEF controls in each assay. (F) Graph showing the scoring of AP-positive colonies obtained in MEFs after 25 days of OSKM retroviral delivery incubated with DMSO (as vehicle control), or the ETC complex I inhibitor rotenone (0.5 μM) for the indicated days. Right panels: representative bright-field images from the plates of the indicated cultures after AP staining; inset shows magnification of a selected area from the AP-stained plates. Data represent mean ± SEM, one-tailed unpaired t test (n = 3): p < 0.05; ∗∗p < 0.01; ∗∗∗p < 0.001; ∗∗∗∗p < 0.0001; n.d., not detected. See also Figure S6.

Similar articles

Cited by

References

    1. Abad M., Mosteiro L., Pantoja C., Cañamero M., Rayon T., Ors I., Graña O., Megías D., Domínguez O., Martínez D. Reprogramming in vivo produces teratomas and iPS cells with totipotency features. Nature. 2013;502:340–345. - PubMed
    1. Apostolou E., Hochedlinger K. Chromatin dynamics during cellular reprogramming. Nature. 2013;502:462–471. - PMC - PubMed
    1. Bretones G., Delgado M.D., León J. MYC and cell cycle control. Biochim. Biophys. Acta. 2015;1849:506–516. - PubMed
    1. Buganim Y., Faddah D.A., Cheng A.W., Itskovich E., Markoulaki S., Ganz K. Single-cell expression analyses during cellular reprogramming reveal an early stochastic and a late hierarchic phase. Cell. 2012;150:1209–1222. - PMC - PubMed
    1. Cao Y., Guo W.T., Tian S., He X., Wang X.W., Liu X., Gu K.L., Ma X., Huang D., Hu L. miR-290/371-Mbd2-MYC circuit regulates glycolytic metabolism to promote pluripotency. EMBO J. 2015;34:609–623. - PMC - PubMed

Publication types

Substances