. 2019 Mar 5;29(3):681-694.e5.
doi: 10.1016/j.cmet.2018.10.016. Epub 2018 Nov 21.

Defined Paraventricular Hypothalamic Populations Exhibit Differential Responses to Food Contingent on Caloric State

Affiliations

Defined Paraventricular Hypothalamic Populations Exhibit Differential Responses to Food Contingent on Caloric State

Chia Li et al. Cell Metab. .

Abstract

Understanding the neural framework behind appetite control is fundamental to developing effective therapies to combat the obesity epidemic. The paraventricular hypothalamus (PVH) is critical for appetite regulation, yet, the real-time, physiological response properties of PVH neurons to nutrients are unknown. Using a combination of fiber photometry, electrophysiology, immunohistochemistry, and neural manipulation strategies, we determined the population dynamics of four molecularly delineated PVH subsets implicated in feeding behavior: glucagon-like peptide 1 receptor (PVHGlp1r), melanocortin-4 receptor (PVHMc4r), oxytocin (PVHOxt), and corticotropin-releasing hormone (PVHCrh). We identified both calorie- and state-dependent sustained activity increases and decreases in PVHGlp1r and PVHCrh populations, respectively, while observing transient bulk changes of PVHMc4r, but no response in PVHOxt, neurons to food. Furthermore, we highlight the role of PVHGlp1r neurons in orchestrating acute feeding behavior, independent of the anti-obesity drug liraglutide, and demonstrate the indispensability of PVHGlp1r and PVHMc4r, but not PVHOxt or PVHCrh neurons, in body weight maintenance.

Keywords: fast versus refed; feeding behavior; hypothalamus; obesity; photometry recordings; population dynamics.


Conflict of interest statement

Declaration of Interests

DPO receives research support from NovoNordisk.

Figures

Figure 1.
Figure 1.
Fos Induction Across Demarcated Regions of the PVH in Fasted Versus Refed Animals. See also Figure S1. A. Quantitative heat map of Fos induction in designated regions of the PVH. Fasted condition on the left, Refed condition on the right; PaAP anterior parvicellualr, PaMM medial magnocellular, PaV ventral, PaLM lateral magnocellular, PaDC dorsal cap, PaMP medial parvicellular, PaPo post. B. Total number of PVHFos cells in each defined region of the PVH in Fasted versus Refed conditions. (n=3 per group, values are means ± SEM. *p<0.05, **p<0.01, ***p<0.001.
Figure 2.
Figure 2.
Fos Induction Across Molecularly-Defined Subpopulations of the PVH in Fasted Versus Refed Animals. See also Figure S2-S3. A. Schematic of the PVH representing putative expression of Glp1r, Mc4r, Oxt and Crh populations. B. Percentage of overlap of each PVH population (left to right: Glp1r, Mc4r, Oxt, Crh). C-F. Representative images of Fos induction and quantification of total number of defined PVH cells expressing Fos (yellow cells; left panel), % of Fos-expressing cells in defined PVH population (yellow cells/red cells; middle panel) and % of defined PVH cells expressing Fos (yellow cells/green cells; right panel) in Fasted versus Refed mice, Glp1r, Mc4r, Oxt and Crh, respectively. Scale bar represents 25mm (n=3 per group, values are means ± SEM. *p<0.05, **p<0.01, ***p<0.001.
Figure 3.
Figure 3.
State-Dependent Electrical Properties of PVHGlp1 Neurons. See also Figure S4. A. Representative anatomical position of each recorded cell by firing rate (circles=Fasted, n=27; squares=Refed, n=27) across the PVH. B-D. PVHGlp1 neurons exhibited a significantly increased action potential firing rate in the Refed versus Fasted state, values are means ± SEM. **p<0.01.
Figure 4.
Figure 4.
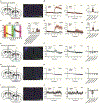
Sensory Detection of Food Rapidly Regulates PVH Subpopulations. See also Figure S5. A, E, G, I.Brain schematic of viral injection/fiber implantation and coronal section showing path of optical fiber and injection site in Glp1r-ires-Cre, Mc4r-t2a-Cre, Oxt-ires-Cre and Crh-ires-Cre mice, respectively. Scale bar represents 1mm. B, F, H, J. Plot of calcium signals from PVHGlp1r, PVHMc4r, PVHOxt and PVHCrh neurons, respectively aligned to the time of presentation of a chow pellet (colored) or inedible object (black). Mice were either subjected to an overnight fast (left panel) or fed ad libitum (middle panel) prior to the experiment. Light color tones indicate SEM. Quantification of fluorescence changes 5 min after event, as indicated (right panel). C. (Left panel) Calcium signals of PVHGlp1r neurons in fasted mice presented first with caged chow (inaccessible period 0–20 min) and then available chow (accessible period 20–40 min). (Right panel) Quantification of fluorescence changes. Times shown are 5 min windows before, immediately after and 15–20 min after inaccessible food presentation, immediately after and 15–20 min after accessible food access. D. Plot of calcium signals of PVHGlp1r neurons aligned to the time of presentation of a HFD pellet (colored) or inedible object (black). Mice were either subjected to an overnight fast (left panel) or fed ad libitum (middle panel) prior to the experiment. Light color tones indicate SEM. Quantification of fluorescence changes 5 min after event, as indicated (right panel). Values are means ± SEM. *p<0.05, **p<0.01, ***p<0.001, ****p<0.0001.
Figure 5.
Figure 5.
Chemogenetic activation of PVHGlp1r Neurons Acutely Suppresses Appetite. See also Figure S6. A. Brain schematic of viral injection. B. Transduction of PVHGlp1r neurons with hM3Dq-mCherry. C. CNO application lowered the resting membrane potential and elevated the firing rate of PVHGlp1r neurons, n=5. D-K. Chemogenetic activation of PVHGlp1r neurons reduced food intake (D) during the dark cycle and (E) re-feeding following an overnight fast but did not influence (F) oxygen consumption, (G) respiratory exchange ratio in the absence of food, (H-I) dark cycle ambulatory activity in the absence of food, (J) serum corticosterone levels or (K) anxiety-like behavior in an open field assay; Scale bar represents 25mm, n=7, values are means ± SEM. *p<0.05, **p<0.01, ***p<0.001, ****p<0.0001.
Figure 6.
Figure 6.
Chemogenetic inhibition of PVHGlp1r Neurons Acutely Evokes Hunger. See also Figure S6. A. Brain schematic of viral injection. B. Transduction of PVHGlp1r neurons with hM4Di-mCherry. C. CNO application increased the resting membrane potential and reduced the firing rate of PVHGlp1r neurons, n=5. D-E. Chemogenetic silencing of PVHGlp1r neurons elicited (D) ad libitum food intake during the light cycle and (E) and increased the motivation to work for a food reward in a progressive ratio nosepoke assay in calorically replete mice, but not to the magnitude of fasted mice, n=8. F. A. Brain schematic of viral injection. G. Transduction of PVHGlp1r neurons with KORD-ires-mCitrine. H. Photograph of specialized homecage with designated zones. I-J. Chemogenetic silencing of PVHGlp1r neurons (I) stimulated food intake (J) diminished latency to eat and (K) enhanced time spent in the FED Zone in calorically replete mice, but not to the magnitude of fasted mice, effects that were reversed upon liraglutide pretreatment. Scale bar represents 25mm, n=10, values are means ± SEM. *p<0.05, **p<0.01, ***p<0.001, ****p<0.0001.
Figure 7.
Figure 7.
Chronic Perturbation of Select PVH Populations Induces Obesity. See also Figure S7. A, C, E, G. Brain schematic of viral injection and representative image of (A) PVHGlp1r (C) PVHMc4r (E) PVHOxt or (G) PVHCrh neural transduction with eGFP-2a-TeNT. B, D, F, H. Permanent silencing of (B) PVHGlp1r or (D) PVHMc4r but not (F) PVHOxt or (H) PVHCrh neurons significantly enhanced body weight, fat mass, lean mass and food intake compared to mice transduced with GFP and these changes were significantly correlated to number of neurons expressing eGFP-2a-TeNT. Scale bar represents 25mm, n=or>6 per group, values are means ± SEM. *p<0.05, **p<0.01, ***p<0.001, ****p<0.0001.

References

    1. Adams JM, Pei H, Sandoval DA, Seeley RJ, Chang RB, Liberles SD, and Olson DP (2018). Liraglutide Modulates Appetite and Body Weight Via GLP-1R-Expressing Glutamatergic Neurons. Diabetes - PMC - PubMed
    1. Alhadeff AL, Baird JP, Swick JC, Hayes MR, and Grill HJ (2014). Glucagon-like Peptide-1 receptor signaling in the lateral parabrachial nucleus contributes to the control of food intake and motivation to feed. Neuropsychopharmacology 39, 2233–2243. - PMC - PubMed
    1. Alhadeff AL, Mergler BD, Zimmer DJ, Turner CA, Reiner DJ, Schmidt HD, Grill HJ, and Hayes MR (2017). Endogenous Glucagon-like Peptide-1 Receptor Signaling in the Nucleus Tractus Solitarius is Required for Food Intake Control. Neuropsychopharmacology 42, 1471–1479. - PMC - PubMed
    1. Anand BK, Dua S, and Shoenberg K (1955). Hypothalamic control of food intake in cats and monkeys. J Physiol 127, 143–152. - PMC - PubMed
    1. Atasoy D, Aponte Y, Su HH, and Sternson SM (2008). A FLEX switch targets Channelrhodopsin-2 to multiple cell types for imaging and long-range circuit mapping. J Neurosci 28, 7025–7030. - PMC - PubMed

Publication types