Analysis of spliceosome dynamics by maximum likelihood fitting of dwell time distributions
- PMID: 30472247
- PMCID: PMC6363122
- DOI: 10.1016/j.ymeth.2018.11.014
Analysis of spliceosome dynamics by maximum likelihood fitting of dwell time distributions
Abstract
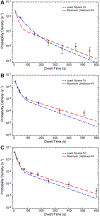
Colocalization single-molecule methods can provide a wealth of information concerning the ordering and dynamics of biomolecule assembly. These have been used extensively to study the pathways of spliceosome assembly in vitro. Key to these experiments is the measurement of binding times-either the dwell times of a multi-molecular interaction or times in between binding events. By analyzing hundreds of these times, many new insights into the kinetic pathways governing spliceosome assembly have been obtained. Collections of binding times are often plotted as histograms and can be fit to kinetic models using a variety of methods. Here, we describe the use of maximum likelihood methods to fit dwell time distributions without binning. In addition, we discuss several aspects of analyzing these distributions with histograms and pitfalls that can be encountered if improperly binned histograms are used. We have automated several aspects of maximum likelihood fitting of dwell time distributions in the AGATHA software package.
Keywords: Dynamics; Fitting; Fluorescence; Single-molecule; Software; Spliceosome.
Copyright © 2018 Elsevier Inc. All rights reserved.
Figures


Similar articles
-
Methodologies for studying the spliceosome's RNA dynamics with single-molecule FRET.Methods. 2017 Aug 1;125:45-54. doi: 10.1016/j.ymeth.2017.05.011. Epub 2017 May 18. Methods. 2017. PMID: 28529063 Free PMC article. Review.
-
Single molecule analysis reveals reversible and irreversible steps during spliceosome activation.Elife. 2016 May 31;5:e14166. doi: 10.7554/eLife.14166. Elife. 2016. PMID: 27244240 Free PMC article.
-
Dynamics and consequences of spliceosome E complex formation.Elife. 2017 Aug 22;6:e27592. doi: 10.7554/eLife.27592. Elife. 2017. PMID: 28829039 Free PMC article.
-
Extending the absorbing boundary method to fit dwell-time distributions of molecular motors with complex kinetic pathways.Proc Natl Acad Sci U S A. 2007 Feb 27;104(9):3171-6. doi: 10.1073/pnas.0611519104. Epub 2007 Feb 21. Proc Natl Acad Sci U S A. 2007. PMID: 17360624 Free PMC article.
-
RNA splicing. Activity in the spliceosome.Curr Biol. 1994 May 1;4(5):462-4. doi: 10.1016/s0960-9822(00)00104-4. Curr Biol. 1994. PMID: 7922366 Review.
Cited by
-
Dynamics and Evolutionary Conservation of B Complex Protein Recruitment During Spliceosome Activation.bioRxiv [Preprint]. 2024 Aug 8:2024.08.08.606642. doi: 10.1101/2024.08.08.606642. bioRxiv. 2024. Update in: Nucleic Acids Res. 2025 Feb 08;53(4):gkaf124. doi: 10.1093/nar/gkaf124. PMID: 39149324 Free PMC article. Updated. Preprint.
-
Identification of transient intermediates during spliceosome activation by single molecule fluorescence microscopy.Proc Natl Acad Sci U S A. 2022 Nov 29;119(48):e2206815119. doi: 10.1073/pnas.2206815119. Epub 2022 Nov 23. Proc Natl Acad Sci U S A. 2022. PMID: 36417433 Free PMC article.
-
Disassembly of unstable RNA structures by an E. coli DEAD-box chaperone accelerates ribosome assembly.Nucleic Acids Res. 2025 Feb 8;53(4):gkaf104. doi: 10.1093/nar/gkaf104. Nucleic Acids Res. 2025. PMID: 39988318 Free PMC article.
-
RNA Modifications and Prp24 Coordinate Lsm2-8 Binding Dynamics during S. cerevisiae U6 snRNP Assembly.bioRxiv [Preprint]. 2025 Feb 27:2025.02.25.639938. doi: 10.1101/2025.02.25.639938. bioRxiv. 2025. Update in: J Biol Chem. 2025 May;301(5):108497. doi: 10.1016/j.jbc.2025.108497. PMID: 40060616 Free PMC article. Updated. Preprint.
-
A sequential binding mechanism for 5' splice site recognition and modulation for the human U1 snRNP.Nat Commun. 2024 Oct 10;15(1):8776. doi: 10.1038/s41467-024-53124-5. Nat Commun. 2024. PMID: 39389991 Free PMC article.
References
-
- Nilsen TW, The spliceosome: the most complex macromolecular machine in the cell?, Bioessays 25(12) (2003) 1147–1149. - PubMed
-
- Wahl MC, Will CL, Lührmann R, The spliceosome: design principles of a dynamic RNP machine, Cell 136(4) (2009) 701–718. - PubMed
-
- Shi Y, Mechanistic insights into precursor messenger RNA splicing by the spliceosome, Nature Reviews Molecular Cell Biology 18(11) (2017) 655. - PubMed
Publication types
MeSH terms
Substances
Grants and funding
LinkOut - more resources
Full Text Sources

